PromQL Tutorial: Beginner to Advanced
1. What is Prometheus?
PromQL Tutorial: Beginner to Advanced
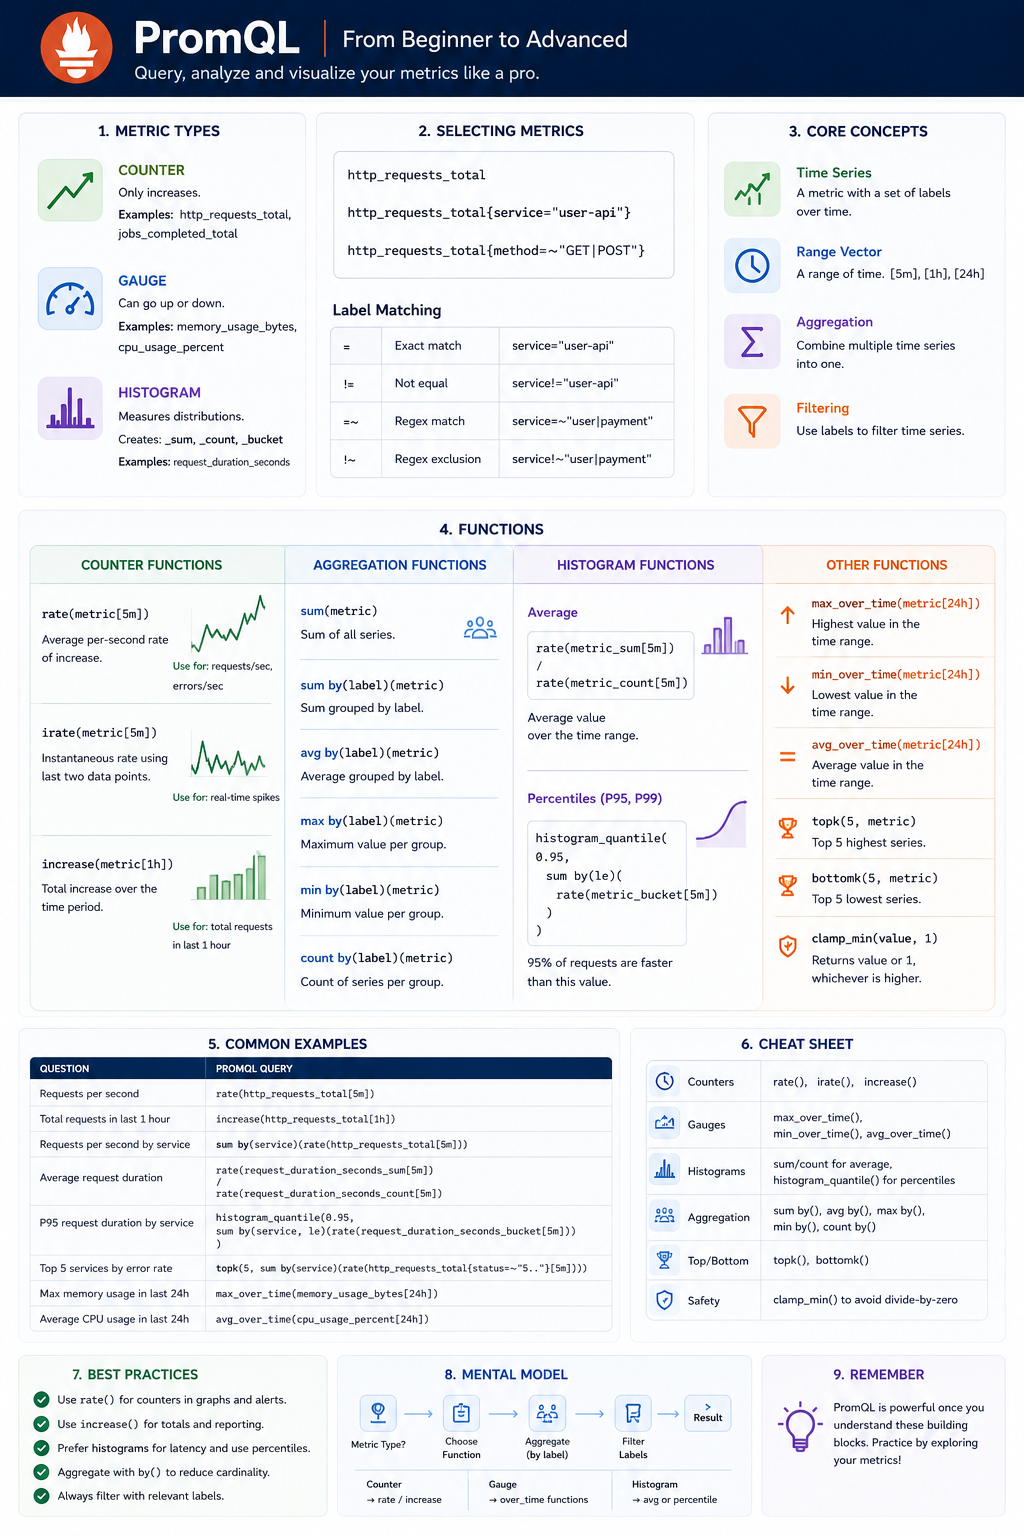
1. What is Prometheus?
Prometheus is a monitoring system that collects metrics from applications, servers, databases, Kubernetes clusters, APIs, and distributed systems.
Prometheus stores data as time series.
A time series consists of:
- Metric name
- Labels
- Value
- Timestamp
Example:
http_requests_total{service="user-api",method="GET"} 1500This means:
- Metric: http_requests_total
- Labels: service=user-api method=GET
- Current value: 1500
2. Metric Types
Understanding metric types is the foundation of PromQL.
Counter
A counter only increases.
Examples:
http_requests_total
workflow_completed_total
jobs_processed_total
Values:
10
11
12
13
14
Questions counters answer:
- How many requests occurred?
- How many jobs completed?
- How many errors happened?
Gauge
A gauge can increase or decrease.
Examples:
memory_usage_bytes
cpu_usage_percent
queue_depth
active_connections
Values:
100
120
90
150
Questions gauges answer:
- Current memory usage?
- Queue size?
- Active users?
Histogram
Histograms measure distributions.
Example:
request_duration_secondsPrometheus automatically creates:
request_duration_seconds_sum
request_duration_seconds_count
request_duration_seconds_bucket
Questions histograms answer:
- Average duration?
- P95 latency?
- P99 latency?
3. Selecting Metrics
Basic query:
http_requests_totalReturns all matching time series.
Equivalent idea:
SELECT *
FROM metrics
WHERE metric='http_requests_total'
4. Labels
Labels are similar to SQL WHERE conditions.
Example metric:
http_requests_total{
    service="user-api",
    method="GET"
}
Filter by label:
http_requests_total{
  service="user-api"
}
Equivalent SQL:
WHERE service='user-api'5. Label Matching
Exact match:
service="user-api"Not equal:
service!="user-api"Regex match:
service=~"user|payment"Regex exclusion:
service!~"user|payment"6. rate()
One of the most important PromQL functions.
Used with counters.
Suppose:
Time Value10:00 100
10:05 200Increase:
100Time elapsed:
300 secondsRate:
100 / 300
=
0.333 per second
Query:
rate(http_requests_total[5m])Meaning:
“Average requests per second during the last 5 minutes.”
Common usage:
- Requests per second
- Errors per second
- Jobs per second
7. irate()
Instantaneous rate.
Uses only the most recent samples.
irate(http_requests_total[5m])Useful for:
- Real-time spikes
- Short-term bursts
Not ideal for long-term trends.
8. increase()
Calculates total increase over a period.
increase(http_requests_total[1h])Meaning:
“How many requests occurred during the last hour?”
Example:
Start: 1000
End: 1600
Increase: 600Result:
600 requests9. sum()
Aggregates multiple time series.
Example:
instance1 = 100
instance2 = 200
instance3 = 300
Query:
sum(metric)Result:
600Equivalent SQL:
SELECT SUM(value)10. sum by()
Most important aggregation operator.
Think:
GROUP BYExample:
instance1 service=api value=100
instance2 service=api value=200
instance1 service=web value=50
instance2 service=web value=150Query:
sum by(service)(
  metric
)
Result:
api = 300
web = 200
Equivalent SQL:
SELECT service,
       SUM(value)
GROUP BY service
11. avg by()
Average per group.
avg by(service)(
  metric
)
Equivalent SQL:
AVG(value)
GROUP BY service
12. max by()
Maximum value per group.
max by(service)(
  metric
)
Useful for:
- Highest memory usage
- Highest CPU usage
- Largest queue
13. min by()
Minimum value per group.
min by(service)(
  metric
)
14. count by()
Counts matching time series.
count by(service)(
  metric
)
Useful for:
- Number of pods
- Number of workers
- Number of active instances
15. Histogram Fundamentals
Histograms generate:
_sum
_count
_bucket
Suppose durations are:
5 sec
10 sec
15 sec
20 sec
Prometheus stores:
_sum = 50
_count = 4
Average:
50 / 4
=
12.5 sec
16. Average from Histograms
Formula:
rate(metric_sum[5m])
/
rate(metric_count[5m])
Meaning:
“Average value during last 5 minutes.”
17. Percentiles
Percentiles are usually more useful than averages.
Examples:
- P50
- P90
- P95
- P99
P95 means:
“95% of requests finished faster than this value.”
18. histogram_quantile()
Used to calculate percentiles.
Example:
histogram_quantile(
  0.95,
  sum by(le)(
    rate(
      request_duration_seconds_bucket[5m]
    )
  )
)
Returns:
P95 latencyCommon values:
0.50 = P50
0.90 = P90
0.95 = P95
0.99 = P99
19. Top K Queries
Largest values.
topk(
  5,
  metric
)
Examples:
- Top 5 busiest APIs
- Top 5 highest memory consumers
- Top 5 slowest services
20. Bottom K Queries
Smallest values.
bottomk(
  5,
  metric
)
Examples:
- Least utilized nodes
- Lowest traffic services
21. max_over_time()
Used on gauges.
max_over_time(
  memory_usage_bytes[24h]
)
Meaning:
“Highest memory usage during last 24 hours.”
22. min_over_time()
min_over_time(
  memory_usage_bytes[24h]
)
Meaning:
“Lowest memory usage during last 24 hours.”
23. avg_over_time()
avg_over_time(
  cpu_usage[24h]
)
Meaning:
“Average CPU usage during last 24 hours.”
24. sum_over_time()
sum_over_time(
  queue_depth[24h]
)
Adds all samples together over time.
Less commonly used.
25. clamp_min()
Protects against divide-by-zero.
Without:
100 / 0Bad.
With:
100 / clamp_min(value, 1)Safe.
26. Query Building Strategy
When building PromQL:
Step 1
Ask:
“What metric type am I querying?”
- Counter
- Gauge
- Histogram
Step 2
Choose the correct function:
Counter:
rate()
increase()
Gauge:
max_over_time()
avg_over_time()
min_over_time()
Histogram:
sum/count
histogram_quantile()
Step 3
Choose aggregation:
sum by(...)
avg by(...)
max by(...)
count by(...)
Step 4
Filter labels.
Example:
sum by(service)(
  rate(
    http_requests_total{
      environment="prod"
    }[5m]
  )
)
Read as:
“Requests per second grouped by service in production during the last 5 minutes.”
Mental Model
When you see a Counter:
Think:
rate()
increase()
When you see a Gauge:
Think:
current value
max_over_time()
avg_over_time()
When you see a Histogram:
Think:
_sum
_count
_bucket
Average = sum/countPercentiles = histogram_quantile()When you see:
sum by(...)
avg by(...)
max by(...)
Think:
GROUP BYThis single mental model is enough to understand the majority of production PromQL queries.
메타데이터
- post_id
- 9affcfbab598
- slug
- promql-tutorial-beginner-to-advanced-9affcfbab598
- url
- https://medium.com/@riyarc/promql-tutorial-beginner-to-advanced-9affcfbab598
- canonical_url
- https://medium.com/@riyarc/promql-tutorial-beginner-to-advanced-9affcfbab598
- author_url
- https://medium.com/@riyarc
- status
- ok
- fetched_at
- 2026-07-13 06:23:13