Let’s Talk Garbage — Great Pacific Garbage Patch Part 1
This blog presents a readable, hopefully, summary of the pea soup of plastic that’s to be found in parts of our oceans and how it is…
Let’s Talk Garbage — Great Pacific Garbage Patch Part 1
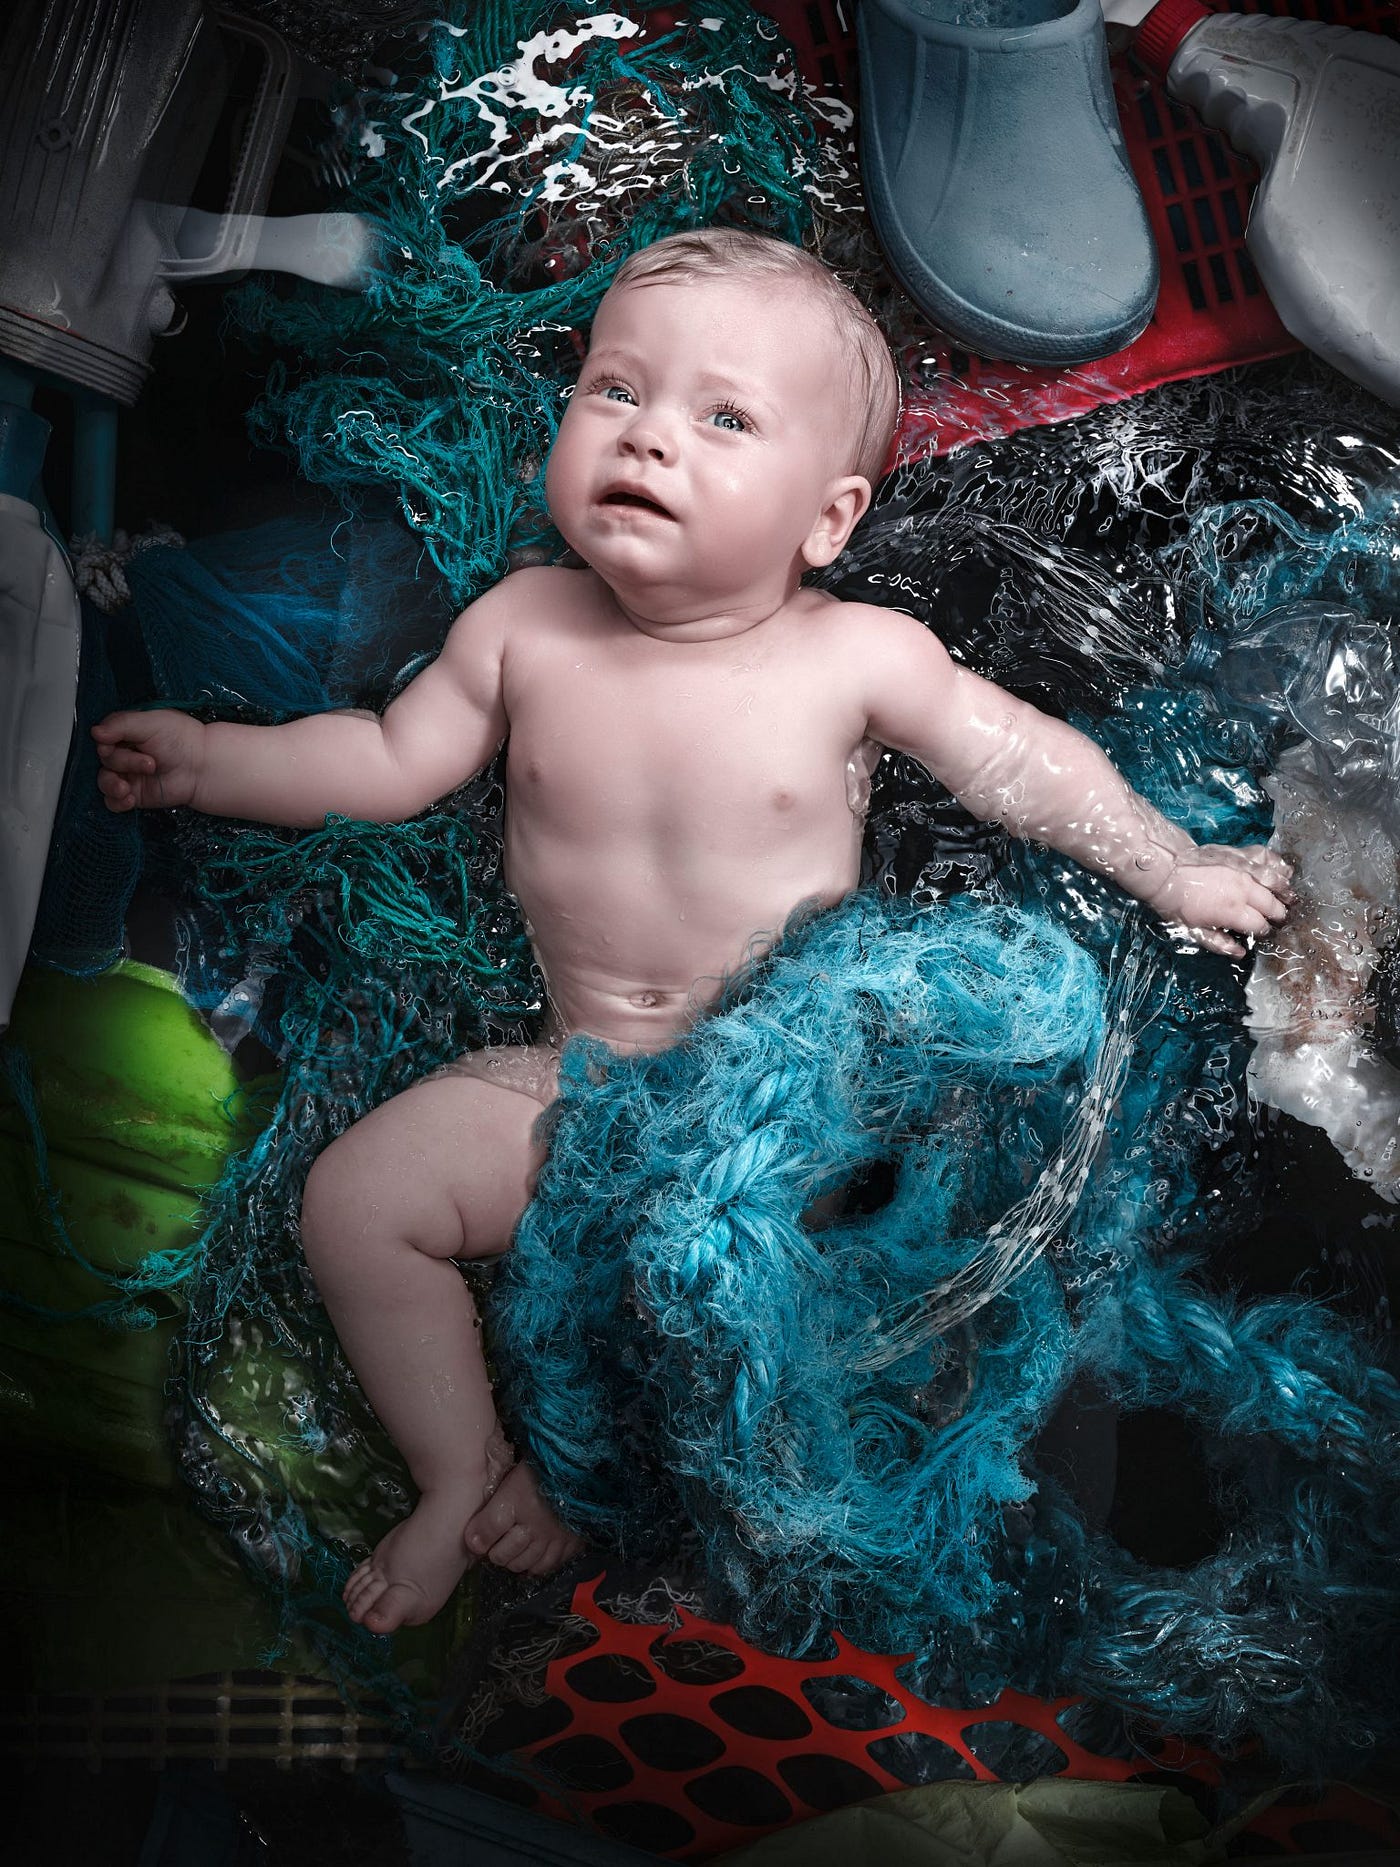
Source ‘The Plastic Ocean Underwater Gallery’ (Ref 1)
1. Walk down Memory Lane
Some of you may remember we previously had a chat about Plastic Ocean Patches (POPs) of garbage, which I published on my beBee blog back in 2000 (see link below):
Now, some five years later, I figure it’s time to record what developments have occurred since then, in order to better understand:
(i) the composition and distribution of garbage in our oceans;
(ii) where it comes from; and also
(ii) the progress made, if any, in cleaning up these garbage POPs.
In the course of researching this information, however, I’ve discovered the complexity of ocean garbage, based mostly on sampling and studies conducted in the largest ocean POP, ie the Great Pacific Garbage Patch, and hence only the conceptual origins and constituent parts of the ocean garbage will be discussed in this current blog, with its more specific origins (by country) published in a later Part 2 blog, and the ongoing clean-up process in a Part 3 blog.
But first let’s summarise these ‘top of the pops’ phenomena (yes there are several POPs) from my earlier beBee blog post:
(1) How are they formed? Flotsam and jetsam is discarded, either directly or indirectly, into drains, streams and rivers, then ultimately into our oceans, or dumped overboard from vessels. This floating garbage is then moved by circulating ocean currents, or gyres, eventually being entrapped in the centre of these gyres, where they continue to get bigger.
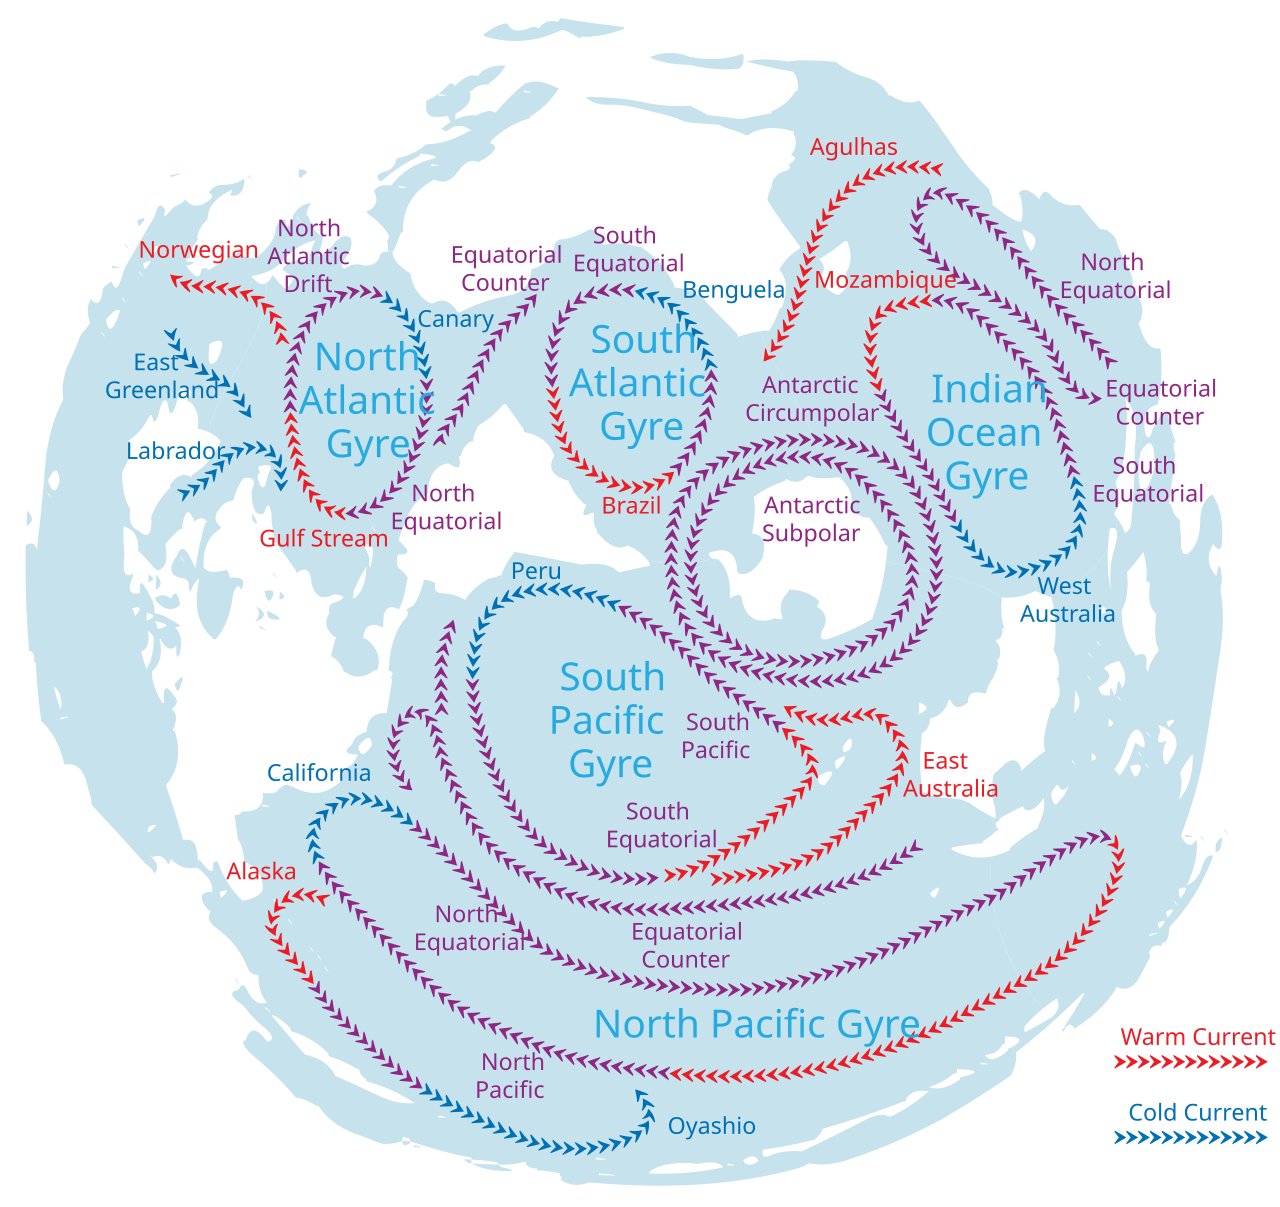
The ocean gyres from an Antarctic perspective (sourced from Avsa in Wikipedia, Ref 2)
(2) Where are they? Swirling gyres (and hence POPs) are found in the Indian Ocean, the North and South Pacific Oceans, and the North and South Atlantic Oceans. The largest of these is the Great Pacific Ocean Patch, located in the North Pacific, between Hawaii and California.
(3) How Big? The Great Pacific Garbage Patch was estimated by The Ocean Cleanup, a few years ago, to be twice the size of Texas and growing (for more info refer the above beBee link).
(4) What’s in these POPs? The oceancleanup.com (Ref 3) has reported that the Great Pacific Garbage Patch consists primarily of microplastics (“fingernail-sized or smaller”), comprising in turn “rigid or hard polyethylene (PE) or polypropylene (PP), or derelict fishing gear (the latter typically as nets or net fragments)”.
The composition of the POPs (and in particular the Great Pacific Garbage Patch) will be expanded below in light of more recent information (or rather more recent publications, the information contained in which may not necessarily all be recent).
2. Let’s Define Plastic and its Sizes
The following list comes from Plastic Measures (Ref 4) and seems, at least from the perspective of an outsider (like me) looking into the guts of the problem, a good place to begin understanding plastic garbage. I have expanded upon the original examples using the assistance of Dr Google’s AI assistant:
(i) PET (polyethylene terephthalate) eg water and some other drink bottles; some food containers such as peanut butter jars and microwavable containers; clear film for some packaging, surgical sutures, solar panel lamination; some textiles such as polyester fabrics, fleece jackets, and parts of carpets.
(ii) HDPE (high-density polyethylene) eg some bottles for cleaning products and shampoos, milk jugs, some motor oil containers, some bottle caps; some water and gas pipes; some cutting boards, toys, outdoor furniture, and recycling bins; some fuel tanks, chemical drums, marine pile guards and fenders, orthotics and prosthetics.
(iii) LDPE (low-density polyethylene) eg plastic grocery and garbage bags, plastic cling wrap, squeeze bottles; tubing such as for irrigation lines; six-pack rings; some cable and wire applications; sheets to cover greenhouses and to act as weed control on the soil.
(iv) PVC (polyvinyl chloride) eg credit and gift cards; some pipes for plumbing and drainage; cable ducting and insulation; some flooring such as vinyl tiles and sheets; blood bags, tubing and IV bags; automotive dashboards, door panels, and some seat covers; some synthetic leather and other coated fabrics for fashion and footwear; inflatable toys and pools.
(v) PP (polypropylene) eg some bottle caps; some vehicle bumpers, dashboards, interior trim and battery cases; medical syringes, vials and pill containers; ropes, carpets and some reusable shopping bags; some household storage containers, kitchenware and garden furniture.
(vi) PS (polystyrene)
- in solid form, eg some disposable cutlery, yogurt containers, CD/DVD cases, petri dishes, lab test tubes; or
- in foam form, eg packaging materials for food and fragile items; styrofoam cups and containers for takeaway food; wall, roofing, and flooring insulation for buildings.
(vii) Other plastics such as nylon, polyester, acrylic, and elastane (Spandex/Lycra) used in clothing and some home textiles.
The above list of plastic types and typical examples, although not complete by any means, serves to illustrate just how dependent we have become on plastics and just what an ocean (pun intentional) of plastic is out there.
A number of different plastic size terms are used in the literature covering the POP topic, and so these are defined below from theoceancleanup.com (Ref 5):
– Microplastics, 0.05–0.5 cm, or for my American readers 0.02–2 inches. – Mesoplastics, 0.5–5 cm, or 0.2–2 inches. – Macroplastics, 5–50 cm or 2 to 20 inches. – Megaplastics, anything above 50 cm, or above 20 inches.
These size terms will be referred further in the following sections of this blog.
3. Plastic Flow from Go to Woa
Before we launch into the literal ‘flowline’ of plastic waste, let’s look at some numbers. It appears (Ref 4 and Ref 6) that our homo sapiens species produces over an estimated 400 million tonnes of plastic per year, of which about two thirds is discarded within a month. In other words most of the plastic we produce is single-use, such as packing elements. Furthermore, assuming there are 8 billion of us on the planet at an average weight of 50kg each, we are producing our approximate total body weight in plastic every year.
Thankfully, not all of this plastic ends up in our environment, with much being collected as waste and some (less than 10%) being recycled. This leaves, however, about an estimated 20 million tonnes of plastic waste per year (Ref 4 and 7) “to infiltrate almost every conceivable ecosystem, from the peaks of the Himalayas to the bottom of the Mariana Trench, which includes the deepest-known point in the ocean” (Ref 4). Furthermore, of the plastic waste that is collected and disposed into landfill, much of this will eventually break down into microplastics and nanoplastics and contaminate the adjacent soil and groundwater. Here it should be noted that nanoplastics are even smaller than microplastics, being in the size range of 1 to 1000 nanometres, where one nanometer is a billionth of a metre, or a millionth of a millimetre.
Some of these estimates of mass of plastic waste vary slightly between publications, but the numbers are still mind boggling either way.
The contributions by individual countries to plastic litter vary across the world as follows (from Ref 6):
(i) High income countries — utilise relatively higher amounts of plastic, but have relatively effective waste management, resulting in relatively low plastic emissions to the environment.
(ii) Low income countries — utilise relatively lower amounts of plastic, hence plastic emissions are also relatively low, despite inefficient disposal management systems.
(iii) Middle income countries — these are where plastic use appears to be growing the most and, coupled with inadequate management disposal systems, results in most plastic being emitted from these middle income countries.
And so to the flow mechanisms. Discarded plastics find their way from drains and hardstanding areas into streams and rivers, particularly during severe rainfall events, when discharges can increase ‘tenfold’ (Ref 6). Not all plastic finds its way into the ocean, however, and hence is conveyed by ocean currents and gyres into the Plastic Ocean Patches (POPs), with many items either sinking to the streambeds and riverbeds, or being caught up in flow restrictions. Some plastic items with short buoyancy capability will also sink to the bottom of the ocean.
Nevertheless, rivers are still the main contributors to the plastic waste that eventually finds its way into our oceans and hence into the POPs such as the Great Pacific Garbage Patch.
Within a month or so of the remaining plastic floating into the ocean, it has been estimated (Ref 6) that 80% will wash up on shorelines and beaches, where they will ultimately remain, although some items may be washed out to sea again. I have included below a visual (from Ref 6) of this process.
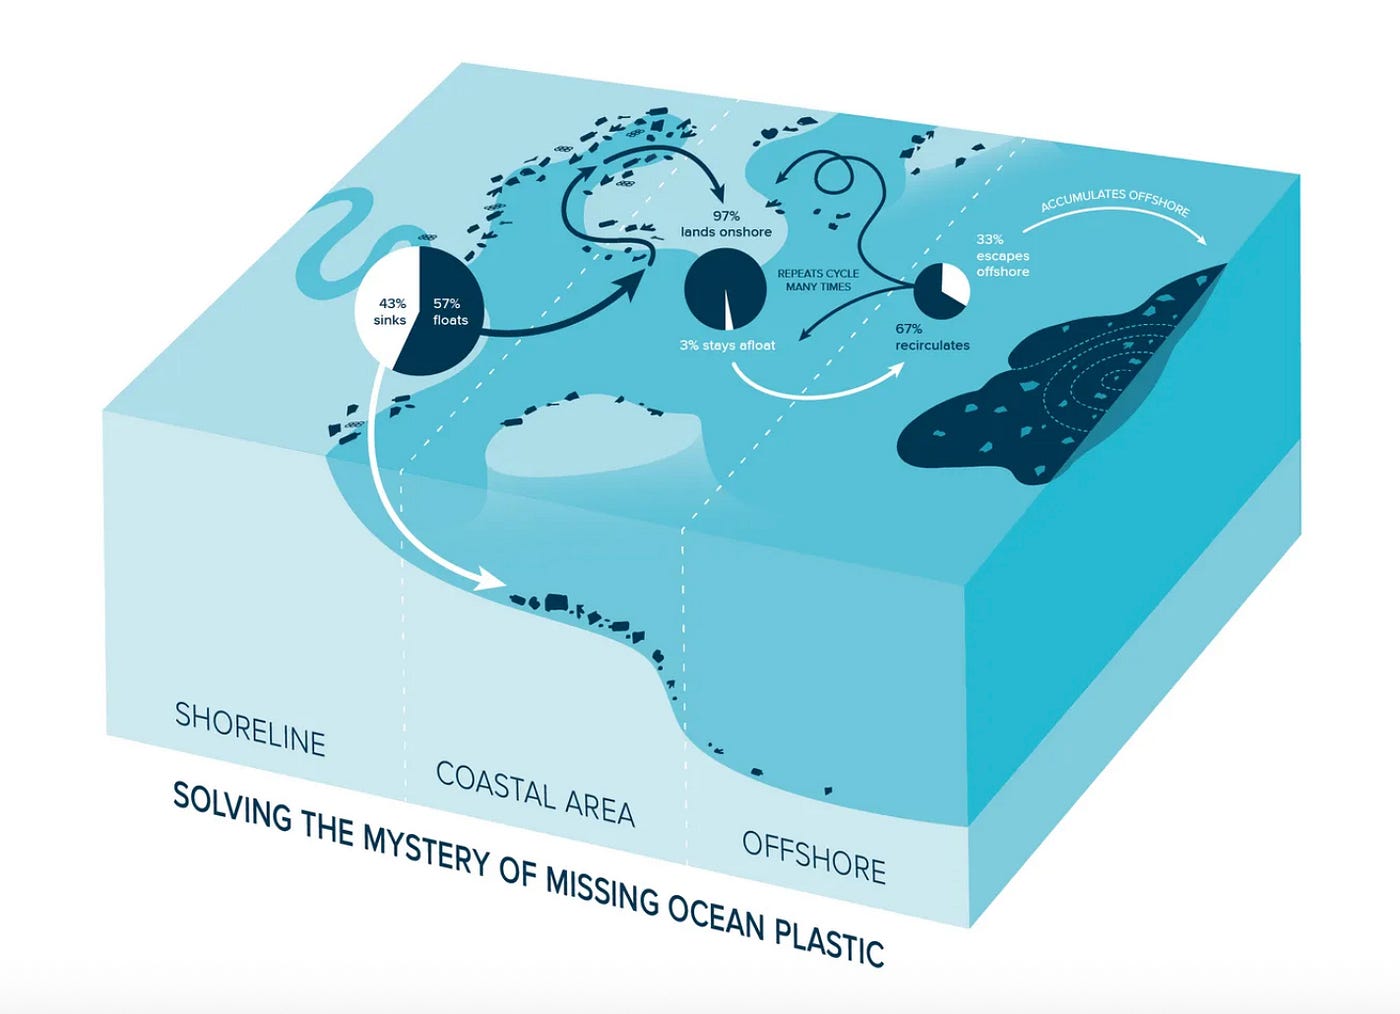
The journey of floating ocean plastic from rivers to garbage patches (from Ref 6)
As the numbers in the above figure are not particularly easy to read, I have reproduced them below:
- Of the plastic reaching the mouths of the rivers and into the oceans, 43% sinks and 57% floats.
- 97% of the floating plastic lands onshore, with 3% staying afloat.
- Of the remaining floating plastic, 67% recirculates and 33% escapes offshore to eventually accumulate in POPs.
If your maths is reasonable you will concluded, from the above, that 55% of the river discharged plastic is deposited on our shorelines (ie 97% of 57%), with 43% sinking to the bottom of our coastal areas and oceans, and just over 0.5% reaching the POPs (ie 57%x3%x33%). This then implies that, of the rubbery estimated 20 million tonnes or so of plastic waste that escapes into our ecosystems every year, only about 100,000 tonnes per year is caught up in our various POPs, with about 11 million tonnes per year scattered across our shorelines and beaches, and just under 9 million tonnes per year sinking.
But that’s not all the plastic that ends up in the POPs.
4. Fishing Gear
Although a substancial proportion of the plastics in our oceans appears to have originated from land-based sources, various studies have verified that a large proportion of plastic waste comes from marine origins, such as ship jetsom and flotsam, fishing nets and fishing gear.
A study conducted in 2019 (as reported in Ref 2) indicated that 80% plastic waste was land-based, while 20% came from ships and boats. A 2018 study (also Ref 2) indicated that, specifically in the Great Pacific Garbage Patch, about 50% by mass comprised fishing nets, attributed to “increased fishing activity in the Pacific Ocean”. Research subsequently conducted in 2022 by The Ocean Cleanup (Ref 6) indicated that about 80% of the plastic waste in the Great Pacific Garbage Patch originated from “fishing activities at sea”.
The latter Ocean Cleanup study further reported buoys, eel traps, nets, and oyster spacers as examples of waste from fishing activities (see below from Ref 6).
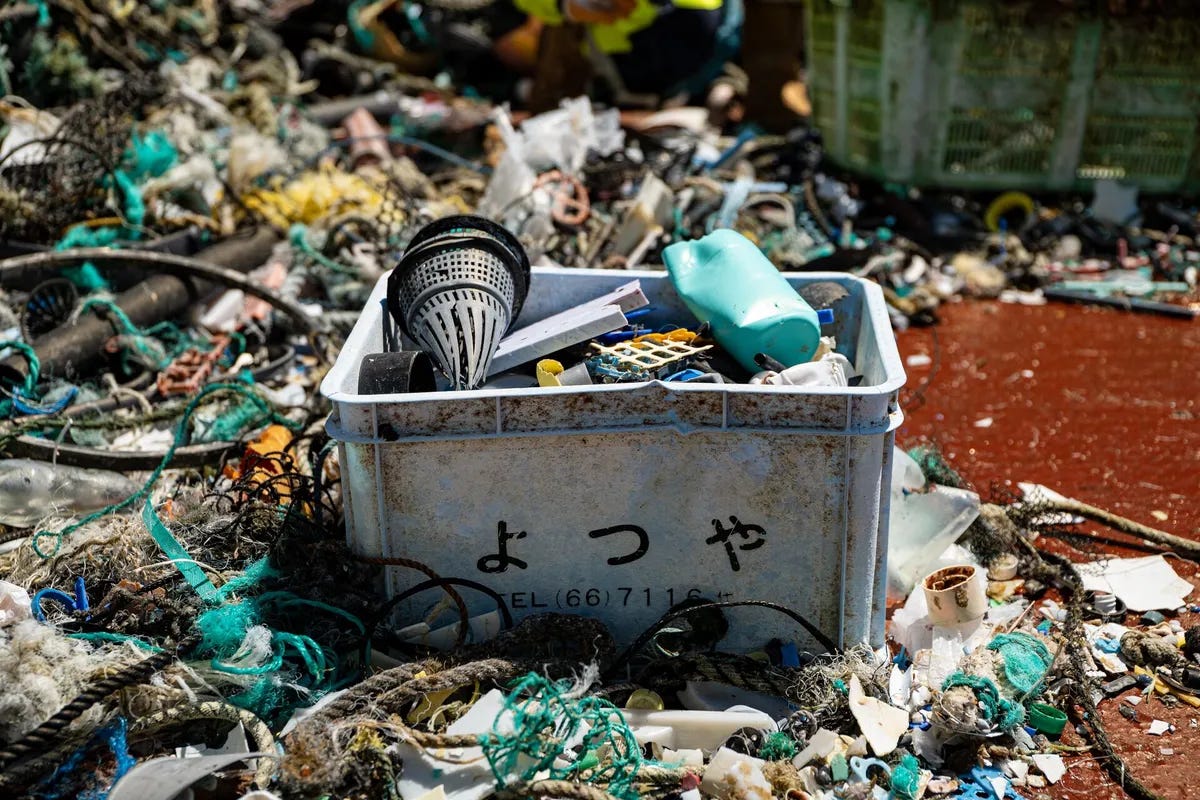
Examples of fishing gear found in the Great Pacific Garbage Patch (from Ref 6)
5. So What Exactly is the Great Pacific Garbage Patch?
Situated in the North Pacific Ocean, between Hawaii and California, the Great Pacific Garbage Patch is the largest and most significant of the five garbage POPs circulating in our oceans. It should therefore come as no surprise that this is also the most polluted, best studied and arguably most infamous of the POPs.
As indicated in Section 1 above, data published by the Ocean Cleanup (Ref 5), using the results of ongoing sampling since the 1970s and relatively sophisticated modelling, indicates that the Great Pacific Garbage Patch covers a surface area of about 1.6 million square kilometres (ie twice the size of Texas or three times the size of France or Thailand). Its plastic contents have been estimated to weigh 100,000 tonnes (ie the equivalent of about 740 Boeing 777s) and to comprise a total of approximately 1.8 trillion floating pieces (ie about 200 to 250 pieces of plastic debris for each human in the world).
These size and weight estimates were carried out by a team of scientists using “a fleet of 30 boats, 652 surface nets and two flights over the patch to gather aerial imagery of the debris”.
With all this plastic floating over such a large area, it would appear sensible to ask if the Great Pacific Garbage Patch is a relatively solid island of waste and hence constitutes a major shipping hazard. Before we answer this questions, however, let’s look at the distribution and size of the plastic items found in the patch.
With reference to the plastic size definitions in Section 2 above, the main proportion (92%) of the patch plastics by mass comprises mesoplastics, macroplastics and megaplastics (ie pieces of plastic larger than 0.5 cm). The main proportion by object count, however, comprises microplastics (ie pieces of plastic smaller than 0.5cm).
Using the above gathered data relating to size and weight, a ‘mass concentration model’ was prepared and used to estimate the distribution of plastics in the Great Pacific Garbage Patch (see below from Ref 5 and 6).
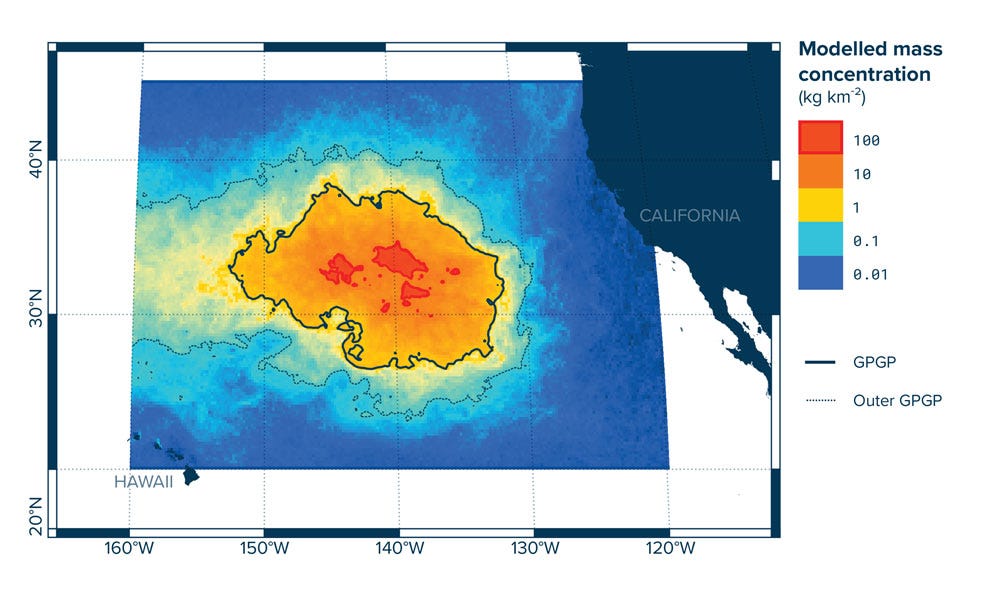
Computational modelling of the high concentration zones in the Great Pacific Garbage Patch (sourced from Ref 5)
The modelling shows that plastic concentrations decrease towards the outer boundaries of the patch, by orders of magnitude, indicating (according to The Ocean Cleanup) that plastic pollution is “scattered and does not form a solid mass”. These concentrations are found to vary from about 100 kg per square kilometre in the central portions of the patch to about 0.1 kg per square kilometre at the outer patch boundary.
The bottom line then, certainly as far as shipping hazards are concerned, is that “the [North Pacific] garbage patch is not a solid island of trash, a common misconception — it’s more often compared to a plastic soup” (Ref 6).
There is now a longstanding history of plastic pollution in the Great Pacific Garbage Patch which is being shown to grow in size and concentration. Furthermore, the larger pieces are likely to continue to deteriorate with time and exposure into microplastics, due to the actions of sun, waves, marine life and temperature changes, becoming more difficult to remove as they become smaller.
While large plastic pieces can entangle marine life (eg turtles caught up in fishing net debris) micro plastics can and are mistaken for food by all sizes of marine life. This will predictably lead to eventual contamination of the human food chain by a process called bioaccumulation, whereby contaminating and health damaging chemicals associated with plastics enter the initial feeding animal or fish and are then passed onto each successively larger prey (refer figure below from Ref 5).
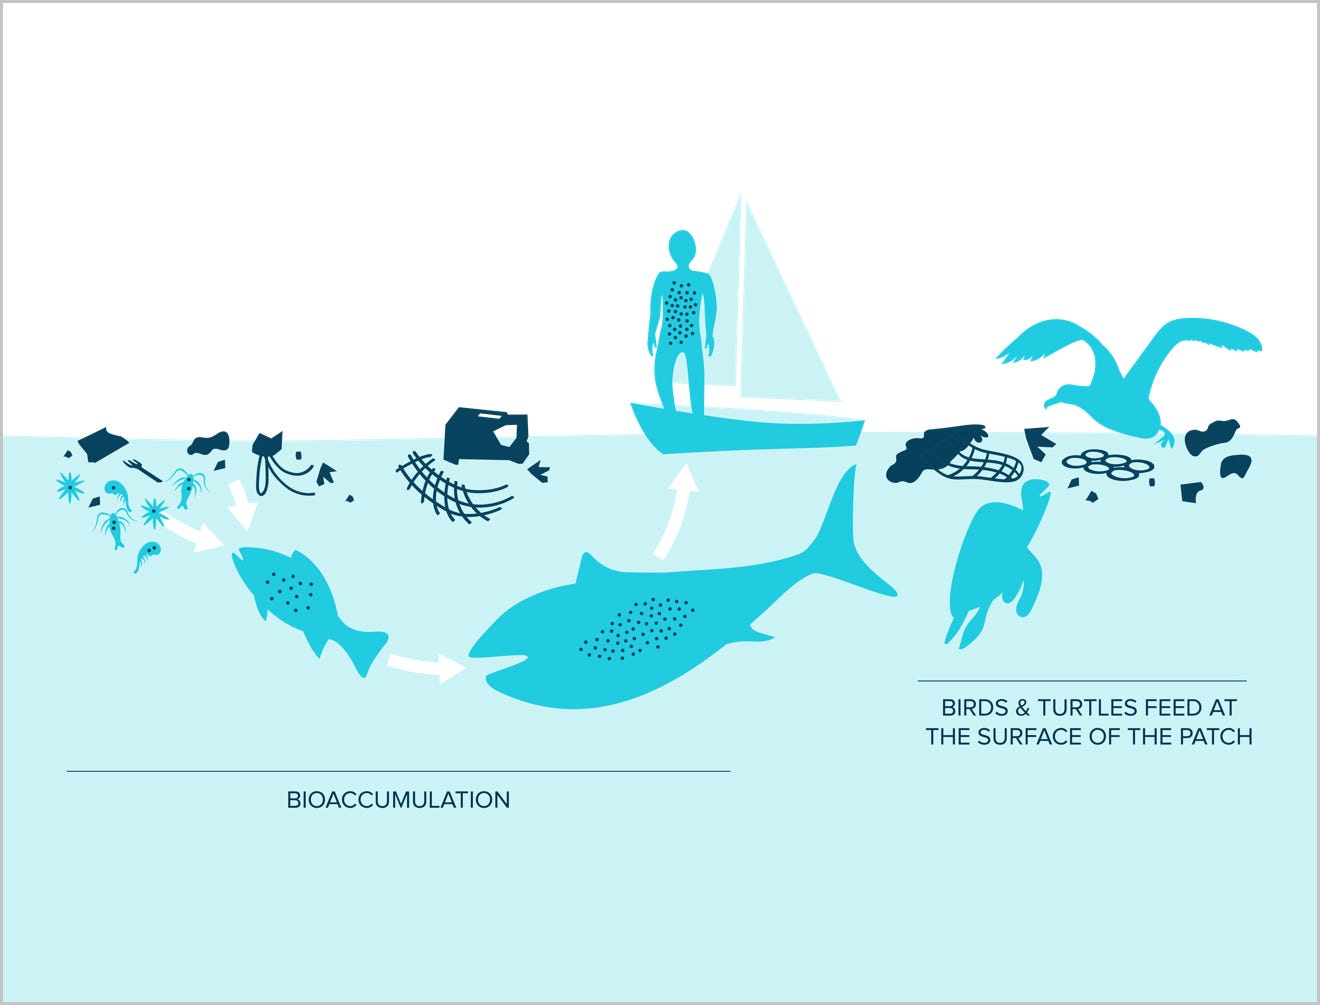
How plastic pollution travels up the food chain (from Ref 5)
6. What Next
The obvious questions now are:
- Who is responsible for the Great Pacific Garbage Patch (ie which countries)? and
- What is being done about it?
These questions will be tackled in Parts 2 and 3 of this blog, but, for now, let me just say that the instigators of ocean garbage are not all poorer countries. As for cleaning up, this is underway to some degree, but, as in all things environmental, the voices opposing pollution need to be much louder than those perpetrating and propogating pollution, if they are to be heard.
“Money talks louder than words.” — Anonymous
“When nature is viewed as a source of profit and gain, this has serious consequences for society.” – Pope Francis
“Why is it that the most intellectual creature to have walked the Earth — humans capable of amazing advances - are also destroying our only home?” – Jane Goodall.
References
- https://www.plasticocean.gallery/po/
- Great Pacific Garbage Patch, Wikipedia, as current in June 2025.
- https://theoceancleanup.com/great-pacific-garbage-patch/
- McMillan-Webster, Fiona, Plastic Measures, Australian Geographic, Issue 186, May — June 2025.
- https://theoceancleanup.com/great-pacific-garbage-patch/#what-types-of-plastic-float-in-the-great-pacific-garbage-patch
- https://theoceancleanup.com/ocean-plastic-pollution-explained/
- UN Environmental Programme, Plastic Pollution, https://www.unep.org/plastic-pollution

Ken Boddie, besides being a sometime poet and occasional writer, is an enthusiastic photographer, rarely leisure-travelling without his Canon, and loves to interact with other like-minded people with diverse interests.
Ken’s typical work week (being a retired engineer), as an occasional freelance English tutor to migrants, inconsistent blogger, and keen gardener, allows him to follow his photography interests, and to plan trips to an ever increasing list of countries and places of scenic beauty and cultural diversity.
메타데이터
- post_id
- 9b6954b842bd
- slug
- lets-talk-garbage-great-pacific-garbage-patch-part-1-9b6954b842bd
- url
- https://medium.com/@kenboddie/lets-talk-garbage-great-pacific-garbage-patch-part-1-9b6954b842bd
- canonical_url
- https://medium.com/@kenboddie/lets-talk-garbage-great-pacific-garbage-patch-part-1-9b6954b842bd
- author_url
- https://medium.com/@kenboddie
- status
- ok
- fetched_at
- 2026-06-25 12:15:08