I Built Knowledge Graphs for 15 Shakespeare Plays.
Part 3 in a series on literary knowledge graph analysis. Previous: Extracting and Comparing KGs Across Literary Genres · When Mythologies…
I Built Knowledge Graphs for 15 Shakespeare Plays. Genre Prediction Failed — But Here’s What the Graphs Actually Revealed.

Part 3 in a series on literary knowledge graph analysis. Previous: Extracting and Comparing KGs Across Literary Genres · When Mythologies Collide: Fusing Knowledge Graphs Across Ancient Epics
I had a clean hypothesis: if you extract knowledge graphs from Shakespeare’s plays — capturing who loves, kills, betrays, and serves whom — the resulting graphs should cluster by genre. Comedies should look like comedies. Tragedies should look like tragedies. The relational architecture of a play should encode its genre.
I spent $5.50 on GPT-4o API calls, extracted 2,089 entities and 5,486 typed relations from 15 plays, ran spectral graph comparison and hierarchical clustering, and got a definitive answer: no, they don’t cluster by genre. The mean silhouette score was −0.23, and the permutation test returned p = 0.76.
But the experiment wasn’t a failure. The data told a more interesting story than I expected — one about why Shakespeare’s genres resist neat categorization, and about what knowledge graphs can reveal when brute-force classification can’t.
The Setup
15 plays, 4 genres. Four comedies (A Midsummer Night’s Dream, Much Ado About Nothing, Twelfth Night, The Merchant of Venice), four tragedies (Hamlet, Macbeth, Othello, King Lear), four histories (Richard III, Henry IV Part 1, Henry V, Julius Caesar), and three romances (The Tempest, The Winter’s Tale, Cymbeline).
One schema for all. Every play was extracted through the same lens: 8 entity types (CHARACTER, FACTION, LOCATION, EVENT, OBJECT, CONCEPT, TITLE, SUPERNATURAL) and 21 relation types spanning emotional (LOVES, FEARS, MOURNS), violent (KILLS, WOUNDS, BETRAYS), political (RULES, SERVES, USURPS, ALLIES_WITH), and deceptive (DECEIVES, DISGUISES_AS, MANIPULATES) interactions. Using a unified schema is essential — genre differences should emerge from content, not extraction bias.
GPT-4o extraction. Using LlamaIndex’s SchemaLLMPathExtractor with strict schema validation, I chunked each play into ~1,200-token passages and extracted up to 20 triplets per chunk. Each play took 2–4 minutes. Total yield: 2,089 entities and 5,486 typed relations across all 15 plays.

Extracted KG size per play. Histories produced the largest graphs (Richard III: 264 entities, 602 relations), while comedies were the most compact.
The extraction itself revealed a pattern worth noting: histories are structurally the most complex plays. Richard III alone produced 866 total graph elements — nearly double the comedies. This makes intuitive sense: histories involve large casts of named political actors with intricate webs of allegiance, betrayal, and succession. Comedies concentrate on smaller ensembles with denser interpersonal dynamics.
The Hypothesis: Spectral Graph Similarity
My primary similarity metric was NetLSD — a spectral descriptor derived from the graph Laplacian’s eigenvalues. It produces a size-invariant “fingerprint” for each graph: two graphs with similar structural properties will have similar NetLSD descriptors, regardless of whether they share any actual nodes. I also computed a Weisfeiler-Lehman kernel as a validation measure, which captures neighbourhood-level structural patterns.
The idea: if comedies share a characteristic graph topology (say, dense ensemble connectivity with many LOVES and DISGUISES_AS edges) and tragedies share a different one (star-shaped, centred on a protagonist’s fatal relationships), the spectral descriptors should separate them.

The experiment pipeline — text to chunking to GPT-4o extraction to spectral comparison to clustering.
The Result: Genre Labels Don’t Predict Graph Topology
Here’s a 2-D projection (MDS) of the 15 plays in spectral similarity space:

MDS projection of NetLSD distances. Point colour = genre, size = graph size. The genres are thoroughly mixed.
Instead of four tidy clusters, the plays scatter with genres thoroughly interleaved. Hamlet (tragedy) neighbours Midsummer (comedy) and Henry V (history). Twelfth Night (comedy) sits alongside King Lear (tragedy) and Julius Caesar (history). The silhouette score — which measures how well each point fits its assigned cluster versus the nearest other cluster — averaged −0.23 across all plays. A score below zero means the average play is closer to another genre’s cluster than to its own.
A permutation test (5,000 shuffles) confirmed: the observed difference between intra-genre and inter-genre distances was not statistically significant (p = 0.76). Genre labels tell you essentially nothing about a play’s graph topology.
Why Topology Fails
This is the interesting part. Graph topology — degree distributions, clustering coefficients, spectral properties — captures the shape of a network but ignores the labels on the edges. NetLSD treats LOVES, KILLS, and RULES as interchangeable. It asks: how many edges does each node have? How clustered are the neighbourhoods? How does information flow through the graph?
From this purely structural perspective, a comedy with four characters in a love quadrangle and a tragedy with four characters in a conspiracy both appear to be K₄. The meaning of the edges — the distinction between romantic entanglement and political betrayal — is invisible to spectral methods.
This is a well-known limitation, but one I’d hoped the schema-guided extraction would partially overcome. A unified schema should produce more similar structures within genres (since comedies would have many LOVE edges and few KILL edges, changing the degree distributions). In practice, the structural variation within genres dominates the variation between them.
What Works Better: Semantic Similarity
If topology ignores edge labels, what happens when we use them?
I computed three alternative similarity metrics that incorporate the semantic content of each knowledge graph — the distribution of entity types and relation types — rather than just the graph’s shape.

Mean silhouette score for genre clustering under different similarity metrics. Only the comedy-vs-tragedy binary split achieves a positive score.
The progression is telling. Pure topology is worst (−0.23). Cosine similarity on entity + relation distributions improves things but stays negative (−0.05). Jensen-Shannon divergence on relation distributions alone reaches essentially zero (+0.004). And simplifying to a binary comedy-vs-tragedy split finally achieves a positive silhouette (+0.17) — though the permutation test remains non-significant (p = 0.14) given only 8 plays.
The pattern suggests that semantic content carries more genre signal than topology, but the signal is weak relative to the noise. With only 15 plays across 4 genres, we lack the statistical power to detect it reliably.
What the Knowledge Graphs Actually Reveal
Even though genre clustering failed, the extracted graphs contain rich information. The most interesting findings come from examining the genre-level relation-type profiles.

Average relation-type proportions per genre. Each axis shows how much of that genre’s relationship fabric is devoted to a particular relation type.
The radar chart reveals four distinct relational fingerprints:
Tragedies are dominated by FEARS. At 17.2% of all relations, FEARS is twice as prevalent in tragedies as in any other genre. Combined with elevated KILLS (2.9%), MOURNS (8.2%), and OPPOSES (15.3%), the fingerprint maps cleanly onto the tragic arc: a protagonist who fears, who is opposed, who kills or is killed, who is mourned.
Histories are defined by political dynamics. ALLIES_WITH (14.7%) and OPPOSES (19.3%) together account for more than a third of all relations — the ceaseless realignment of political factions. RULES (10.0%) is also highest in histories, reflecting the plays’ preoccupation with kingship and governance.
Comedies peak on DISGUISES_AS and DECEIVES. The 5.7% rate of DISGUISES_AS is three times higher than in tragedies or histories — a quantification of the genre’s reliance on mistaken identity and cross-dressing plots. LOVES (5.6%) and PURSUES (4.1%) are also elevated, rounding out the romantic-confusion profile.
Romances blend everything. Their profile has no dominant peak — moderate FEARS, moderate LOVES, moderate RULES — reflecting their nature as genre hybrids. The one distinguishing feature is DISGUISES_AS (6.0%), even higher than comedies, reflecting the elaborate recognition plots in The Winter’s Tale and Cymbeline.

Entity type composition per play. Tragedies are heavy on CONCEPT entities (abstract ideas like “honour”, “madness”, “revenge”). Histories are dominated by CHARACTER and FACTION entities.
The entity-type breakdown adds another layer. Tragedies have the highest proportion of CONCEPT entities (22.7%) — abstract ideas like honour, guilt, madness, and revenge that become characters in their own right. Histories concentrate on CHARACTER (63.8%) and FACTION (9.9%) entities, reflecting their literal power politics. Comedies sit in between, with more EVENT entities (18.1%) — the plays’ dense sequences of misunderstandings, revelations, and reversals.
The Most Similar and Most Different Plays
Even without clean genre clusters, the pairwise similarities tell stories of their own.
The most similar pair is Henry IV Part 1 and Henry V (cosine distance: 0.014). These are sequential plays with overlapping characters, shared political stakes, and structurally similar blends of RULES, SERVES, and ALLIES_WITH relations. The knowledge graphs independently confirm what any reader already knows: these plays are companion pieces.
The most different pair is Macbeth and A Midsummer Night’s Dream (distance: 0.24). One is the genre’s purest tragedy — concentrated around a single character’s descent through FEARS, KILLS, and BETRAYS. The other is its purest comedy — a distributed ensemble connected through LOVES, DISGUISES_AS, and CAUSES. If there’s a pole-to-pole axis of Shakespearean drama, these two mark the endpoints.
The biggest surprise is Merchant of Venice, classified as a comedy but whose nearest neighbour in semantic space is Hamlet (tragedy). Its knowledge graph is heavy on BETRAYS, OPPOSES, and DECEIVES — Shylock’s bond, the trial scene, Portia’s disguise — giving it a relational fingerprint more like Othello than like Twelfth Night. Literary scholars have debated Merchant’s genre classification for centuries. The KG data doesn’t resolve the debate, but it quantifies exactly why the debate exists.
What I’d Do Differently: Schema Lessons from the Data
The negative result prompted me to go back and analyze what the extraction actually produced — and I found six concrete problems with the schema that explain part of why genre signal was so weak.
OPPOSES is a catch-all. It accounts for 886 of 5,486 relations (16%) — the single most common relation, and the most uniformly distributed across genres. It absorbs everything from Hamlet opposing Claudius to Titania opposing Oberon to Henry V opposing France. When one relation carries this much traffic, genre-specific patterns get diluted. A V2 schema should split it into finer relations: CHALLENGES (political/military confrontation — histories), RESENTS (personal grievance — tragedies), RIVALS (romantic/social competition — comedies).
80% of relations are CHARACTER→CHARACTER. The schema captures interpersonal dynamics well but misses structural patterns. Only 20% of relations involve non-CHARACTER entities (CONCEPT, EVENT, LOCATION, etc.). This means we’re comparing 15 social networks rather than 15 story structures. Adding relations like SUFFERS (CHARACTER→EVENT), WITNESSES (CHARACTER→EVENT), and SPEAKS_OF (CHARACTER→CONCEPT) would capture how characters engage with the narrative machinery, not just with each other.
CONCEPT entities are genre gold but underextracted. Only 255 of 2,089 entities (12%) are CONCEPT, yet they show the clearest genre differentiation: tragedy concepts cluster around death, madness, guilt, and fate; comedy concepts around mockery, love, and rebellion; history concepts around sickness, defeat, and ransom. Splitting CONCEPT into EMOTION (internal states), THEME (abstract ideals), and VICE (moral failings) would amplify this signal.
Missing genre-defining relations. The schema lacks MARRIES (nearly all comedies end in marriage; rare in tragedies), CROWNS/DEPOSES (transfer of power defines histories), CURSES/ENCHANTS (magic drives romances), and MOCKS/RIDICULES (wit combat is the engine of comedy). These are precisely the relations that would separate genres.
This analysis points toward a V2 schema with 11 entity types (up from 8) and 28 relation types (up from 21) — designed to capture the genre-specific vocabulary that the current schema flattens into generic categories. That’s the subject of the next article in this series.
Beyond schema improvements, I’d also change three things about the experimental design. First, more plays — 15 across 4 genres gives only 3–4 samples per class, not enough for reliable statistical inference. The full canon of 37 plays would provide real statistical power. Second, richer similarity metrics — Graph2Vec or GNN-based embeddings could capture structure-label interactions that NetLSD misses. Third, different questions — the knowledge graphs might better answer finer questions than genre: which plays have the most centralized character networks? Is there a measurable “Shakespearean arc” in how relationship types evolve across a play?
What This Means
The experiment’s negative result is itself a finding: Shakespeare’s genres are not encoded in graph topology. The shape of a play’s relational network — its degree distribution, clustering coefficients, and spectral properties — doesn’t distinguish comedies from tragedies. The meaning of the edges matters more than the structure of the graph.
But when you look at edge semantics — the proportions of FEARS vs. LOVES, KILLS vs. DISGUISES_AS, RULES vs. PURSUES — genre differences emerge clearly at the aggregate level. They’re just drowned out by within-genre variation when you try to classify individual plays.
This suggests a deeper truth about Shakespeare’s dramaturgy. His genres share a common structural grammar — the same kinds of character networks, the same narrative shapes — but fill that grammar with different relational vocabularies. Tragedies and comedies aren’t differently built. They’re differently populated.
The code is available on GitHub. Total API cost for the experiment: ~$5 for 15 plays.
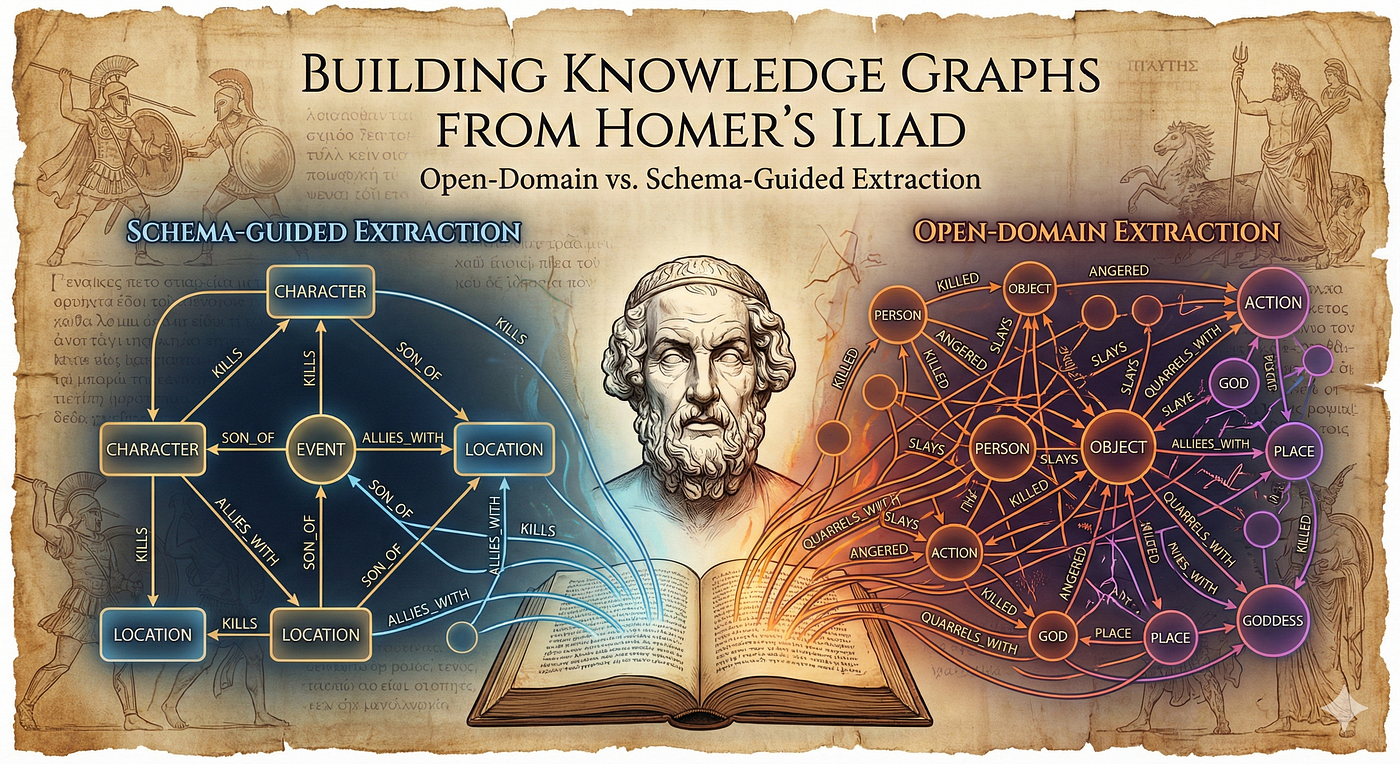
This is Part 3 of the Literary Knowledge Graph Analysis series. Part 1 covered schema-guided vs. open-domain extraction. Part 2 explored structural compare across different generes.
메타데이터
- post_id
- 9b8a21f0efb3
- slug
- i-built-knowledge-graphs-for-15-shakespeare-plays-9b8a21f0efb3
- url
- https://medium.com/graph-quill/i-built-knowledge-graphs-for-15-shakespeare-plays-9b8a21f0efb3
- canonical_url
- https://medium.com/graph-quill/i-built-knowledge-graphs-for-15-shakespeare-plays-9b8a21f0efb3
- author_url
- https://medium.com/@shereshevsky
- status
- ok
- fetched_at
- 2026-06-11 05:11:55