Realized vs. Implied Volatility: What’s the Difference?
Volatility comes in two flavors, and people mix them up constantly. One measures what a stock has already done; the other is what the…
Realized vs. Implied Volatility: What’s the Difference?
Volatility comes in two flavors, and people mix them up constantly. One measures what a stock has already done; the other is what the market expects it to do. They’re calculated differently, they mean different things, and knowing which one you’re looking at changes how you use it — including which volatility your research tools are actually showing you.
Realized volatility: a measure of past price movement
Realized volatility — also called historical volatility — measures how much a stock’s price actually moved over a past window. Mathematically it’s usually the annualized standard deviation of returns over some number of days: a compact number for how choppy the price has been.
The key trait is that it’s backward-looking and factual. It describes movement that already happened. A stock with 60% realized volatility has been swinging around twice as much as one at 30% over the same window. There’s no expectation baked in — just the record of what occurred.
Implied volatility: the market’s expected future movement
Implied volatility is the opposite in spirit. It’s the market’s expectation of how much a stock will move going forward, and it’s derived from options prices — from what traders are collectively paying to position and hedge.
When option prices are high, implied volatility is high: the market is bracing for larger moves. When options are cheap, implied volatility is low. It’s forward-looking and, crucially, an opinion — an estimate of the future, not a record of the past. The most famous example is the VIX, which is simply the implied volatility of the S&P 500 read off its options market. Because implied volatility is calculated from options, it’s fundamentally an options-market concept.
Why they often disagree — and what the gap suggests
Realized and implied volatility rarely match, because one is history and the other is expectation.
When implied sits well above realized, the market is paying up for protection relative to how much the stock has actually been moving. That often shows up ahead of a known event — an earnings report, a regulatory decision — where traders anticipate a jump that hasn’t happened yet. When implied runs below realized, the market may be underpricing risk relative to recent behavior.
That spread between the two is itself useful context (options traders call it the volatility risk premium). But it’s a description of positioning and expectation — not a directional signal. A wide gap tells you the market expects turbulence; it does not tell you which way price will break.
Which one stock-research tools actually use
Here’s the practical part most explanations skip. Implied volatility requires an options market to exist and is primarily an options-trading concept. Realized volatility can be computed directly from price history for any stock, with no options data required.
So when a stock-level research tool shows you “volatility” — for screening, ranking, or regime analysis — it’s almost always realized volatility. It describes the stock’s actual behavior and works across the entire equity universe, not just names with liquid options. The takeaway: before you interpret a volatility number, know whether it’s the past (realized) or an options-derived expectation (implied). They answer different questions.
Common windows (10/20/30-day) and why they matter
Realized volatility is always measured over a window, and the window changes the story — much like the timeframe on a chart.
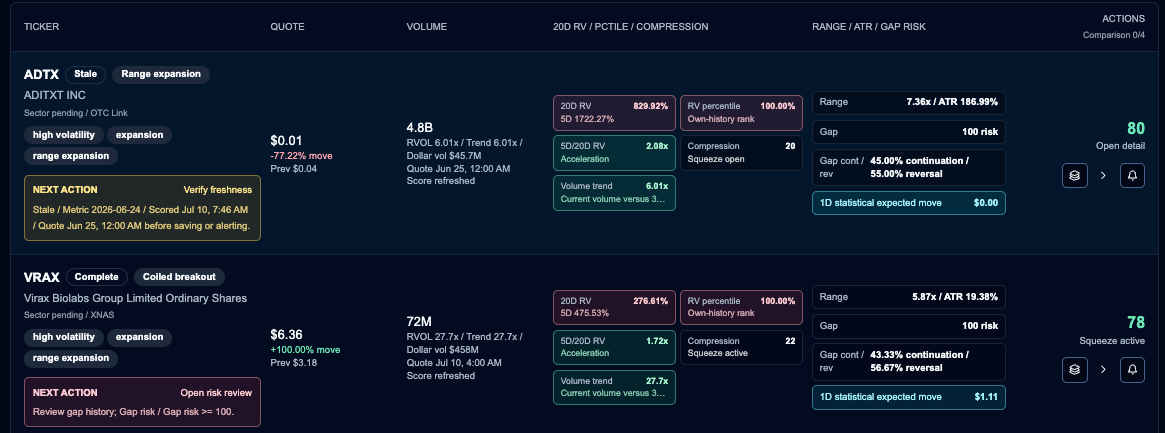
A short window (say 10 days) reacts quickly to recent moves; a longer window (20 or 30 days) is smoother and slower to shift. The real insight comes from comparing them. When short-window volatility rises above the longer window, volatility is accelerating — an expansion. When it drops below, the stock is calming — a compression. That relationship is often more informative than any single number, because it shows the direction of the volatility trend, not just its level.
How Volatility Radar tracks realized volatility across windows
FinMonkeys’ Volatility Radar is built entirely on the realized side. It computes realized volatility across multiple windows, ranks a stock against its own history so you can see whether current volatility is unusual for that name, and flags compression versus expansion alongside ATR and range behavior, gap risk, and liquidity.
It’s deliberately a stock-data volatility tool — not an options or implied-volatility product — which is exactly why it complements a market-level implied gauge like the VIX. One shows you the options market’s expectation; the other shows you what individual stocks are actually doing.
A simple way to keep the two straight:
- Identify which volatility you’re looking at — realized (past) or implied (expected).
- For single-stock research, expect realized; for the market’s options-based expectation, look to implied and the VIX.
- Compare short and long realized windows to see whether volatility is expanding or compressing.
- Read the implied-vs-realized gap as event context, never as direction.
- Combine any volatility read with the rest of your evidence before drawing conclusions.
Both measures are useful. They just answer different questions — and the first step to using either well is knowing which one is in front of you.
Part of our volatility series. Start with the hub: What Is the VIX? The ‘Fear Index’ Explained
This article is for general informational and educational purposes only. It is not investment advice or a recommendation to buy, sell, or hold any security. Markets carry risk, and volatility can change quickly.
메타데이터
- post_id
- 9bbd06bbcba6
- slug
- realized-vs-implied-volatility-whats-the-difference-9bbd06bbcba6
- url
- https://medium.com/@joyous_dregs_ox_737/realized-vs-implied-volatility-whats-the-difference-9bbd06bbcba6
- canonical_url
- https://medium.com/@joyous_dregs_ox_737/realized-vs-implied-volatility-whats-the-difference-9bbd06bbcba6
- author_url
- https://medium.com/@joyous_dregs_ox_737
- status
- ok
- fetched_at
- 2026-07-11 07:02:50



