WTI vs Brent Crude Oil: Key Differences & How to Trade
WTI trades near $81/bbl, Brent near $83.50. What drives the spread -geopolitics, infrastructure, shale - and how to trade both as CFDs.
WTI vs Brent: Key Differences, Spread Drivers, and How to Trade Both
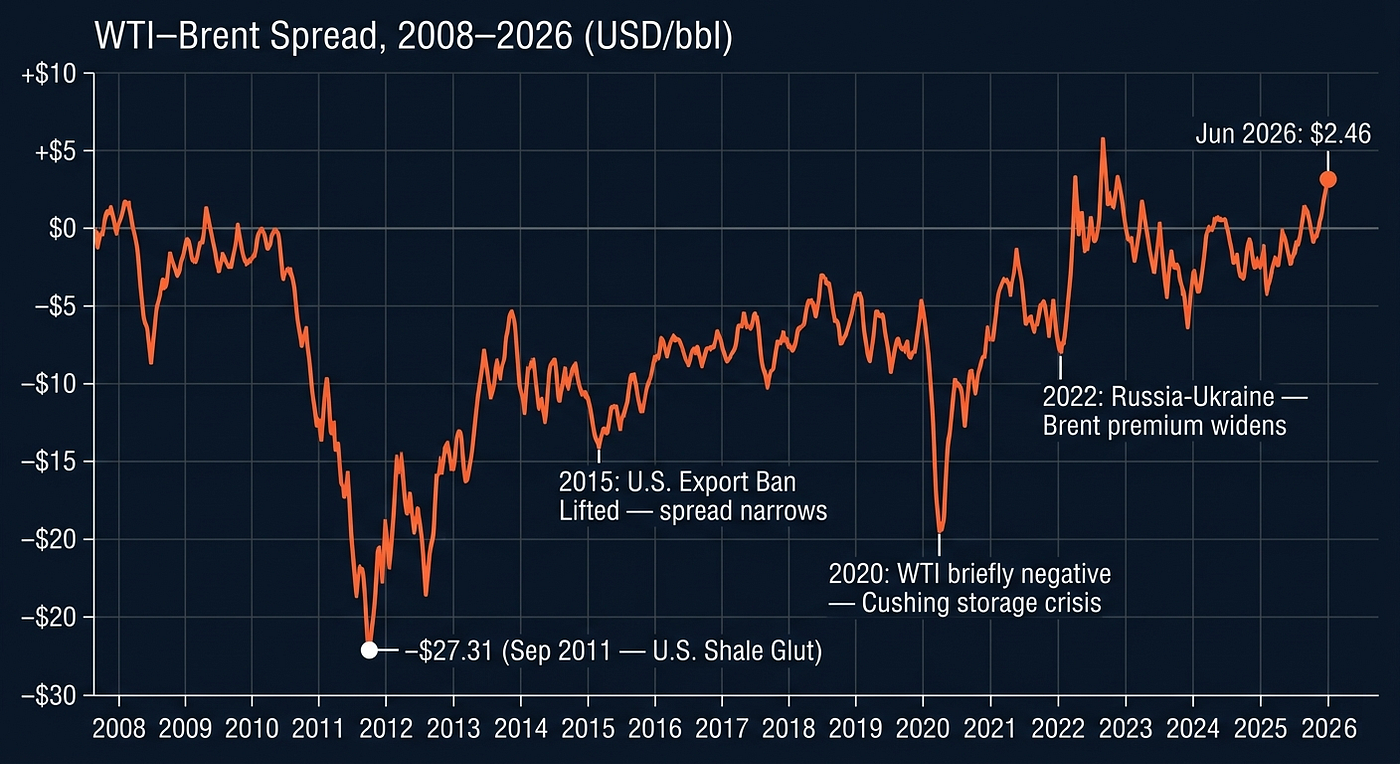
On June 15, 2026, WTI crude oil trades near $81 per barrel while Brent crude sits at approximately $83.50 — a spread of roughly $2.46 in Brent’s favour. That gap, known as the Brent premium, has ranged from near zero to more than $27 over the past 15 years, and understanding what drives it separates traders who react to headlines from those who read the market’s underlying structure.
Both WTI and Brent are the world’s dominant oil price benchmarks, collectively underpinning pricing for an estimated 80% of globally traded crude. Yet for all their surface similarities — both are light sweet crudes refined into largely identical products — they respond to global events in fundamentally different ways. A U.S. shale production surge, a Suez Canal blockage, an OPEC+ production cut: each event moves WTI and Brent by different amounts, in different directions, at different speeds.
This article explains why. It covers the physical and logistical differences between the two benchmarks, the core forces that drive their price spread, and the instruments retail traders can use to access both.
Key Takeaways
- WTI (API gravity 39.6°, sulfur 0.24%) and Brent (38.3°, 0.37%) are both light sweet crudes — their quality difference cannot explain spread swings ranging from near zero to $27.31 per barrel
- WTI benchmarks crude across the Americas (~30% of global traded crude); Brent benchmarks Europe, Africa, and the Middle East (~65%)
- The WTI/Brent spread peaked at a $27.31 discount for WTI in September 2011, driven entirely by U.S. shale production overloading Cushing, Oklahoma’s pipeline infrastructure
- Brent carries a persistent geopolitical premium because its tanker supply passes through the Strait of Hormuz and Suez Canal; WTI’s landlocked pipeline network insulates it from these risk events
- As of June 2026, WTI trades near $81/bbl and Brent near $83.50, with the spread at approximately $2.46
- Retail traders can access both benchmarks via CFDs, avoiding the futures roll costs that erode returns in commodity ETFs in contango markets
Light Sweet vs. Heavy Sour — The Crude Oil Classification System
The American Petroleum Institute (API) classifies crude oil along two axes: density, measured by API gravity, and sulfur content. High API gravity means lighter, less dense oil — and lighter oils yield more gasoline and jet fuel per barrel, making them more valuable to refiners. Low sulfur content defines “sweet” crude, which requires far less processing than high-sulfur “sour” grades that must go through desulfurization before refining.
Both WTI and Brent sit firmly in the light sweet category. WTI has an API gravity of approximately 39.6° and a sulfur content of 0.24%; Brent registers at 38.3° and 0.37% sulfur. By contrast, Venezuela’s Marlim crude (API ~20°, sulfur ~0.68%) and Mexico’s Maya crude (API ~21.8°, sulfur ~3.3%) are classified as heavy sour — their structural refining cost disadvantage relative to light sweet grades is both large and persistent.
Here is the article’s central analytical point: because WTI and Brent share the same quality tier, their refining economics are virtually identical. A spread that has ranged from near zero to $27.31 per barrel cannot be explained by the marginal quality gap between these two grades. Logistics, supply infrastructure, and geopolitical risk are responsible — and understanding these forces is the key to reading the spread.
What Is WTI Crude Oil?
West Texas Intermediate is the primary crude oil benchmark for the Americas, traded as a standardised futures contract on the New York Mercantile Exchange (NYMEX) under the ticker symbol CL, operated by CME Group. It defines the reference price for U.S. domestic crude and serves as the pricing basis for producers across North and Latin America.
Key Physical Characteristics of WTI
WTI is classified as light sweet crude with an API gravity of approximately 39.6° and a sulfur content of around 0.24% by weight — both superior to Brent on the quality spectrum. Its high gravity means a greater proportion of each barrel converts to premium refined products, including gasoline and jet fuel.
These specifications make WTI marginally higher quality than Brent. That margin, however, is small. Neither API gravity nor sulfur content can account for the spread swings that traders observe in practice. When WTI traded at a $27.31 discount to Brent in September 2011, refiners were not suddenly preferring Brent crude — the gap was driven entirely by logistics and infrastructure, as the next section explains.
Where WTI Is Produced, Stored, and Delivered
WTI originates primarily in the Permian Basin of West Texas and New Mexico — the world’s most productive oil basin — as well as from fields in North Dakota and the Louisiana offshore zone. Production flows via pipeline to Cushing, Oklahoma, the NYMEX futures contract’s official delivery point and the largest crude oil storage hub in North America.
Cushing’s nickname, the “Pipeline Crossroads of the World,” reflects its role as the convergence point for roughly 20 major pipeline systems. When inventories at Cushing exceed the hub’s operating capacity, WTI pricing faces direct downward pressure regardless of global supply conditions. The U.S. Energy Information Administration publishes Cushing inventory data in its Weekly Petroleum Status Report every Wednesday — this release consistently moves WTI prices in the hours following publication.
Because WTI is delivered by pipeline to a landlocked inland hub, it is structurally insulated from maritime disruptions that affect Brent. That insulation is itself a tradeable signal when geopolitical tensions escalate at sea.
What Is Brent Crude Oil?
Brent crude is the world’s dominant oil price benchmark, providing the pricing reference for approximately two-thirds of all internationally traded crude oil. It is traded as a futures contract on the Intercontinental Exchange (ICE) in London under the ticker symbol B. Despite its name, “Brent” no longer refers to a single North Sea field — it is now a composite basket of five fields collectively known as BFOET: Brent, Forties, Oseberg, Ekofisk, and Troll. This composite structure was introduced to compensate for declining production in the original Brent field and ensure the benchmark represents sufficient physical liquidity.
Key Physical Characteristics of Brent
Brent crude registers an API gravity of approximately 38.3° and a sulfur content of around 0.37% by weight. Compared to WTI’s 39.6° API and 0.24% sulfur, Brent is marginally heavier and slightly more sulfurous — yet it remains unambiguously classified as light sweet crude, refined into the same premium products as WTI.
The data makes the analytical point explicit: a quality differential this small — 1.3° API gravity, 0.13% sulfur — cannot account for Brent trading at a $1–$27 premium to WTI at various points over the past 15 years. The premium is a geopolitical and logistics story, not a refinery story.
Where Brent Is Produced, Stored, and Delivered
Brent crude originates from offshore fields across the North Sea, spanning UK, Norwegian, and Danish waters. Unlike WTI, Brent is not transported by pipeline to a single landlocked hub — it is loaded directly onto tankers for delivery to refiners across Europe, Asia, and the Americas.
This seaborne delivery mechanism is the single most important structural difference between the two benchmarks for traders. Crude that travels by oil tanker must pass through critical maritime chokepoints — notably the Strait of Hormuz and the Suez Canal. Disruptions at these passages affect Brent directly and immediately; WTI’s pipeline network is not exposed to the same risk vectors.
The breadth of Brent’s global reach amplifies this sensitivity. OPEC+ producers including Saudi Arabia and Russia reference Brent in official selling prices, meaning that any geopolitical event touching major production regions transmits to Brent first — and to WTI only indirectly.
WTI vs Brent — Key Differences at a Glance
The two benchmarks appear similar on paper — both light sweet, both trading within a few dollars of each other in normal market conditions. But their structural differences mean they respond differently to identical global events. A trader who holds the following distinctions clearly can anticipate which benchmark a given news event will affect, and by how much.
WTI (West Texas Intermediate):
- Origin: Permian Basin and North Dakota, USA
- API gravity: ~39.6° — marginally lighter than Brent
- Sulfur content: ~0.24% — marginally sweeter than Brent
- Primary exchange: NYMEX (CME Group), ticker CL
- Delivery: Pipeline to Cushing, Oklahoma (landlocked hub)
- Benchmark region: Americas — approximately 30% of globally traded crude
- Primary price drivers: EIA weekly inventory, U.S. shale production, Cushing storage capacity
- Current price (June 2026): ~$81/bbl
Brent Crude:
- Origin: North Sea BFOET fields (Brent, Forties, Oseberg, Ekofisk, Troll)
- API gravity: ~38.3°
- Sulfur content: ~0.37%
- Primary exchange: ICE London, ticker B
- Delivery: Seaborne oil tanker — global reach, passes through Strait of Hormuz and Suez Canal
- Benchmark region: Europe, Africa, Middle East — approximately 65% of internationally traded crude
- Primary price drivers: OPEC+ production decisions, geopolitical events, global tanker risk
- Current price (June 2026): ~$83.50/bbl

What Drives the WTI/Brent Price Spread?
The WTI/Brent spread — expressed as Brent minus WTI — is not market noise. It encodes specific information about supply logistics, geopolitical risk, and domestic production dynamics. A trader who reads the spread as a structured signal, rather than a residual, gains an analytical advantage: they can distinguish a global supply shock from a purely domestic event, and position accordingly in the benchmark that is actually affected.
Geopolitical Factors That Move the Spread
Brent’s seaborne supply chain runs through two of the world’s most strategically sensitive maritime passages. The Strait of Hormuz handled approximately 21 million barrels of oil per day in 2024, according to EIA data — roughly 20% of global liquid fuels consumption. Any credible threat to this corridor transmits directly and immediately to Brent’s price.
When Iranian tanker seizures escalated in 2019, Brent surged while WTI’s reaction was more muted. When Russia’s invasion of Ukraine triggered a wave of sanctions on Russian crude in early 2022, Brent’s geopolitical premium expanded sharply. As of June 2026, growing expectations of a U.S.–Iran agreement to reopen the Strait of Hormuz contributed to a 3.2% oil price decline on June 14 — with Brent absorbing the geopolitical risk compression first, and the WTI/Brent spread holding near $2.46.
WTI’s insulation from maritime events is structural and persistent. Pipeline-delivered crude does not pass through chokepoints. When the spread widens during a geopolitical flare-up, it is precisely identifying which benchmark is absorbing the risk premium — and that information is actionable.
U.S. Supply Dynamics and Cushing Infrastructure
WTI is uniquely exposed to domestic U.S. supply events that have no direct transmission to Brent. The EIA Weekly Petroleum Status Report, published every Wednesday at 10:30 AM ET, is the primary market-moving data release for WTI traders. A surprise inventory build at Cushing — even one reflecting nothing more than pipeline scheduling — can push WTI lower without touching Brent, widening the spread in Brent’s favour.
Shale production from the Permian Basin is the dominant domestic supply variable. The Baker Hughes weekly rig count, published every Friday, measures active drilling rigs and signals future production volumes. Since the U.S. lifted its crude oil export ban in 2015, excess Permian production now reaches global markets more efficiently — a structural factor that has kept the WTI/Brent spread narrower than it was during the peak shale glut of 2011–2013.
Key data releases that routinely influence the spread:
- EIA Weekly Petroleum Status Report — Wednesdays, 10:30 AM ET
- Baker Hughes weekly rig count — Fridays, 1:00 PM ET
- U.S. monthly crude export volume (EIA, monthly release)
- OPEC+ biannual production decisions
The 2011 Structural Shift — How to Read Persistent Spread Divergence
Before 2011, WTI had traded at a premium to Brent for most of the preceding two decades — a reflection of its marginally superior refining quality and domestic market efficiency. In 2010, the spread sat near $2 in WTI’s favour. By September 2011, WTI traded at a $27.31 discount. The reversal was fast; the average spread of -$10.82 across the full January 2011 — December 2015 period shows how long structural dislocations persist once established.
The mechanism was straightforward: the U.S. shale revolution generated more crude in the Permian Basin and North Dakota than the existing pipeline network could absorb. Cushing’s storage filled toward capacity. Landlocked surplus could not reach Gulf Coast refiners or export terminals efficiently. WTI’s price fell — not because the oil was lower quality, but because it physically could not get out. Brent, priced seaborne with global delivery, faced no equivalent constraint.
This episode established a practical analytical framework: distinguish between common risk factors, which affect all benchmarks simultaneously (a global recession, a broad OPEC+ cut), and idiosyncratic risk factors, which affect only one (a Cushing pipeline bottleneck affects only WTI; a North Sea field outage affects only Brent). The defining example of idiosyncratic risk was April 2020, when WTI front-month futures briefly went negative. Brent never came close. Traders holding this framework knew immediately that the negative print was a storage and delivery mechanism failure, not a signal about global energy demand.
How to Trade WTI and Brent Crude Oil
Both WTI and Brent are accessible through multiple instruments. NYMEX WTI futures (ticker: CL) and ICE Brent futures (ticker: B) each represent 1,000 barrels per contract — a notional value near $81,000 for WTI at current prices. These are the instruments professional traders use. Their margin requirements and monthly roll complexity, however, make them demanding for retail participation.
Oil commodity ETFs such as the United States Oil Fund (USO) provide equity-account access but carry a structural return drag in contango markets: each monthly futures roll sells the expiring near-term contract and buys the next month at a higher price, silently eroding returns even when the spot price is unchanged. Over a sustained contango period, this cost can subtract several percentage points annually from the ETF’s return versus the physical spot price.
CFDs offer retail traders direct price exposure to WTI and Brent without futures roll complexity. Platforms such as Libertex provide WTI and Brent CFDs with leverage subject to ESMA limits for retail accounts (10:1 for commodity CFDs under ESMA product intervention rules), enabling both long and short exposure with defined risk parameters.

Spread Trading and the Arbitrage Logic
Professional traders approach the WTI/Brent spread as a relative value trade: when the Brent premium expands materially beyond its historical $2–5 range, they go long WTI and short Brent, positioning for convergence. When the spread compresses below historical norms, the reverse position captures a reversion to the structural mean.
In practice, executing this trade carries real frictions. Each leg incurs its own transaction cost and margin requirement. Futures roll timing introduces basis risk. And the spread can widen further before converging — as 2011 traders who entered too early discovered when the $10 spread they were fading extended to $27.
For retail traders, the more durable use of the spread is diagnostic: monitor it as a signal rather than trading it directly. A rapidly widening Brent premium signals either a geopolitical shock to seaborne supply or a domestic U.S. oversupply event — and that signal carries information about what will happen next to both benchmarks. A spread compressing toward zero, by contrast, typically signals improving global supply access or a release of a domestic U.S. bottleneck.
Frequently Asked Questions
Why is Brent crude usually more expensive than WTI?
Brent’s persistent premium reflects two structural factors: its seaborne delivery mechanism exposes it to geopolitical disruption risk, which markets price in as a premium; and its status as the benchmark for two-thirds of globally traded crude means that supply shocks in major producing regions transmit to Brent first and fastest. WTI’s landlocked pipeline delivery insulates it from maritime risk but makes it sensitive to domestic U.S. supply conditions, particularly Cushing storage levels.
Is WTI or Brent a better instrument to trade?
Neither is inherently superior. WTI responds more sharply to U.S. domestic data — EIA weekly inventory reports, Permian Basin production volumes, Cushing storage levels. Brent is more sensitive to OPEC+ production decisions, Middle East geopolitical events, and global demand signals. Traders primarily tracking U.S. macro data may find WTI more predictable; those focused on global supply dynamics typically use Brent as their primary reference. Both are among the world’s most liquid commodity futures markets.
What is a normal WTI/Brent spread?
The spread’s historical normal range is approximately $1–5, with Brent trading at a premium to WTI. In calm supply conditions, the spread typically sits near $2–3, reflecting Brent’s structural geopolitical risk premium and logistics factors. The spread widens sharply during geopolitical stress events (reaching $27.31 in September 2011 during the U.S. shale glut) and compresses toward zero during periods of strong global demand and efficient WTI export capacity.
Can retail traders trade the WTI/Brent spread directly?
Retail traders can hold simultaneous long and short positions in WTI and Brent CFDs to replicate the spread trade, though each leg carries its own transaction cost and margin requirement. The combined friction means that only spread dislocations clearly beyond the $5–7 range typically offer a favourable risk/reward ratio for retail participation. Most retail traders use the spread primarily as an analytical diagnostic — monitoring its direction and magnitude to inform directional positions in either benchmark.
What happens to the WTI/Brent spread during a global recession?
During broad economic downturns, both benchmarks typically fall together as common demand destruction compresses prices across all crude grades. The spread itself often narrows during global recessions because the geopolitical risk premium embedded in Brent weakens when demand destruction dominates sentiment. The April 2020 episode was the exception: the spread temporarily inverted due to WTI-specific storage constraints at Cushing — an idiosyncratic event caused by a physical infrastructure failure, not by the common demand shock.
Useful References
U.S. Energy Information Administration — Petroleum & Other Liquids
EIA Weekly Petroleum Status Report (Wednesday releases)
CME Group — NYMEX WTI Light Sweet Crude Oil Futures
ICE — Brent Crude Oil Futures Contract Specifications
Baker Hughes Weekly North America Rig Count
ESMA — Product Intervention on CFDs (Retail Investor Protection)
Reuters — Energy & Commodities News
Risk Warning
CFDs are complex instruments and come with a high risk of losing money rapidly due to leverage. Between 70% and 80% of retail investor accounts lose money when trading CFDs, per ESMA’s ongoing product intervention monitoring. You should consider whether you understand how CFDs work and whether you can afford to take the high risk of losing your money. Past performance is not indicative of future results. This article is for informational purposes only and does not constitute investment advice.
메타데이터
- post_id
- 9bcd22f09dfa
- slug
- wti-vs-brent-crude-oil-key-differences-how-to-trade-9bcd22f09dfa
- url
- https://medium.com/@trading.expert.reviews/wti-vs-brent-crude-oil-key-differences-how-to-trade-9bcd22f09dfa
- canonical_url
- https://medium.com/@trading.expert.reviews/wti-vs-brent-crude-oil-key-differences-how-to-trade-9bcd22f09dfa
- author_url
- https://medium.com/@trading.expert.reviews
- status
- ok
- fetched_at
- 2026-06-27 23:56:40