Statistical Evaluation Metrics for Generative AI: Assessing Synthetic Tabular Data, Text…
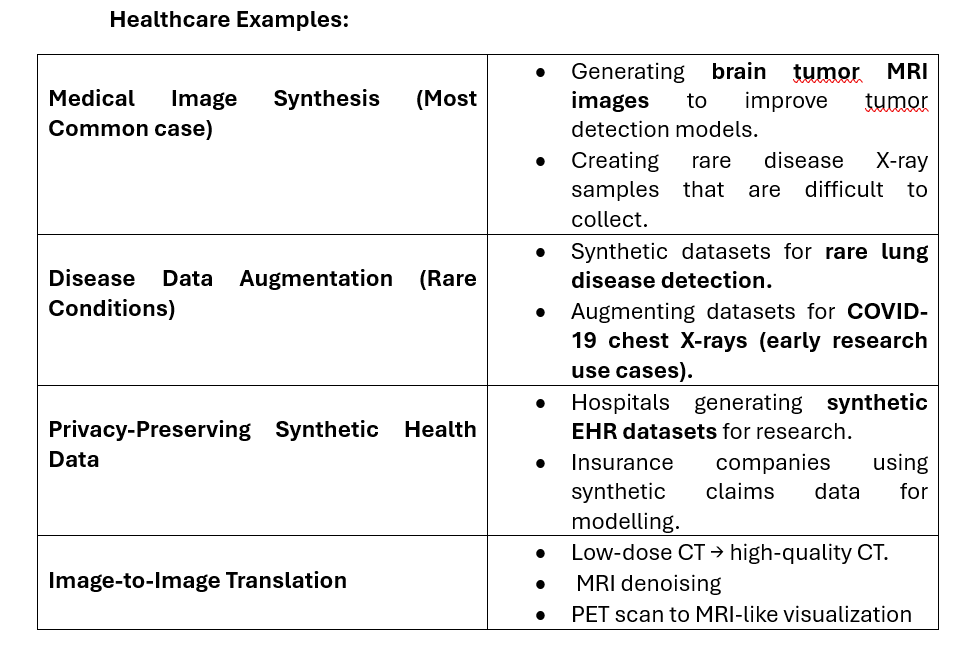
Generative AI models play a substantial role in generating content such as text, image, and synthetic tabular data. The quality of the…
Statistical Evaluation Metrics for Generative AI: Assessing Synthetic Tabular Data, Text Generation:
Generative AI models play a substantial role in generating content such as text, image, and synthetic tabular data. The quality of the generated content was evaluated using several metrics.
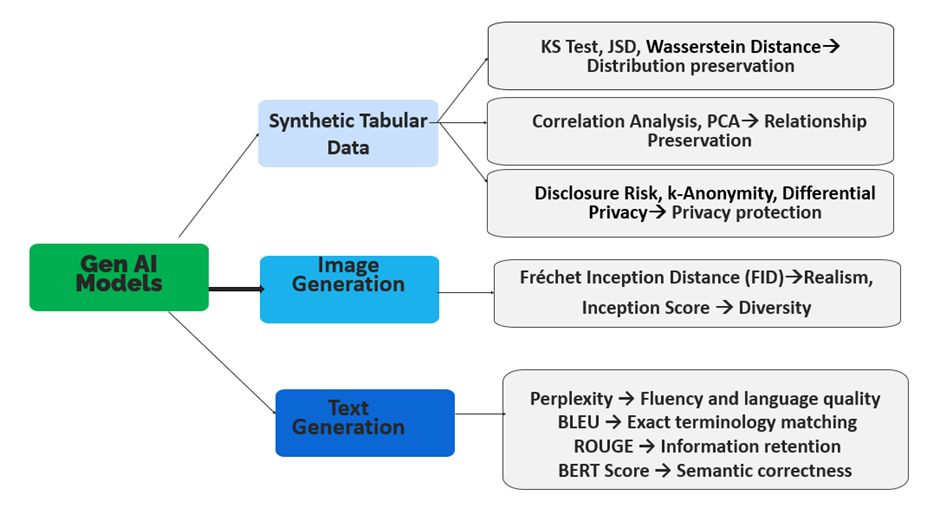
Evaluation metrics of Gen AI model
a) Synthetic Tabular Data: Synthetic tabular data was generated using two popular Gen AI architectures namely the Conditional Generative Adversarial Network (CTGAN) and Tabular Variation Autoencoder (TVAE). These models generate mixed data types such as continuous and discrete data. To ensure the quality of the generated synthetic data, several metrics were used for evaluation. They are as follows:
1) Kolmogorov-Smirnov (KS) Test: The KS test is one of the most popular metrics used to find the maximum discrepancy between feature distributions. It is used in healthcare data to prove that the synthetic feature distribution closely matches with the original patient data distribution.
To conduct the KS test, the KS statistic and the P-value was calculated. P-value represents the KS statistic was calculated as follows:
The KS statistic is the maximum absolute difference between the cumulative distribution functions (CDFs) of the original and synthetic datasets.
KS = Supx | F1(x) — F2(x) |
Here, Supx à supremum over all values of
F1(x) is the cumulative distribution of the original dataset.
F2(x) is the cumulative distribution of the Synthetic dataset.
| F1(x) — F2(x) | is the absolute differences.
The KS-statistics and P- value determine whether the distributed synthetic dataset matches with the original dataset.
2)Jensen-Shannon Divergence: Jensen-Shannon Divergence (JSD Value) is used to evaluate the overall similarity of the distribution. It evaluates the quality of the synthetic data generated by models such as CTCGAN, GAN, and VAE.
To evaluate the synthetic quality
Distribution P → Original Data
Distribution Q → Synthetic Data
JSD is calculated as follows:
Initially, the average distribution is calculated as follows:

Then JSD is defined as:
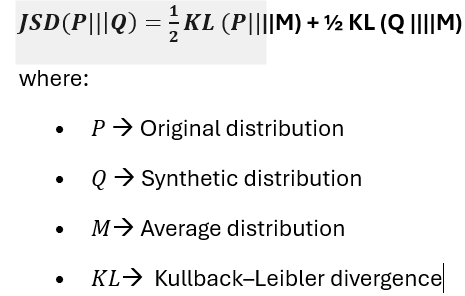
Here, the lower JSD value indicates that the generated data is extremely similar to the original data.
3) Wasserstein Distance: Also known as the Earth Mover’s Distance (EMD) is used to evaluate the synthetic data generated by CTGAN, WGAN, and other generative models, as it provides meaningful distribution similarity.
To evaluate the synthetic quality using WD,
Distribution P →Original Data
Distribution Q → Synthetic Data
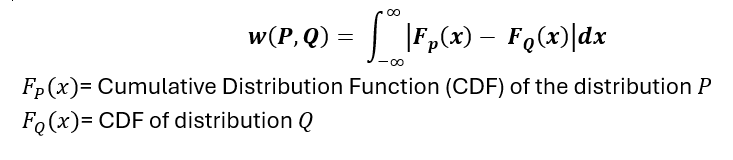
Here, WD is 0. Then it is interpreted as an Identical distribution.
WD is a smaller value then original, and the synthetic data is similar.
WD is a larger value then there is a significant difference.
Lowering the WD value signifies that CTGAN/WGAN generated feature distribution closely matches the original data distribution.
3) Correlation Preservation: Correlation preservation is yet another evaluation technique used to measure how well a synthetic dataset maintains the relationship between features that exist in the original dataset.
If the synthetic data reproduces the individual distributions of the features, it may still be unrealistic if the relationship between the features is lost.
Correlation preservation is evaluated using three metrics. They are
a) Pearson Correlation Coefficient
b) Correlation Difference Metric or Mean Absolute Difference
c) Visualization using heatmaps
If the mean absolute difference (MAD) value is 0, then there is a perfect preservation, if value is less than 0.05 then there is a perfect preservation; If the value lies between 0.05, and 0.10, then the preservation is good. If the value is greater than 0.10, then there is significant loss of relationships.
5) Privacy Risk Metrics: Privacy risk metrics used to determine whether the synthetic records reveal information about real individuals in the original dataset.
a) Distance to Closet Record (DCR): Measure the Euclidean/Manhattan distance between each synthetic record and its nearest real record.

Here, s → synthetic record
R → real record
If the DCR value is small, there is possible memorization of real records; if the value is moderate, then the privacy of the records is preserved; and if the value is large, then there is strong privacy preservation.
b) Nearest Neighbor Distance Ratio (NNDR): It compares the distance to the nearest real record with the distance to the second nearest real record.
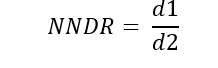
d1 → distance to nearest neighbor.
d2 → distance to the second nearest neighbor.
If NNDR is close to 0, then there is potential for memorization of synthetic records from the real records.
If NNDR is close to 1, then the privacy of the real record is preserved.
c) Identical Record Rate (IRR): Evaluates how many synthetic records exactly match the real record.

If the IRR value is 0%, then the privacy of the real record is preserved. If the IRR value is low, then the privacy is acceptably preserved, and if the IRR value is high, then there is a high possibility of privacy leakage.
d) Disclosure risk: measures the likelihood that a synthetic data record can be linked back to a real individual in the original dataset. It is one of the most important privacy-preservation metrics used when evaluating synthetic healthcare data.
If a synthetic record is very similar to an actual patient’s record, an attacker may identify or infer sensitive information about that patient.
These records are categorised as follows:
a) Identity Disclosure risk
b) Attribute disclosure risk
c) Membership disclosure risk.
e) k-Anonymity is a privacy-preserving technique that ensures each record is indistinguishable from at least k − 1 other records based on a set of identifying attributes called quasi-identifiers.
· Previously, with the attributes age, zip code, and gender, an attacker may identify the sensitive information of a patient. By applying K- Anonymity, the patient Id was removed, and it’s difficult for the attacker to trace the sensitive information.
· The higher the K-values preserves the privacy of each record.
f) Differential Privacy is a mathematical privacy framework that protects individual records in a dataset by ensuring that the output of an analysis or machine learning model changes only minimally when any single person’s data is added or removed.
Unlike K- Anonymity modifies the data before release, where Differential Privacy adds random noise carefully to queries or the model training process.
b) Image Generation:
Most widely used statistical metrics for evaluating the generated images using GAN, Diffusion model, and VAE are Fréchet Inception Distance (FID) and Inception Score (IS).
1) Fréchet Inception Distance (FID): The feature distributions are compared across the real image and generated images.
In FID, deep features were extracted from the penultimate layer of the Inception V3 network, and they are named as multivariate Gaussian distributions.
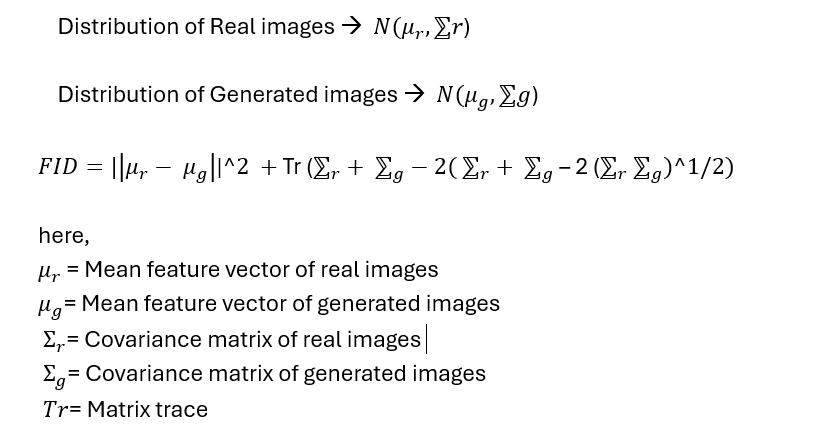
From the equation above the FID score was calculated, and if the FID score is lower than the generated images look like the real images.
- Inception Score (IS): Inception score evaluates the quality of generated images using a pretrained Inception V3 classifier.
The IS is calculated as follows:
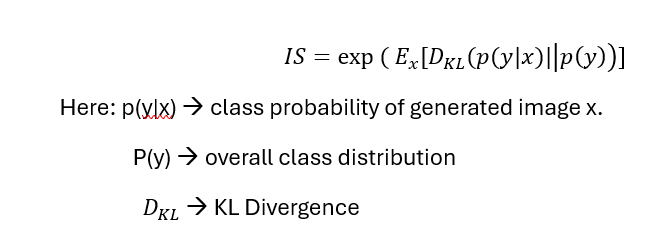
If the generated IS score is higher than the baseline, then the generated images are more realistic and diverse.
c) Text Generation: Gen AI models that generate text using LLM, GPT, BERT based generators, and medical report generators use the following evaluation metrics:
- Perplexity (PPL): Perplexity measures how well a language model predicts the next word in a sequence.
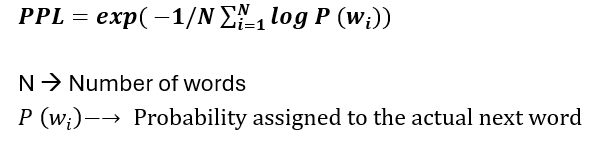
If the perplexity lower indicates that the model is providing the relevant outcome.
2 . BLEU Score (Bilingual Evaluation Understudy): Measures how many words or phrases match a reference text.
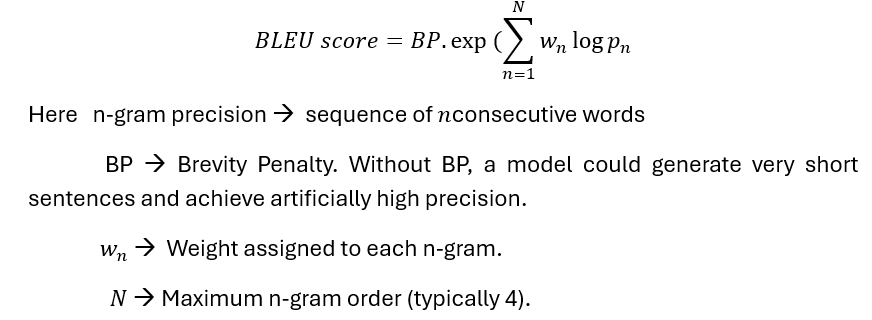
If the BLEU score is higher, then the text generated exactly resembles the actual text.
- ROUGE Score (Recall-Oriented Understudy for Gisting Evaluation): measures how much of the reference text is captured by the generated text.

If the ROGUE value is higher, then the text generated is realistic.
- BERT Score: Measures semantic similarity using contextual embeddings from transformer models. Instead of matching exact words, it compares the meanings of words and sentences.

Here, A -> is considered as reference sentence embeddings.
B → is considered as generated sentence embeddings.
The higher the BERT Score then the generated text delivers the same context as the original text.
메타데이터
- post_id
- 9bcfa7bbf8d9
- slug
- statistical-evaluation-metrics-for-generative-ai-assessing-synthetic-tabular-data-text-9bcfa7bbf8d9
- url
- https://medium.com/@sakthi6visa/statistical-evaluation-metrics-for-generative-ai-assessing-synthetic-tabular-data-text-9bcfa7bbf8d9
- canonical_url
- https://medium.com/@sakthi6visa/statistical-evaluation-metrics-for-generative-ai-assessing-synthetic-tabular-data-text-9bcfa7bbf8d9
- author_url
- https://medium.com/@sakthi6visa
- status
- ok
- fetched_at
- 2026-06-09 15:37:30