The Central Limit Theorem Explained Without a Single Equation (For People Who Failed Stats Once)
You don’t need the formula to actually understand the most important idea in statistics. You need one good analogy and five minutes.
The Central Limit Theorem Explained Without a Single Equation (For People Who Failed Stats Once)
You don’t need the formula to actually understand the most important idea in statistics. You need one good analogy and five minutes.
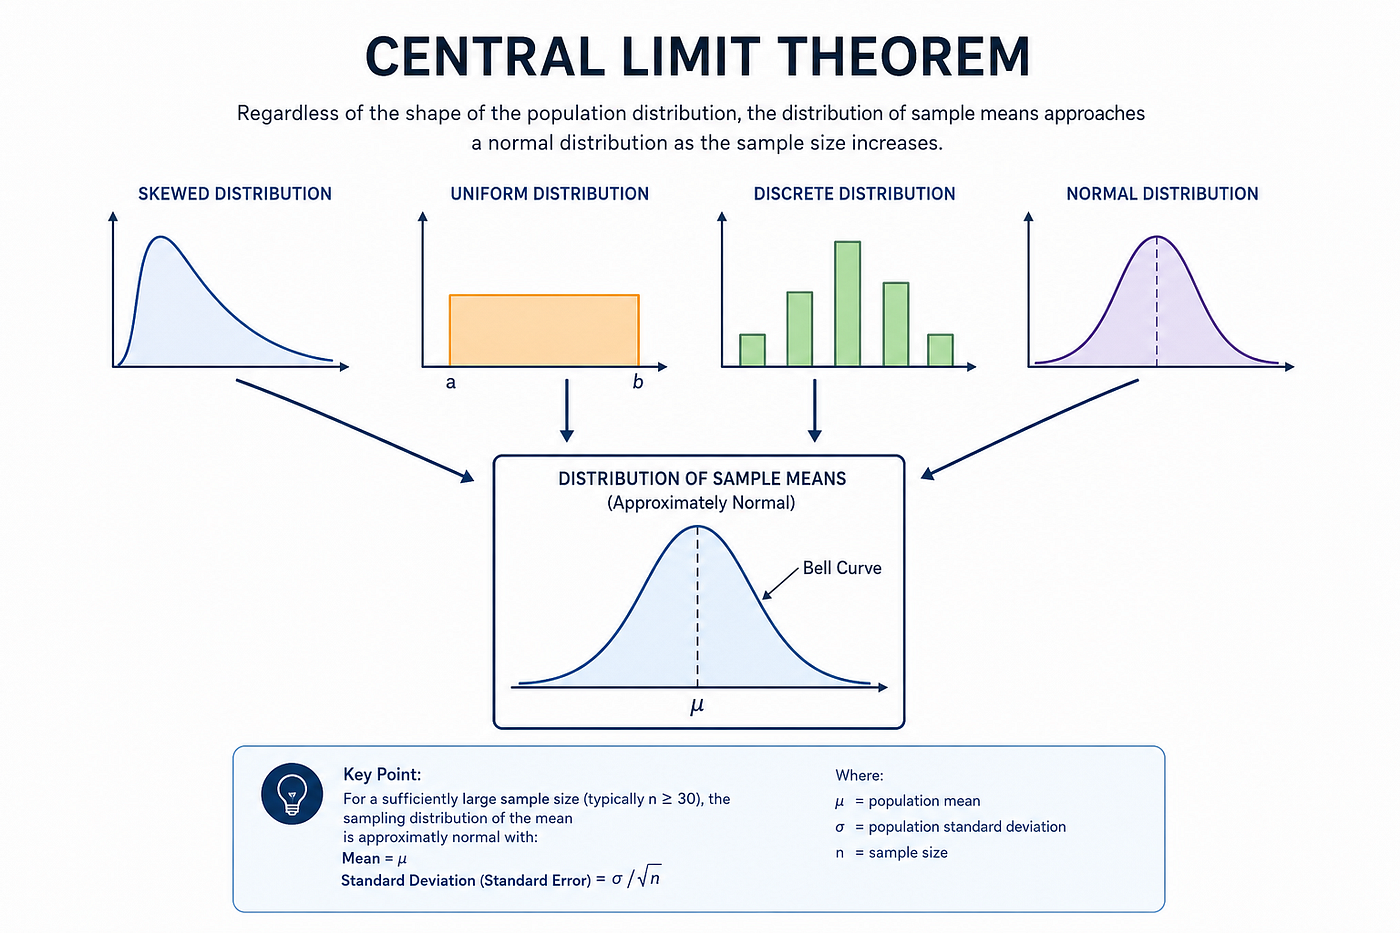
Image Created by Autor
Picture a food delivery app. Some drivers are fast, some are painfully slow, and delivery times swing wildly five minutes one order, forty-five the next. If you looked at a single delivery time, you’d have no idea what to expect. The distribution of individual delivery times is messy, lopsided, unpredictable.
Now do something different: instead of looking at one delivery, take the average delivery time across 50 random orders. Then do that again with a different 50. And again. And again, hundreds of times.
Here’s the strange, useful fact at the center of almost every statistical method you’ll ever encounter: even though individual delivery times are messy and unpredictable, the averages of groups of them will cluster into a smooth, symmetric, bell-shaped pattern almost every time, regardless of how weird the original delivery-time data looked. That’s the Central Limit Theorem, and that’s genuinely the whole idea.
Why “messy in, smooth out” is such a big deal
It doesn’t matter if the underlying data is skewed, lumpy, or has a bunch of outliers. It doesn’t matter if it’s delivery times, customer spending, or manufacturing defects. As long as you’re averaging a reasonably large number of independent observations, those averages will tend to form a predictable bell curve, centered on the true average, with a spread that shrinks as your sample gets bigger.
That predictability is the entire reason a bell curve ,the “normal distribution” — shows up everywhere in statistics, even for things that obviously aren’t naturally bell-shaped on their own. It’s not that reality is secretly bell-shaped. It’s that averages of things behave in this remarkably consistent way, almost regardless of what the original thing looked like.
Why this is the quiet engine behind everything else
Once you know that averages of large-enough samples reliably form a bell curve, you can do something powerful: use the known shape and spread of that bell curve to say things like “we’re 95% confident the true average delivery time is between 22 and 26 minutes”, a confidence interval or “if there were truly no difference between two delivery services, we’d rarely see averages this far apart by chance” ,the logic behind a p-value.
Nearly every statistical test you’ve ever seen cited in a news article, a scientific paper, a business report, leans on this one fact somewhere underneath the hood. You don’t have to run the math to use the intuition: the more data you average together, the more predictably that average behaves, even if the raw, individual data points are chaotic.
The two things worth remembering
More data means a tighter, more trustworthy average. This is why a poll of 40 people swings wildly from survey to survey, while a poll of 4,000 people gives a stable number you can actually rely on. Same underlying population, very different reliability, purely because of sample size.
“Reasonably large” usually means somewhere around 30 or more independent observations, though it depends on how lopsided your original data is the messier the raw data, the more observations you need before the averaging smooths it out reliably.
The takeaway
You don’t need to memorize a formula to use this. You need the picture: individual data points can be chaotic, but averages of enough of them settle into a predictable, bell-shaped pattern almost every time. That single fact is why confidence intervals exist, why larger samples are more trustworthy than small ones, and why so much of statistics despite looking intimidating from the outside is really built on one surprisingly intuitive idea.
메타데이터
- post_id
- 9c9ff20fa26c
- slug
- the-central-limit-theorem-explained-without-a-single-equation-for-people-who-failed-stats-once-9c9ff20fa26c
- url
- https://medium.com/illuminations-mirror/the-central-limit-theorem-explained-without-a-single-equation-for-people-who-failed-stats-once-9c9ff20fa26c
- canonical_url
- https://medium.com/illuminations-mirror/the-central-limit-theorem-explained-without-a-single-equation-for-people-who-failed-stats-once-9c9ff20fa26c
- author_url
- https://medium.com/@tanjima
- status
- ok
- fetched_at
- 2026-07-16 21:26:35