Chain Event Correlation: Reconstructing Timelines in Crypto Incidents
In our previous discussion on evidence integrity, we focused on establishing a clean, UTC-normalized evidence baseline. Once you have…
Chain Event Correlation: Reconstructing Timelines in Crypto Incidents
In our previous discussion on evidence integrity, we focused on establishing a clean, UTC-normalized evidence baseline. Once you have gathered and validated your raw records, the next analytical phase begins: reconstructing the event timeline.
In complex Web3 incidents, the sequence of events is rarely as straightforward as a simple list of transactions sorted by time.
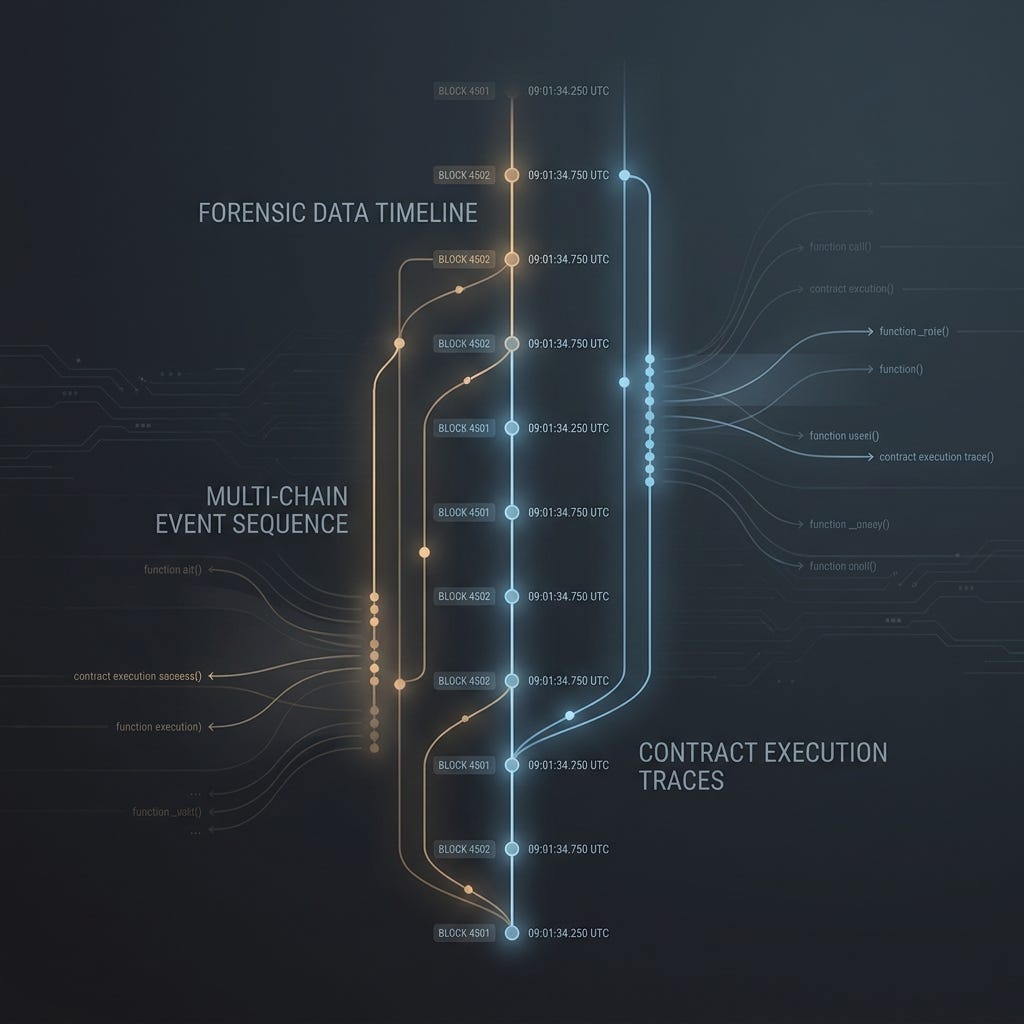
Forensic timeline visualization showing chronological block sequences, execution traces, and state change markers.
The Trap of Simple Chronologies
It is common to see incident reviews present a chronological list of transaction hashes directly copied from a block explorer and call it a timeline. While this works for simple, single-step transfers, it often falls short when analyzing multi-contract interactions, flash loans, or cross-chain events.
There are three primary reasons why basic explorer lists can be misleading:
- Intra-Block Order: Multiple transactions within the same block are not ordered by millisecond timestamps. Their execution sequence is determined by Gas price, MEV (Maximum Extractable Value) dynamics, or validator ordering logic.
- Internal Calls (Sub-transactions): Significant state changes — such as a flash loan borrow, an asset swap, or a vulnerability trigger — frequently occur deep within the call stack of a single top-level transaction. Relying solely on external transaction receipts risks missing the core mechanism of the incident.
- Cross-Chain Asynchrony: The locking of an asset on Chain A and its subsequent release on Chain B are inherently asynchronous. Network latency and varying consensus mechanisms mean that real-world time elapsed does not always equate to direct logical sequence.
Building a dependable timeline requires systematic on-chain event correlation.
Step 1: Tracing the Internal Execution Path
A top-level transaction hash is merely the entry point. The actual state transitions occur as the execution path traverses various smart contracts.
To reconstruct this path accurately, consider these steps:
- Map the Call Trace: Use tracing tools or custom Geth/Erigon trace APIs to extract the complete execution stack depth. This reveals which contracts called which functions and in what exact sequence.
- Correlate Event Logs: Event logs (such as
Transfer,Swap,Mint, orBurn) are explicit declarations of state changes. Order these logs by their absolutelogIndexwithin the block to verify the exact internal sequence of events.
Note: Smart contracts do not always emit events for every state change (e.g., direct storage modifications via SSTORE). Where event logs are absent, tracing the state storage changes directly becomes necessary.
Step 2: Isolating State Deltas (Before/After)
An effective timeline documents not just what actions occurred, but the concrete outcome of those actions. One of the more reliable ways to demonstrate this is by mapping balance changes before and after key transactions.
Since Medium does not support raw tables, using a structured text code block is often the cleanest way to present balance shifts without losing readability:
Transaction Hash: 0xabc...123
├── Address: 0xProtocolPool (Affected Contract)
│   ├── Token: USDC
│   ├── Pre-state Balance:  1,000,000.00
│   ├── Post-state Balance:   200,000.00
│   └── Net Delta:           -800,000.00
│
└── Address: 0xUserAddress (Recipient)
    ├── Token: USDC
    ├── Pre-state Balance:          100.00
    ├── Post-state Balance:     800,100.00
    └── Net Delta:            +800,000.00
When an incident involves dozens of addresses, mapping every minor transfer can introduce noise. Focus on isolating the main flows of value, and document smaller helper transfers as secondary context.
Step 3: Aligning Cross-Chain and Off-Chain Events
When an incident spans multiple blockchains or involves off-chain components (like front-end web servers or centralized exchange APIs), timeline alignment becomes more complex.
To correlate these disparate sources:
- Identify Bridging Anchors: Look for unique message IDs or nonces emitted by cross-chain bridge protocols. Typically, a
LockorBurnevent on the source chain contains a payload that is matched against the correspondingUnlockorMintevent on the destination chain. - Account for Clock Drift in Off-Chain Logs: If you are correlating web server logs or user-submitted screenshots with on-chain data, expect a margin of error. Convert all timestamps to UTC, and maintain a noted “uncertainty window” (e.g., ±15 seconds) to account for network propagation delay and server clock drift.
Practical Template: Event Chronology List
For Medium articles, a structured list with consistent bold identifiers is highly readable on both desktop and mobile devices. Below is a template for presenting a verified timeline:
Step 1 — UTC 08:00:12 | Ethereum Block #19827301
- Transaction Hash:
0xhash_A - Affected Entity:
0xUser_1 - Action: Invoked
withdrawfunction on the protocol staking pool. - Verification Source: On-chain transaction receipt and trace logs.
Step 2 — UTC 08:02:45 | Ethereum Block #19827312
- Transaction Hash:
0xhash_B - Affected Entity: Bridge Contract
- Action: Emitted
Lockevent, targeting Polygon network. - Verification Source: Nonce 5412 matched in bridge storage log.
Step 3 — UTC 08:05:00 | Polygon Block #89127
- Transaction Hash:
0xhash_C - Affected Entity: Relayer Node & Target Wallet
- Action: Executed
Unlockfunction to release matching assets. - Verification Source: Recipient address and bridge payload validation.
Analytical Pitfalls to Keep in Mind
As you piece together the chronology, remaining aware of common analytical biases can help maintain objectivity:
- Correlation vs. Causality: Just because Transaction B immediately followed Transaction A in a block does not automatically mean Transaction A caused Transaction B. Look for programmatic links (such as shared state variables or direct calls) to substantiate causality.
- Ignoring Reverted Transactions: Failed transactions often contain valuable intent. An attacker may have attempted several failed exploits before succeeding. Documenting these failed attempts can provide critical context regarding the method and timing of the incident.
- Overlooking Coincidental Events: On highly active public networks, thousands of transactions occur concurrently. Avoid the temptation to link unrelated transactions to your incident timeline unless there is clear, traceable data connecting the addresses or state changes.
Moving Forward Methodically
Reconstructing an event timeline is a process of systematic elimination rather than narrative-building. By mapping execution paths, verifying state changes, and maintaining clear boundaries between verified data and assumptions, we can build reviews that stand up to peer scrutiny.
In our next piece, we will look at how to approach the identification and documentation of the specific attack vectors or logic flaws that initiated these state changes.
메타데이터
- post_id
- 9ced2cb3696a
- slug
- chain-event-correlation-reconstructing-timelines-in-crypto-incidents-9ced2cb3696a
- url
- https://medium.com/@maya.verma.audit/chain-event-correlation-reconstructing-timelines-in-crypto-incidents-9ced2cb3696a
- canonical_url
- https://medium.com/@maya.verma.audit/chain-event-correlation-reconstructing-timelines-in-crypto-incidents-9ced2cb3696a
- author_url
- https://medium.com/@maya.verma.audit
- status
- ok
- fetched_at
- 2026-06-09 15:37:30



