Weeknotes, 2026W13: The Right To Be Confused
I caught up with Schuyler Erle last week when he swung through town after ATmosphereConf 2026, the event for people doing stuff around AT…
Weeknotes, 2026W13: The Right To Be Confused
I caught up with Schuyler Erle last week when he swung through town after ATmosphereConf 2026, the event for people doing stuff around AT Protocol and Bluesky. Some of that is explicitly geographical like Schuyler’s ATGeo.org and some is tangentially geographical like Glenn Poppe’s talk on OakLog.org, local event calendars, and venue-like objects. AT Protocol is the general-purpose distributed data model behind Bluesky, and a bunch of interesting people are experimenting with ways to make it do more than microblogging.
The AT Protocol model does not directly support floating point numbers and recommends they be communicated as strings (not dissimilar to DynamoDB’s use of strings in its wire format). An interesting thing about floating point numbers as strings is that they can explicitly represent significant digits, which works well in the distributed + social context of sharing personal location details via AT Protocol and Bluesky.
If you’re going to let people talk about where they’re located, you should let them be vague about it.
The old (2008) Yahoo! Fire Eagle location service included some interesting ideas about imprecise location expressed via hierarchical geographies like neighborhoods, towns, cities, and so on. At Yahoo! they had Where On Earth IDs and a business built for targeting ads so these meaningful geographies were a natural fit. Combined with population data for each, Fire Eagle would allow for your location to be expressed at a level of precision reflecting how confusable you were willing to be: right now I’m writing from Oakland (pop. 441k) which you know is in California (pop. 39m) and the United States (pop. 349m), but I’m not going to specify the neighborhood I live in. I’m safely confusable with hundreds of thousands of people while still saying something interesting.
AT Proto doesn’t have all that advertising baggage, but it’s got floats that are strings so what can we do with them to let users communicate location to a comfortable level and no further? I’ve made ATGeo-Experiment as a demonstration, built atop the High Resolution Settlement Layer our team produced at FB/Meta in cooperation with Columbia University’s CIESIN gridded population data project GPWv4.
Decimal Demo
Let’s say you’re skeeting from -122.27119° Longitude, 37.80432° Latitude, the intersection of 14th & Broadway in downtown Oakland to ~1m precision. You want to include your location, but only to some level of vagueness. You’re initially willing to reveal your location as whole numbers rounded to (-122, 38) so your first request is for https://atgeo-experiment.teczno.com/?lon=-122&lat=38, with this (partial) response:
{
    "ulx": -122.5,
    "uly": 38.5,
    "dx": 0.1,
    "dy": -0.1,
    "total": 4535260,
    "data": [ …, [ 45967.3, 45967.3, 302894, … ], … ]
}
Using whole number degrees in this area could identify you as one of 4.5 million people in the densely populated northern Bay Area. Inside that data array is a matrix of sub-areas for each of the 0.1×0.1 degree areas nested within the 1×1 degree area that rounds to (-122, 38). On a map it looks like this:
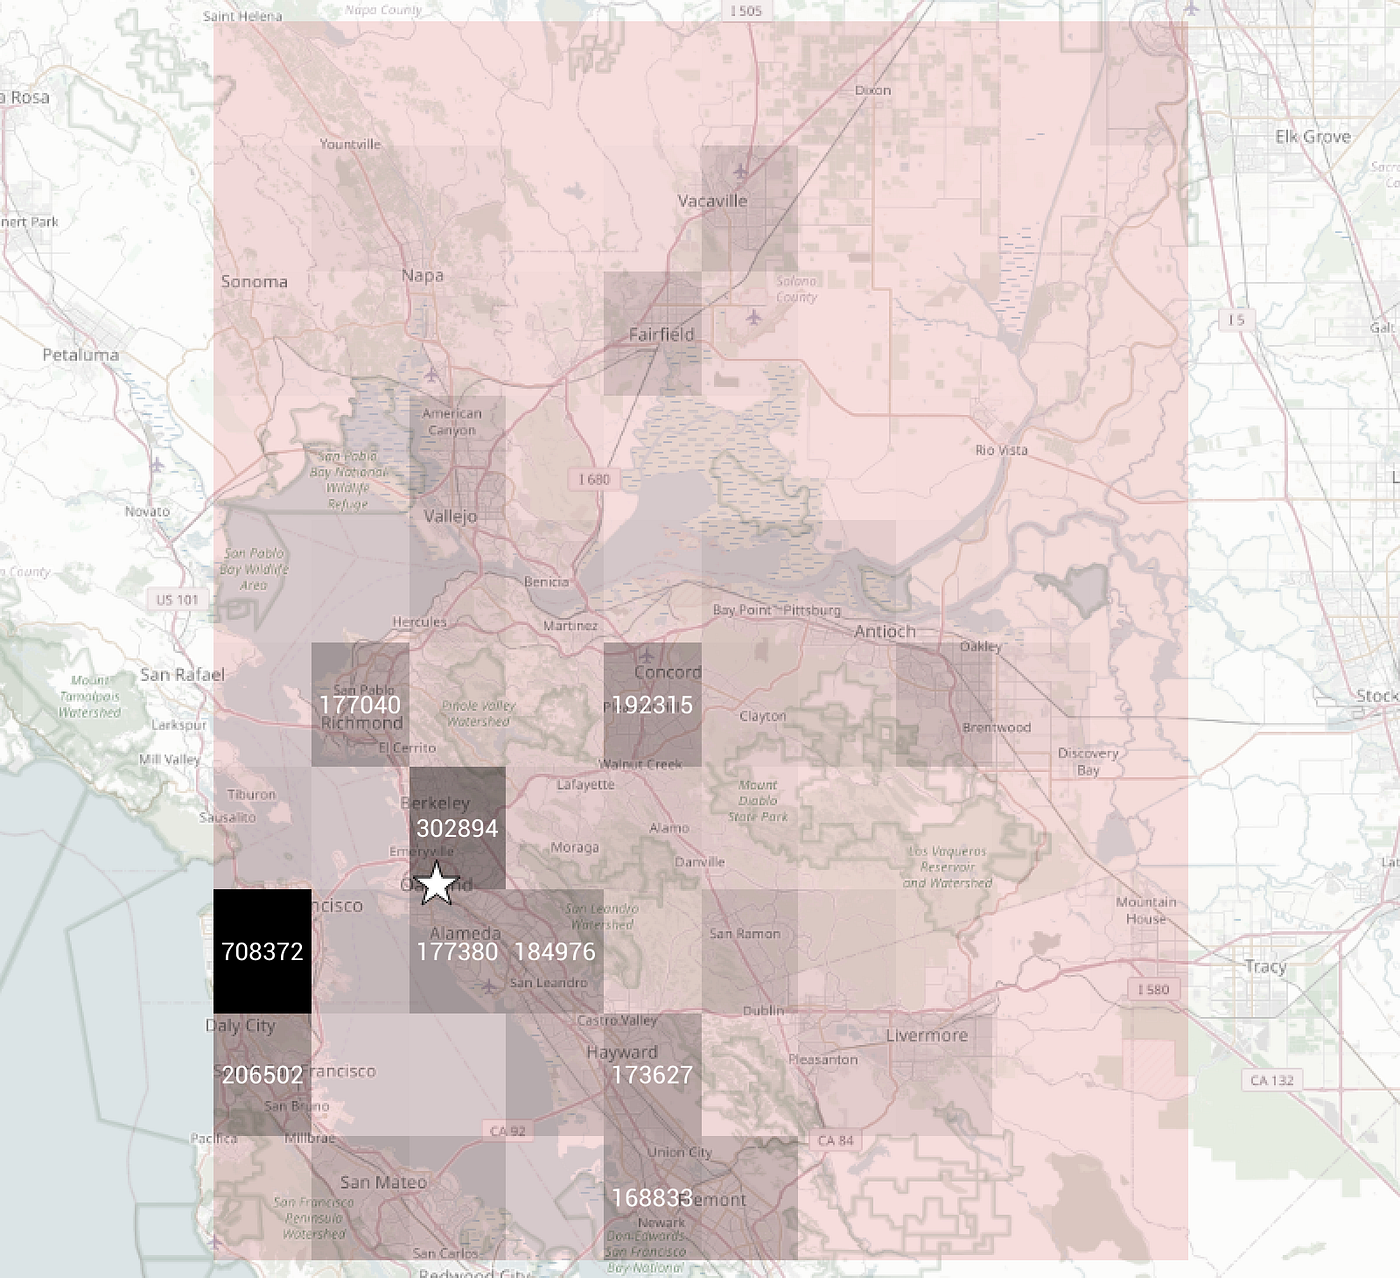
Your real location ★ and the 1×1 degree region around it
You’ve only revealed this general location, but from the look-ahead in the response you can see that another decimal point will only reveal that you’re hiding among 300k or so people. You’re willing to reveal your location as (-122.3, 37.8) and make your second request for https://atgeo-experiment.teczno.com/?lon=-122.3&lat=37.8, with this response:
{
    "ulx": -122.35,
    "uly": 38.85,
    "dx": 0.01,
    "dy": -0.01,
    "total": 164311,
    "data": [ …, [ …, 6771.7, 6570, 3894.2 ], … ]
}
The total here is 164K, different from the earlier 303K because this area is aligned a little to the west between (-122.35, 37.75) and (-122.25, 37.85). On a map it looks like this:

Your real location ★ and the 0.1×0.1 degree region around it
Your real downtown Oakland location is in one of the more heavily populated sub-areas with 6.8k people, which also seems comfortably large. It’s safe to look deeper again. You add a degree of precision including a significant zero to get (-122.27, 37.80) and make your third request for https://atgeo-experiment.teczno.com/?lon=-122.27&lat=37.80, with this response:
{
    "ulx": -122.275,
    "uly": 37.805,
    "dx": 0.001,
    "dy": -0.001,
    "total": 7198.8,
    "data": [ [ null, null, null, 5.3, … ], … ]
}
The total here is 7.2K for an area between (-122.275, 37.795) and (-122.265, 37.805). Your real downtown location now has just 5 people in it, and the densest areas here have just a few hundred. Each sub-area is just 100m long from North to South and we’re reaching the limits of HRSL’s 30m×30m precision. You know from the response what a third decimal degree of precision will say about your location, you’re not comfortable with it, so you stop here only having revealed two digits:

Your real location ★ and the 0.01×0.01 degree region around it
This map reveals an interesting thing about population density, that people don’t tend to actually live in busy commercial districts. ATGeo.org focuses on points of interest (shops, schools, etc.) as an alternative signal of density which could fill in the blank spots of the map above, still supporting a hybrid idea of confusability based on more than resident population.
DGGs
The powers-of-ten steps in the demo above are pretty large. There are other ways to mosaic the globe generally called discrete global grids and the experiment supports two of them, geohashes and quadkeys. I chose these two due to their simplicity: both can be trivially implemented with very little code, 31 lines for geohash.py and 42 lines for quadkey.py in both directions with no external libraries, important for a potentially distributed project with unclear (for now) user needs.
Both work similarly to the decimal degrees above.
- Geohash
9q9pcovers 718k people in the East Bay and its response includes links to the next level down: https://atgeo-experiment.teczno.com/dgg?geohash=9q9p; each additional level of geohash precision subdivides into 32, a smaller step than the 100 of decimal degrees - Quadkey
02301021222covers 478k people in the East Bay and its response similarly includes links to the next 3 levels down: https://atgeo-experiment.teczno.com/dgg?quadkey=02301021222; each additional level of quadkey precision subdivides into just 4 so it’s the finest-grained version of this idea
Other DGGs include S2, H3, and A5 but all of them require math or software libraries beyond what’s reasonable for a potentially distributed system.
Winding Up
One interesting next move here would be to incorporate POI density from a dataset like Overture or OpenStreetMap as a way to fill in the gaps of residential population. Another would be to understand more about the spatial possibilities of AT Protocol.
메타데이터
- post_id
- 9e48e52f8c4f
- slug
- weeknotes-2026w13-the-right-to-be-confused-9e48e52f8c4f
- url
- https://medium.com/@michalmigurski/weeknotes-2026w13-the-right-to-be-confused-9e48e52f8c4f
- canonical_url
- https://medium.com/@michalmigurski/weeknotes-2026w13-the-right-to-be-confused-9e48e52f8c4f
- author_url
- https://medium.com/@michalmigurski
- status
- ok
- fetched_at
- 2026-06-10 08:17:25

