Design and Implementation of a Multi-Host SOC Lab Using Splunk SIEM
Introduction
Design and Implementation of a Multi-Host SOC Lab Using Splunk SIEM
Introduction
Security Operations Centers (SOC) rely on SIEM platforms to detect, analyze, and respond to threats in real time. To gain practical SOC experience, I designed and implemented a multi-host SOC lab using Splunk SIEM, integrating Windows and Linux systems. This article outlines the lab architecture, setup process, and key learnings from the implementation.
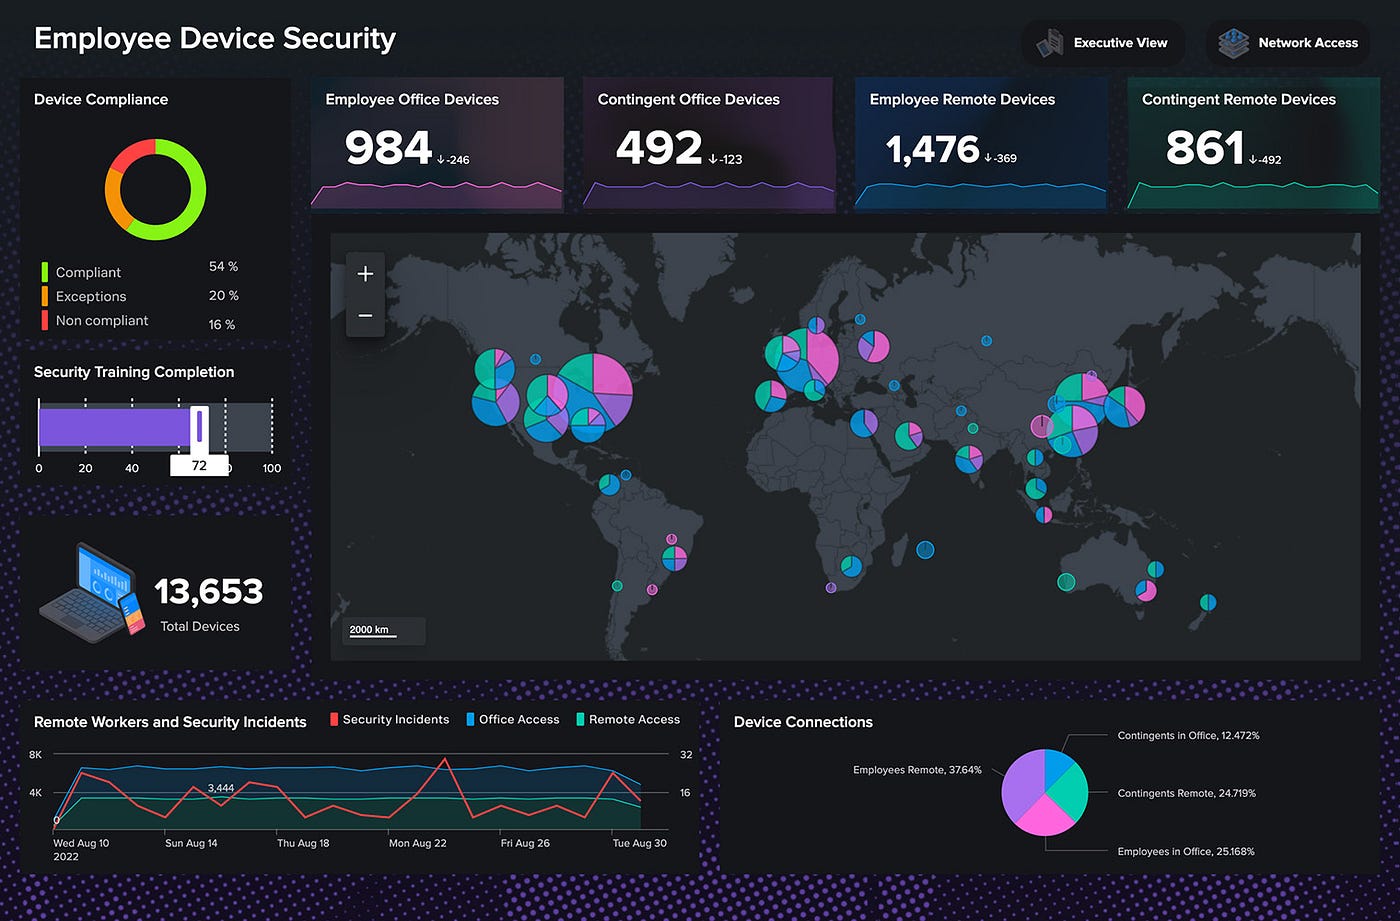
Step 1-Download Splunk Enterprise in your Windows
- search Splunk enterprise download in your browser
- click on the https://www.splunk.com/en_us/download.html.
- click free trial on Splunk enterprise in the platform section.

- fill the requirements and agree the polices.

. Click on download now and we can see our Splunk enterprise is downloading
Step 2-Installing Splunk Enterprise
.open the downloaded file

Click on the agree and customize option

use change option to select disk to save
. Click on next button

Note: U should never forget the username and password
. Enter your required username and password

.click on the installation

This took some time to complete
. After the installation ;

click on finish
. We can see that a page is automatically run on your browser

. Enter your username and password, we entered early on the setup
. Click on sign in

. Click on search and reporting
. Click on data summary

. We can see that no hosts are connected
Step3 -Converting journal (binary) to rsyslog
why it's needed?
Converting or forwarding systemd-journald (binary logs) to rsyslog is needed when setting up Splunk on Parrot OS because Splunk works best with plain text log files, not binary journal data. By default, Parrot OS stores system logs in journald’s binary format, which can only be reliably read using journalctl and is not ideal for continuous monitoring by Splunk Universal Forwarder. When logs are forwarded from journald to rsyslog, they are converted into traditional text-based files such as /var/log/syslog and /var/log/auth.log, which Splunk can easily monitor, parse, index, and rotate. This setup ensures that critical security events like authentication attempts, sudo usage, SSH access, and kernel messages are consistently collected and visible in Splunk dashboards. Therefore, journald-to-rsyslog conversion is essential to achieve stable, real-time log ingestion and effective SOC-level monitoring in Parrot OS using Splunk.
. Open your parrot OS in VM
. Open your terminal
sudo apt install rsyslog
sudo systemctl enable rsyslog
sudo systemctl status rsyslog
dkg -l | grep rsyslog
ls /lib/systemd/system/rsyslog.service
sudo systemctl start rsyslog
sudo systemctl status rsyslog

sudo nano /etc/systemd/journal.conf
#ForwardToSyslog=yes
sudo systemctl restart system-journald
systemctl restart rsyslog
Now Your system is now using a dual logging pipeline
→ journald continues collecting system events
→rsyslog converts those events into text-based logs
→Logs are now SIEM-ready for tools like Splunk
Step 4-Setup Splunk forwarder in your Linux
. Open your parrot OS in your virtual machine
. Open your browser and search Splunk universal forwarder
. Click on the official Splunk universal forward download website
. If u see a login page which we have seen early on step 1, click sign in enter your email and password which used to download Splunk enterprise

Note:i selected linux because im setting forwarder in my parrot os
. Select the 64-bit Debian version. I'm doing command line, so copy the wget link of deb
. Open your terminal
. Paste the wget link

confirm that reach 100% or any error
ls | grep "splunk"
sudo dpkg -i splunkforwarder-10.0.2-e2d18b4767e9-linux-amd64.deb
ensure it complete
sudo /opt/splunkforwarder/bin/splunk start --acept-licence
use space bar continuosly whil reaching to enter username and password

note:don‘t forget the username and password
. After that, open your Splunk enterprise
. Click on search and report
. Go to settings and select forward receiving data

. Click on add new option from the receive data
. Enter the port number

. We need to forward our logs so;
. Run the command in terminal
sudo /opt/splunkforwarder/bin/splunk add forward-server ip_address:9997
note: enter the ip of ur splunk enterprise
sudo /opt/splunkforwarder/bin/splunk list forward-server
sudo /opt/splunkforwarder/bin/splunk add monitor /var/log
. Open your Splunk enterprise
. Click on search and report
. Click on data summary
. We can see that our host is connected


Now u can search and analyse ur logs of ur parrot os
Setup Splunk forwarder on Windows
. Download Splunk universal forwarder on your windows
. Download 64-bit Windows 10,11
now we can see plunk forward msi is downloading
. Open the msi file
. Accept the license agreement and click next
. Again click next

. Select local system and click next
. Tick your required logs and click next
. Enter username and password
Now we can see hostname or IP
. Enter your IP address and port

now we can see a receiver index
. Again add your IP address and port on which we created early (9997)

. Click install
After the installation, open your Windows PowerShell as an administrator
cd "C:\Program Files\SplunkUniversalForwarder\bin\"
 ./splunk add monitor C:\windows\System32\winevt\logs
./splunk restart
These commands are used to configure the Splunk Universal Forwarder on a Windows system to collect important system and security logs and send them to a Splunk server. By navigating to the Splunk Forwarder’s bin directory, you are accessing the Splunk management tool. The command to add a monitor on C:\Windows\System32\winevt\Logs tells Splunk to watch the Windows Event Log files, which record critical activities such as user logins, failed authentication attempts, system errors, and service events. Restarting the Splunk Forwarder applies this configuration, ensuring that these Windows logs are continuously collected and forwarded to the Splunk Indexer for centralized analysis, alerting, and security monitoring.
Next open your command prompt as an administrator
cd "C:\Program Files\SplunkUniversalForwarder\bin"
.\splunk.exe list forward-server
Final Step
open your Splunk enterprise
click on search and report
click on data summary
. Now we can see that our windows is connected

Now we can see both linux and windows logs
CONCLUSION
The design and implementation of this multi-host SOC lab using Splunk SIEM provided valuable hands-on experience in real-world security monitoring and analysis. By integrating both Windows and Linux systems, the lab successfully demonstrated centralized log collection, event correlation, and basic threat detection workflows commonly used in SOC environments. This project strengthened my understanding of SIEM architecture, log analysis, and SOC operations, and serves as a solid foundation for further exploration in advanced threat detection, automation, and blue-team security practices.
메타데이터
- post_id
- a08242e0adce
- slug
- design-and-implementation-of-a-multi-host-soc-lab-using-splunk-siem-a08242e0adce
- url
- https://medium.com/@aj4ykrishna2004/design-and-implementation-of-a-multi-host-soc-lab-using-splunk-siem-a08242e0adce
- canonical_url
- https://medium.com/@aj4ykrishna2004/design-and-implementation-of-a-multi-host-soc-lab-using-splunk-siem-a08242e0adce
- author_url
- https://medium.com/@aj4ykrishna2004
- status
- ok
- fetched_at
- 2026-06-21 15:33:18

