From ETL to Insights: Analyzing Repeat Customer Support Calls at Google Fiber
Google Business Intelligence Certificate — Google Fiber (Part 2)
From ETL to Insights: Analyzing Repeat Customer Support Calls at Google Fiber
Google Business Intelligence Certificate — Google Fiber (Part 2)
Before starting ETL, it is advisable to prepare a Stakeholder Requirement Document, a Project Requirement Document, and a Strategy Document, as outlined in the following article.
Next Step
After completing the above documents, we will now proceed with ETL. To work with the Google Fiber data, we will need to upload your data to the appropriate workspace. If we plan on using BigQuery or Dataflow, upload the files to our project space to JOIN them. Additionally, because this data is already clean, we can connect these datasets in Tableau directly and merge them there.
Here are three CSV files:
After downloading all dataset, we are going to analyze data to achieve business goal by using BigQuery and Tableau.
BigQuery
In order to upload all three datasets to the BigQuery platform, we need to create a dataset in the data pipeline first, as shown in the image below.
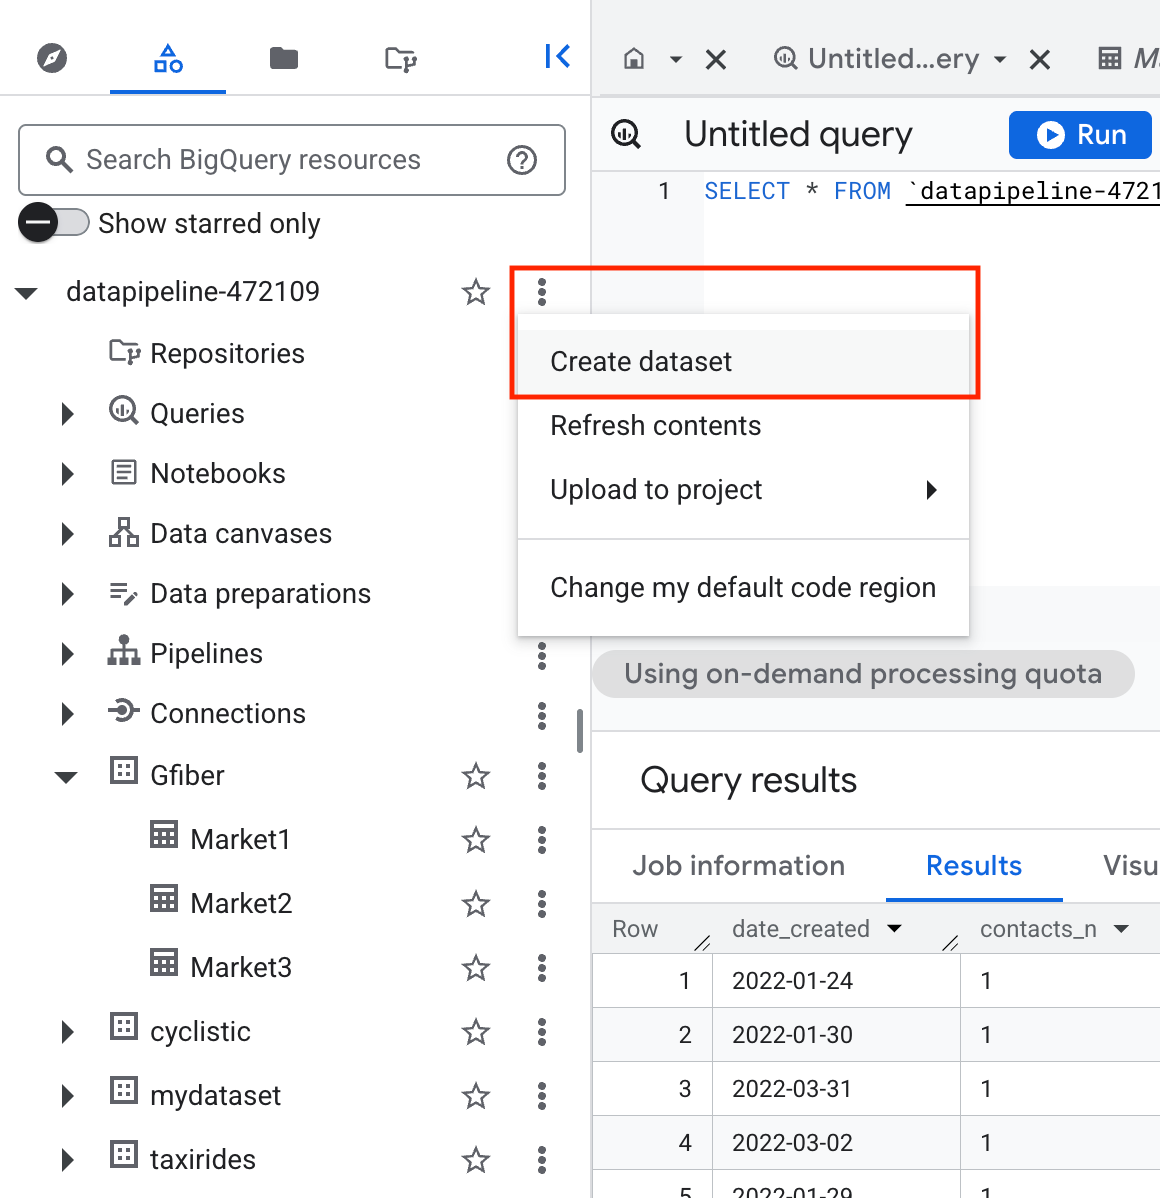

After creating the datasets, we can start creating three separate tables for Markets 1, 2, and 3.


Since all data are already clean, we can directly connect these datasets in Tableau and merge them there.
Tableau
First, we need to upload all the data, but we can only upload one file at a time. Please note that we need to use the “Add Data Source” button to add more data, as shown in the screenshot below.

After adding all datasets, the table will be displayed as a logical table by default, as shown in the image below.

Additional Information About Logical Table
Data Modeling
is the process of creating diagrams that visually represent how data is organized and structured.
There are 3 most common types of data modeling:
1. Conceptual (Business Concepts)
- Provides a high-level view of the data structure, such as how data interacts across an organization.
- Table names + conceptual relationships
2. Logical (Data Entities)
- Focuses on the technical details of a database, such as relationships, attributes, and entities.
- Does not operate on data rows directly; it only handles the data’s structure and relationships.
- Union and Join operations require modifying the rows, so they must be performed in the Physical Layer.
- Columns + relationship rules
3. Physical (Physical Tables)
- Represents the actual implementation of the database.
- Focuses on how data is stored, structured, and accessed in the database.
- Enables operations that modify data, such as Union and Join.
- Columns + actual data rows
- There are many tools for developing data models. Commonly used tools include:
a. Entity Relationship Diagram(ERD)
b. Unified Modeling Language Diagram (UML)
Once the file is added to Tableau, it is treated as a logical table, which allows the use of only joins and relationships.
Logical Layer - Join

If we want to union multiple tables, we need to add all the tables to the same connection. After adding one table, we can click Edit Connection and add more files in Tableau.
Physical Layer — Union


Once we have connected your first data source, add the other two files from the Data source page. Upload the two CSV files into our workbook. After connecting them, they will appear in the Files menu, which enables we to drag the tables into the data connections pane. Drag market_1 into the pane first.
Then drag market_2 underneath the market_1 icon until the Union option appears.
Afterwards, we start analyzing the data and ensure it aligns with the business goals based on the stakeholder requirements, project plan, and strategy documents prepared in advance.
Repeat Calls by First Call Date
To show the day of the initial call and repeat calls, we use Measure Names and Measure Values to create the chart, as illustrated below.

Note: Whenever we have more than one column name to display on a chart, we need to put Measure Names on Columns and then put Measure Values on Text to show multiple values in a single chart.
Calls by Market and Type
Next, we use Market 3 as an example to create a table showing repeat calls from different markets by different types.

Repeats by Year, Quarter, Month, and Week
Since we want to compare repeat contacts across different months, we place Quarter, Month, and Measure Names to display different levels of granularity. We then add Measure Values to show the contact volumes.

Day 0, Day 1, and Day 2 Repeat Calls (%) Across 5 Call Types by Month


Dashboard — Status of Repeated Contacts Across Different Types by Month in Market 3

Repeat Calls by Month
Based on the chart, February has the highest overall call volume(5,341) and also the highest repeat call rate by Day 7 at 5.26%.
In comparison, January and March show lower repeat call rates of 3.66% and 3.51%, respectively, suggesting that repeat call behavior is more pronounced in February.
This pattern highlights February as a key period for further investigation into the drivers of repeat calls.
Suggestions
Google Fiber should further investigate the factors contributing to the elevated repeat call rate in February and assess whether operational adjustments, such as staffing capacity or process improvements, are needed during this period.
Repeat Call Percentage
Based on the dashboard, Internet/WiFi (Type_5) and Technician Troubleshooting (Type_2) generate the highest initial call volumes, but they maintain relatively low repeat call rates by Day 7 (below 4%).
In contrast, Account Management (Type_1) represents a significant operational challenge. It has the highest repeat call rate, beginning at 35.18% and remaining as high as 23.32% after seven contacts, indicating that these issues are often not resolved during the first customer interaction.
Scheduling (Type_3) also demonstrates elevated repeat behavior, with an 8.35% repeat rate at Day 7 — approximately double the rate observed for technical issue categories.
Suggestions
- Google Fiber should prioritize improving first-call resolution for Account Management issues by simplifying account-related processes and providing clearer customer-facing guidance for common account tasks.
- For Scheduling-related issues, the team should review appointment status and confirmation processes, as persistent repeat calls suggest gaps in scheduling clarity or follow-up communication.
- While Internet/WiFi and Technician Troubleshooting calls drive high overall volume, their low repeat rates indicate effective first-contact resolution. These categories should be monitored for volume trends rather than prioritized for repeat-call reduction initiatives.

메타데이터
- post_id
- a0ba7a5667bf
- slug
- from-etl-to-insights-analyzing-repeat-customer-support-calls-at-google-fiber-a0ba7a5667bf
- url
- https://medium.com/@chiauli/from-etl-to-insights-analyzing-repeat-customer-support-calls-at-google-fiber-a0ba7a5667bf
- canonical_url
- https://medium.com/@chiauli/from-etl-to-insights-analyzing-repeat-customer-support-calls-at-google-fiber-a0ba7a5667bf
- author_url
- https://medium.com/@chiauli
- status
- ok
- fetched_at
- 2026-06-13 07:35:29