Distributed Tracing in Java Spring Boot
The 3 AM Incident You Don’t Want to Have
Distributed Tracing in Java Spring Boot
Distributed Tracing in Java Spring Boot
The 3 AM Incident You Don’t Want to Have
It’s 3 AM. Your on-call phone rings. Users are reporting that checkout is failing. You SSH into your servers, frantically grepping through log files across six different microservices the API gateway, user service, order service, inventory service, payment service, and notification service and all you can find are disconnected error messages with no clear thread linking them together.
Sound familiar?
This is the reality of debugging micro-services without observability tooling in place. As soon as you break a monolith into services, your logs fragment across machines, containers, and time zones. A single user request may touch a dozen services before it either succeeds or silently dies somewhere in the middle and your logs give you no way to follow it.
Distributed tracing is the solution. In this article you’ll learn exactly what it is, how it works, and how to implement it in your Java Spring Boot applications using the industry-standard OpenTelemetry toolkit with Jaeger as the tracing backend.
What Is Distributed Tracing?
Distributed tracing is an observability technique that tracks a single request as it travels through every service in your system from the moment the client sends it to the moment a response comes back.
Think of it like attaching a GPS tracker to a package in a logistics network. You can see every warehouse it passed through, how long it spent at each stop, whether anything was delayed, and exactly where things went wrong.
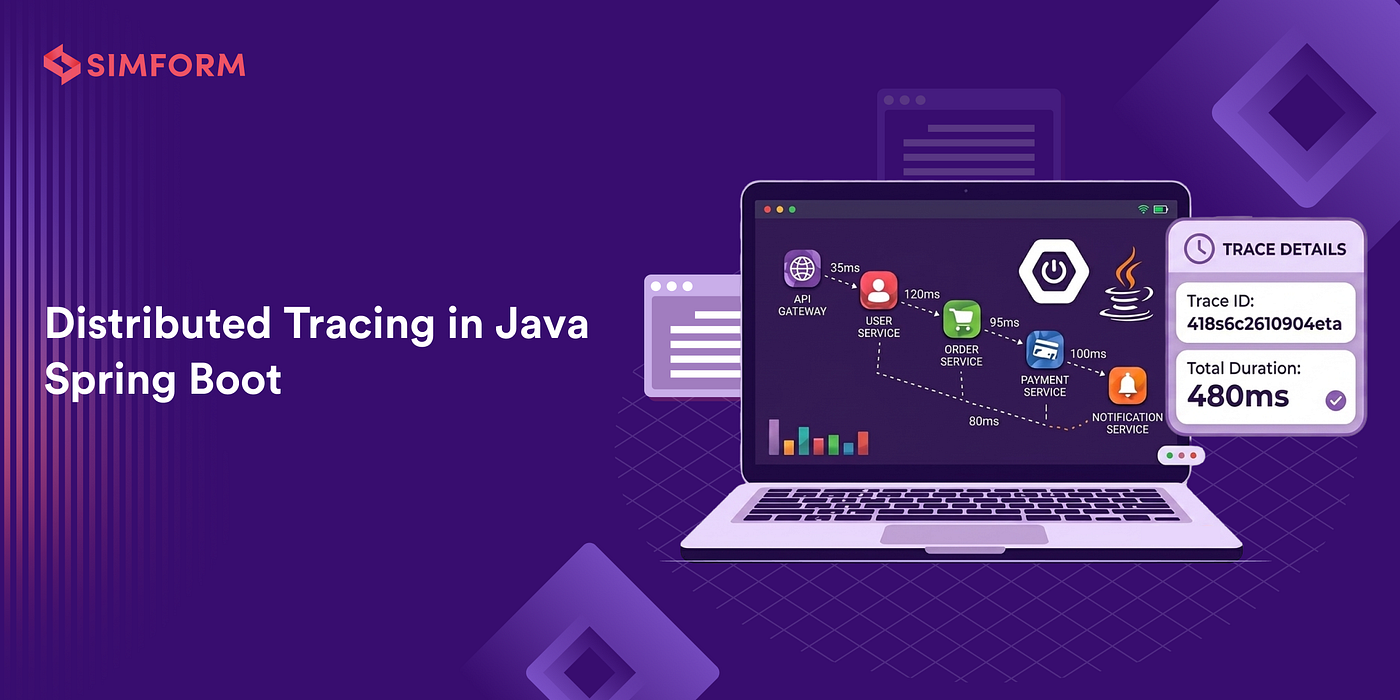
In microservice terms, here’s a typical request flow and, crucially, how long each hop takes:

With distributed tracing, you can instantly see that payment processing consumed 230ms of a 287ms total request. That’s actionable. Without it, you’re guessing.
Why Traditional Logging Falls Short
Logging is essential but it was designed for a single-process world. In a distributed system, logs have some painful shortcomings:
Logs are scattered. When a request touches six services, the relevant log lines live in six separate log files on six separate machines. Pulling them together manually is tedious and error-prone.
Logs lack context. A log line like ERROR: Payment failed tells you what happened but not which user request triggered it, what chain of calls preceded it, or how long each step took.
Correlation is manual. Some teams use a correlation ID passed in HTTP headers, but implementing, propagating, and querying this consistently across all services is significant engineering work and you’re still not getting timing data.
You can’t see the full picture. Even with perfect logs, you can’t easily visualize the shape of a distributed request which calls were parallel, which were sequential, what the latency profile looks like across the whole trace.
Distributed tracing solves all of this systematically.
Core Concepts: The Vocabulary You Need
Before jumping to code, let’s nail the core concepts. These terms appear everywhere in tracing tooling, so understanding them upfront will save you a lot of confusion.
Trace
A trace represents the complete journey of a single request through your entire system. From first touch to final response, everything is grouped under one trace.
Trace ID
A Trace ID is a globally unique 128-bit identifier (expressed as a hex string) assigned at the very first entry point of your system typically the API gateway or the first service that receives the request. This single ID is propagated to every downstream service and acts as the common thread that ties all related spans together. Example: traceId: 4bf92f3577b34da6a3ce929d0e0e4736
Span
A span is a single unit of work within a trace one HTTP call between services, one database query, one cache lookup, or any other discrete operation you want to measure. A trace is built from one or more spans. Think of the trace as the folder and spans as the individual files inside it. Example spans: “validate-user in User Service (12ms)”, “create-order in Order Service (45ms)”, “process-payment in Payment Service (230ms)”.
Span ID
Every span gets its own unique Span ID within the trace. While the Trace ID stays constant across the entire request chain, the Span ID changes with every new unit of work. This is how tracing systems distinguish between, say, three separate database calls made within the same service during the same request same Trace ID, three different Span IDs.
Parent Span & Child Span
Spans are organized in a parent-child hierarchy that reflects the actual call tree. The first span in a trace is the root span (no parent). When Service A calls Service B, the span created inside Service B is a child span of Service A’s span. This is the relationship that lets tracing tools render a flame graph you can visually see which spans triggered which downstream work, and exactly where in the call tree latency is accumulating.
Context Propagation
Context propagation is how the Trace ID and Span ID travel from service to service. When Service A makes an HTTP call to Service B, it injects the trace context into outgoing HTTP headers via the W3C traceparent standard. Service B reads those headers and creates a child span. Without propagation, each service would start a disconnected, orphaned trace.
Sampling
In production you don’t want to trace every single request that generates enormous data volumes. Sampling decides which requests get traced:
- Head-based sampling: Decide at trace start (e.g., sample 10% of all requests)
- Tail-based sampling: Collect all traces but retain only those matching criteria errors, or requests slower than 500ms

How Distributed Tracing Works: Step by Step
- Request arrives at your API Gateway or first service.
- A Trace ID is generated a UUID that identifies this request chain for its entire lifetime.
- A root span is created to represent the work happening in this service.
- The service does its work, potentially calling downstream services.
- Before each downstream call, the trace context (Trace ID + Span ID) is injected into outgoing HTTP headers via the W3C TraceContext standard.
- The downstream service reads the headers, extracts context, and creates a child span linked to the parent.
- Steps 5–6 repeat for every subsequent service hop.
- Spans are exported to a tracing backend (Jaeger, Zipkin, Tempo) as each service completes its work.
- The backend assembles the spans into a flame graph giving you the complete picture.
The Ecosystem: Tools to Know

Important: Spring Boot 3.x dropped Spring Cloud Sleuth. The correct modern approach is Micrometer Tracing + OpenTelemetry, which is exactly what we implement below.
Why OpenTelemetry? The Industry Standard Explained
OpenTelemetry (OTel) didn’t just become popular it replaced an entire generation of fragmented, vendor-specific instrumentation libraries. Here’s why it’s the right choice for every new Spring Boot project.
Vendor-neutral by design. OTel is a CNCF (Cloud Native Computing Foundation) project the same organization behind Kubernetes, Prometheus, and Envoy. You instrument your code once using the OTel API, and you can switch backends (Jaeger → Zipkin → Grafana Tempo → AWS X-Ray → Datadog) purely through configuration changes, with zero code modifications.
It unified a fragmented ecosystem. Before OTel, the Java observability landscape was split across OpenTracing, OpenCensus, Zipkin’s Brave library, and dozens of vendor SDKs all incompatible. OpenTelemetry merged OpenTracing and OpenCensus and became their official successor. The entire industry cloud providers, APM vendors, framework maintainers has aligned behind it.
Spring Boot 3.x has first-class OTel support. Spring Boot 3.x ships Micrometer Tracing as a native abstraction that bridges directly to OpenTelemetry. You get automatic HTTP request tracing, RestTemplate and WebClient context propagation, MDC log correlation, and actuator integration all out of the box with just the right dependencies. Spring Cloud Sleuth (the old approach) is no longer supported in Spring Boot 3.x; OTel via Micrometer is the official replacement.
One SDK, three observability pillars. OTel isn’t just for traces. The same SDK covers traces, metrics, and logs under a unified data model. As your observability maturity grows, you can extend the same setup to export metrics to Prometheus and structured logs to your log aggregation platform all from a single, coherently maintained library.
Hands-On: Distributed Tracing in Spring Boot 3.x
Let’s build a minimal two-service system and wire up distributed tracing end to end.

Step 1 — Maven Dependencies
Add the following to both services’ pom.xml:
<!-- Spring Web -->
<dependency>
  <groupId>org.springframework.boot</groupId>
  <artifactId>spring-boot-starter-web</artifactId>
</dependency>

<!-- Actuator (required for Micrometer Tracing) -->
<dependency>
  <groupId>org.springframework.boot</groupId>
  <artifactId>spring-boot-starter-actuator</artifactId>
</dependency>

<!-- Micrometer bridge for OpenTelemetry -->
<dependency>
  <groupId>io.micrometer</groupId>
  <artifactId>micrometer-tracing-bridge-otel</artifactId>
</dependency>

<!-- OpenTelemetry OTLP exporter → sends spans to Jaeger -->
<dependency>
  <groupId>io.opentelemetry</groupId>
  <artifactId>opentelemetry-exporter-otlp</artifactId>
</dependency>
Step 2 — application.yml Configuration
User Service (src/main/resources/application.yml):
spring:
  application:
    name: user-service
server:
  port: 8080
management:
  tracing:
    sampling:
      probability: 1.0  # 100% — lower to 0.1 in production
  otlp:
    tracing:
      endpoint: http://localhost:4318/v1/traces
logging:
  pattern:
    level: "%5p [${spring.application.name:},%X{traceId},%X{spanId}]"
Apply the same config to Order Service, changing name: order-service and port: 8081.
Step 3 — RestTemplate Bean
Creating RestTemplate via RestTemplateBuilder is critical this is how Spring Boot auto-registers the tracing interceptor that injects the traceparent header on every outbound call. A plain new RestTemplate() silently skips propagation.
@Configuration
public class RestTemplateConfig {

  @Bean
  public RestTemplate restTemplate(RestTemplateBuilder builder) {
    // Builder auto-registers the tracing interceptor.
    // This is what injects the W3C traceparent header on every call.
    return builder.build();
  }
}
Step 4 — User Service Controller
@RestController
@RequestMapping("/users")
public class UserController {

  private static final Logger log = LoggerFactory.getLogger(UserController.class);
  private final RestTemplate restTemplate;

  public UserController(RestTemplate restTemplate) {
    this.restTemplate = restTemplate;
  }

  @GetMapping("/{userId}/profile")
  public Map<String, Object> getUserProfile(@PathVariable String userId) {
    log.info("Fetching profile for userId={}", userId);

    // traceparent header injected automatically by the instrumented RestTemplate
    String url = "http://localhost:8081/orders/user/" + userId;
    Map<String, Object> orders = restTemplate.getForObject(url, Map.class);

    return Map.of(
        "userId", userId, "name", "Jane Doe",
        "email", "jane@example.com", "recentOrders", orders
    );
  }
}
Step 5 — Order Service Controller
@RestController
@RequestMapping("/orders")
public class OrderController {

  private static final Logger log = LoggerFactory.getLogger(OrderController.class);

  @GetMapping("/user/{userId}")
  public Map<String, Object> getOrdersForUser(@PathVariable String userId) {
    // This traceId matches the one in User Service — same trace!
    log.info("Fetching orders for userId={}", userId);

    return Map.of(
        "userId", userId,
        "orders", List.of(
            Map.of("orderId", "ORD-001", "status", "DELIVERED"),
            Map.of("orderId", "ORD-002", "status", "PROCESSING")
        )
    );
  }
}
Step 6 — Run Jaeger Locally
docker run -d --name jaeger \
  -p 16686:16686 \   # Jaeger UI
  -p 4318:4318 \     # OTLP HTTP receiver
  -p 4317:4317 \     # OTLP gRPC receiver
  jaegertracing/all-in-one:latest
Open http://localhost:16686 to access the Jaeger UI.
Step 7 — See It in Action
curl http://localhost:8080/users/42/profileCheck your log output across both services. You’ll see the same Trace ID appearing in both, with different Span IDs:
# user-service log
INFO [user-service,4bf92f3577b34da6a3ce929d0e0e4736,a3ce929d0e0e4736] Fetching profile for userId=42

# order-service log — SAME traceId, different spanId
INFO [order-service,4bf92f3577b34da6a3ce929d0e0e4736,b9c4f1d2e3a5b6c7] Fetching orders for userId=42
In the Jaeger UI, select user-service from the dropdown and click Find Traces. You'll see the complete flame graph — User Service parent span with Order Service child span nested underneath, with exact timing for each.
Observing Traces in the Jaeger UI
Once both services are running and you’ve fired a request via curl, here's how to read exactly what Jaeger is showing you.
Finding Your Trace
Open http://localhost:16686. In the left panel, set the Service dropdown to user-service and click Find Traces. You'll see a reverse-chronological list of recent traces. Each row shows the service name, root operation, total duration, and the number of spans. Click any row to open the detail view.
Reading the Flame Graph
The detail view is a Gantt-style flame graph. The widest bar at the top is the root span — the total end-to-end duration of the request. Nested below are child spans, each indented to reflect the parent-child call tree. For our two-service example you’ll see something like this:
# Root span: total request time in user-service
user-service   GET /users/42/profile        287ms  ███████████████████████████
  # Child span: work done inside user-service
  user-service   validate-user                12ms  ██
  # Child span: the outbound call to order-service (same Trace ID!)
  order-service  GET /orders/user/42          45ms  ████
Expanding a Span for Details
Clicking any span bar expands it to reveal its tags (key-value attributes) and logs (timestamped events). For an HTTP span, you’ll see the URL, method, status code, and response size. For a database span, you’ll see the query. This is where you look when a span shows unexpected latency the tags tell you the exact SQL query, cache key, or downstream endpoint that is taking time.
Identifying Bottlenecks Visually
The visual width of each bar directly represents its proportion of the total trace duration. A span that fills 80% of the bar width is your bottleneck no arithmetic required. In real production usage, Jaeger’s Compare Traces feature lets you overlay a slow trace against a fast one to immediately spot structural differences: an extra downstream call, a missing cache hit, or a sudden spike in a previously fast span.
Filtering by Error or Latency
In the search panel, you can filter traces by tags for example, set error=true to show only failed traces, or set a minimum duration to surface traces slower than a threshold. These filters turn Jaeger from a debugging tool into a continuous performance monitoring view: after every deployment, filter for P99 traces to immediately confirm whether latency improved or regressed.
Conclusion
Distributed tracing transforms the way you understand and debug microservice systems. Instead of piecing together logs from a dozen places, you get a single coherent view of every request across every service, every hop, and every millisecond.
Here’s what we covered: the core concepts (traces, spans, trace IDs, context propagation, sampling), how a trace flows automatically using W3C TraceContext headers, and how to implement end-to-end tracing in Spring Boot 3.x using Micrometer Tracing + OpenTelemetry + Jaeger. The implementation is deliberately low-effort just dependencies, three lines of YAML per service, and a RestTemplate bean.
The Jaeger UI gives you immediate visual feedback. And when something breaks at 3 AM, you’ll have exactly the tool you need to find it in seconds rather than hours.
As distributed systems grow in complexity, end-to-end observability becomes critical for maintaining reliability and performance. Simform helps organizations implement tracing, metrics, and logging solutions that improve visibility across applications and accelerate issue resolution.
Try It Yourself
If you’d like to explore the implementation discussed in this article, here is the repository : http://github.com/backend-simformsolutions/distributed-tracing-blog-poc
메타데이터
- post_id
- a123401ebde7
- slug
- distributed-tracing-in-java-spring-boot-a123401ebde7
- url
- https://medium.com/simform-engineering/distributed-tracing-in-java-spring-boot-a123401ebde7
- canonical_url
- https://medium.com/simform-engineering/distributed-tracing-in-java-spring-boot-a123401ebde7
- author_url
- https://medium.com/@avinash.h
- status
- ok
- fetched_at
- 2026-07-09 20:10:33