What 961 Token Launches Taught Us About LBP Configuration
Frequently, LBP configurations are chosen by gut feeling. Teams copy what the last project did, tweak a number or two, and hope for the…
What 961 Token Launches Taught Us About LBP Configuration
Frequently, LBP configurations are chosen by gut feeling. Teams copy what the last project did, tweak a number or two, and hope for the best. There’s rarely a data-backed reason behind any of it.
We wanted to change that, and provide teams a way to test their LBP parameters before actually launching the pool. That’s why we, in partnership with NEO Empresarial, analyzed 961 Liquidity Bootstrapping Pools deployed across Ethereum, Polygon, and Arbitrum, spanning every swap, liquidity event, and bot transaction from 2021 through 2024. The goal was to figure out which parameters actually affect launch outcomes, and which ones are just noise.
How We Built the Dataset
All onchain data was sourced from @dune, querying Balancer V1 and V2 pool contracts across Ethereum, Polygon, and Arbitrum. The raw extraction returned over 2,400 rows, but that included noise: configuration updates, pool pauses, resets, and test deployments that never ran a real sale. To isolate actual launches, we filtered out any pool with a duration under 12 hours and kept only the earliest valid event per pool address. That brought the dataset down to 961 unique launches.
Success Isn’t Predictable, But Failure Is
The first thing we tried was building a model to predict which configurations would produce successful launches. It didn’t work.
We tested every standard prediction model against the data. The best one explained about 5% of what makes a launch successful. To put that in perspective, that’s like trying to predict whether a restaurant succeeds by only looking at the kitchen layout. The layout matters, but the food, the service, the location, and the reviews matter a lot more. Same thing here. Configuration is one input. Marketing, community strength, narrative timing, and project quality make up the other 95%.
But when we flipped the question and asked “which configurations are basically guaranteed to fail?”, the data lit up. Our model correctly identified launches headed for heavy sell-offs about 3 out of 4 times, scoring 0.76 out of 1.0 on the AUC metric, which is the standard used by financial institutions to validate whether a risk model is reliable enough for real decision-making. We couldn’t predict winners, but we could spot the losers before they even started.
A perfect configuration won’t save a weak project from a bad launch, but a bad configuration will sink a strong one.
Here’s what we analyzed. Each LBP was broken down into these configurable parameters:
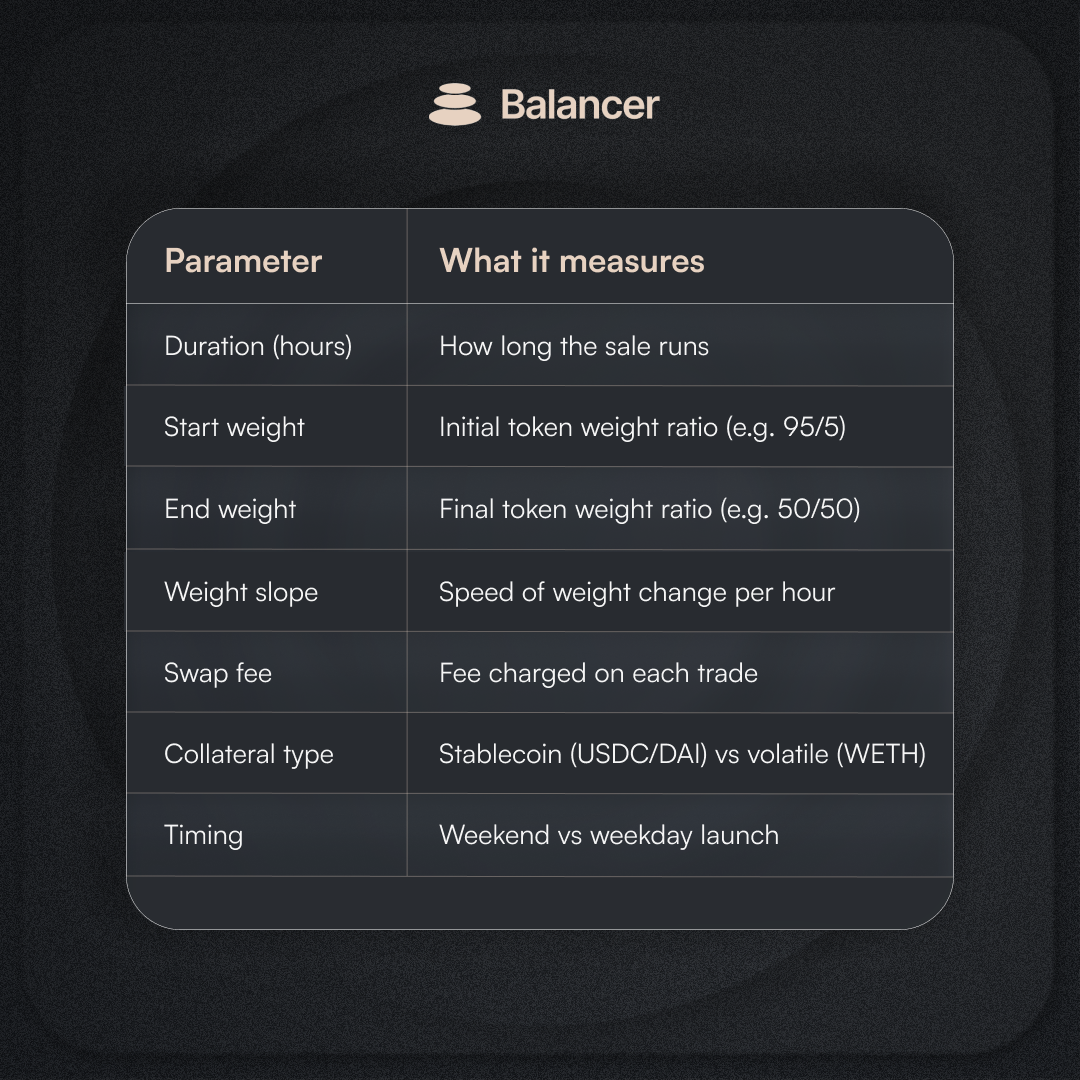
The question then became: what configurations are teams using, and do any of them reliably produce better outcomes?
What Most Teams Actually Do
Before getting into what the results show, here’s what teams are doing in practice.
The average LBP in our dataset ran for about 88 hours (roughly 3.5 days). Starting weights were concentrated between 90% and 99% for the project token, showing near-universal agreement on starting high. Most teams also avoided launching on weekends, likely to maximize participation during regular trading hours.
Where strategies diverged was on ending weights. The data showed two clear camps: one group went for a full flip (ending near 10–20% project weight), and another aimed for a soft landing at 50/50, setting the pool up to transition directly into a standard trading pair.
The rate of weight change (slope) stayed consistently low, averaging around 0.01 per hour. Even as teams chose different durations and end weights, they tended to keep the shift gradual.
But none of these individual choices correlated strongly with success on their own. Our correlation matrix showed near-zero coefficients across the board. There’s no single “magic number” for any parameter. The data instead pointed to specific combinations and thresholds that matter, which we break down below.
Weight Slope: The Parameter That Kills Launches
While most parameters showed weak individual effects, one stood out clearly above the rest.
Weight slope is how fast the token weights change per hour during the sale. Out of everything we tested, the data shows it’s the only parameter that can single-handedly cause a launch to fail.
Think of it like a faucet. Below 0.6, the price drains slowly enough that buyers can keep up. Above 0.6, the faucet is fully open and the pool is dumping tokens faster than anyone can absorb them. It doesn’t matter how much demand you have. The math overwhelms the market.
The data shows a sharp inflection point at 0.6. Above that threshold, the probability of excessive dump pressure spikes. Keeping slope below 0.6 appears to be the single most important configuration decision a team can make.
The Duration Sweet Spot
Duration matters, but not in the way most teams assume. The common instinct is that longer launches are safer because they give more people time to participate. The data says otherwise.
Bot activity follows a U-curve. Too short and too long are both bad, but for different reasons.
Pools under 24 hours don’t give real people enough time to find the sale, read up on the project, and decide to buy. The data showed these short pools also suffered from capital inefficiency, since there simply wasn’t enough time for meaningful trading volume to develop. Pools over 72 hours turn into a slow, predictable price drop that bots can feed on for days. Think of it like leaving your front door open overnight versus locking up after a few hours. The longer the window stays open, the more uninvited guests walk in.
The numbers back it up. Medium-duration pools (24 to 72 hours) saw bot activity around 10.4%. Pools under 24 hours came in at 11.8%. But pools over 72 hours jumped to 16.8%, over 60% more bot activity than the middle range.
On the capital efficiency side, risk drops steadily as duration increases from 12 hours, then flattens around the 72-hour mark. Going beyond three days added no measurable safety benefit in our dataset while increasing bot exposure.
The data suggests an optimal window of 48 to 72 hours. Long enough for genuine price discovery, short enough to avoid becoming a target.
The Parameters That Matter Less
Two of the most debated LBP parameters, starting weight ratios and swap fees, turned out to be statistically irrelevant to launch outcomes in our analysis.
We tested the hypothesis that starting at a more extreme ratio (say 95/5 versus 80/20) provides meaningful protection against price crashes. The correlation with price retention came back at 0.049. The correlation with dump pressure was -0.098. Both are effectively zero. A token launching at 50/50 is just as likely to crash as one launching at 90/10 if the underlying demand isn’t there.
Swap fees showed the same flatness across the entire range, with less than 5% variance in risk outcomes. Whether you set fees at 1% or 3%, the data showed no meaningful change to the safety profile of the pool.
The research suggests these are preference parameters, not safety parameters. Teams can set them based on revenue or marketing goals. According to our analysis, they don’t appear to significantly affect launch outcomes either way.
What Healthy Launches Actually Look Like
To validate the model, we ran a forensic comparison between failed LBPs (high bot sniping, heavy dumps, severe price collapse) and the healthiest pools in the dataset.
Two patterns stood out. Healthy pools had an average starting weight of around 94%, while dumped pools averaged closer to 87%. A dominant initial project weight creates a high-price buffer that absorbs early volatility. Lower starting weights leave the pool exposed to immediate selling pressure the liquidity curve can’t dampen.
Sniped pools also ran significantly longer, averaging around 100 hours compared to 87 hours for healthy pools. Duration didn’t protect them. It gave sophisticated actors more time to extract value.
Final Thoughts
Configuration is a defense layer, not a growth lever. It won’t make a weak project succeed, but it will stop a strong project from failing mechanically. LBPs put projects in full control of that configuration, with pricing and execution happening onchain where anyone can verify. Now there’s data to back those decisions.
This research helps teams back up their choices. Which parameters carry weight, which ones are cosmetic, where the risk thresholds are, and what the healthiest launches in the dataset had in common.
For teams that want to dig into the methodology, see how the scoring model was built, or explore the full correlation and failure analysis, the full report is available.
If you’re planning a launch, stress-test your configuration before committing a single token. The LBP Simulator lets you model demand scenarios, visualize price curves, and pressure-test your parameters against real data.
Whether you’re ready to launch or still figuring out your approach, reach out to our team. We are happy to help with configuration, strategy, or just answering questions.
메타데이터
- post_id
- a1c4beffca3a
- slug
- what-961-token-launches-taught-us-about-lbp-configuration-a1c4beffca3a
- url
- https://medium.com/balancer-protocol/what-961-token-launches-taught-us-about-lbp-configuration-a1c4beffca3a
- canonical_url
- https://medium.com/balancer-protocol/what-961-token-launches-taught-us-about-lbp-configuration-a1c4beffca3a
- author_url
- https://medium.com/@joao_10366
- status
- ok
- fetched_at
- 2026-06-20 20:29:01