When MongoDB Isn’t Slow — It’s Starved: A Performance Mystery
A deep dive into WiredTiger cache eviction under load
When MongoDB Isn’t Slow — It’s Starved: A Performance Mystery
Database performance issues are often investigated through query execution, index usage, cache sizing, disk or network I/O bottlenecks and other related parameters. In most systems, those parameters explain the majority of latency problems but not always.
This is an intriguing case of a MongoDB system that began to experience intermittent read and write failures, alongside cache eviction pressure and increase in write latency even though disk I/O was stable, memory usage was within limits, and average CPU utilization looked healthy. These cases are harder to reason about because the bottleneck does not originate within MongoDB itself.
The interesting part is not that latency appears, but that it does so without an obvious bottleneck. Understanding where that time goes requires stepping back from MongoDB itself and diving deeper into how execution unfolds inside the Linux kernel.
The System Under Load
The workload considered here is a write heavy backend system where MongoDB serves as the primary datastore. The service issues a continuous stream of inserts and updates and relies on synchronous write acknowledgements. Traffic is steady overall, with periodic bursts that increase network and replication activity.
The database is sharded. At glance, the cluster appears appropriately scaled for the workload. And monitoring shows moderate overall CPU utilization and stable disk latency, with no immediate indicators of pressure at the compute or memory levels.
Despite this, write latency begins to increase, followed by intermittent timeouts. The absence of obvious saturation makes the behavior difficult to attribute to a single resource.
The First Clue: Cache Eviction That Didn’t Add Up
The WiredTiger storage engine is the default storage engine for MongoDB. WiredTiger manages an in-memory cache that holds frequently accessed pages and in progress updates. And background eviction threads are responsible for reclaiming cache space so that new writes can proceed without getting blocked.
When eviction threads run consistently, cache pressure remains low and application threads remain unaffected. When eviction falls behind, cache grows gradually until WiredTiger uses application threads to evict pages from cache, causing reads and writes to incur eviction overhead and increasing latency.
What Are These Application Threads?
Application threads are the MongoDB worker threads that handle client read and write operations. They execute queries, apply updates, and interact with the storage engine to commit data.


Returning to cache eviction failures, the cache metrics showed a slow but steady rise in cache usage. This pattern typically indicates eviction lag rather than insufficient cache size. At the same time, eviction related metrics such as page eviction failures, usage of application threads for evictions and hazard pointer blocks increased, signaling that eviction threads were not making progress at the expected rate.
Eventually, application threads began performing eviction work. At that point, write latency increased noticeably, as eviction blocked the application write operations.
This raised a question: why weren’t eviction threads keeping up?
When CPU Metrics Lie by Omission
Looking at aggregate CPU usage did not reveal anything unusual. Overall utilization remained below saturation, and several cores showed low activity.


However, per core metrics revealed a different picture. A small number of CPU cores showed sustained high utilization, while others remained mostly idle. MongoDB threads scheduled on the busy cores accumulated CPU wait time even though unused capacity existed elsewhere on the system.
SoftIRQ and Interrupt Metrics
cat /proc/interrupts
           CPU0       CPU1       CPU2       CPU3       CPU4       CPU5       CPU6       CPU7
  0:         33          0          0          0          0          0          0          0   IO-APIC   2-edge      timer
  1:          0          0          0          0          0          0          9          0   IO-APIC   1-edge      i8042
  4:       1591          0          0          0          0          0          0          0   IO-APIC   4-edge      ttyS0
  6:          0          2          0          0          0          0          0          0   IO-APIC   6-edge      floppy
  8:          0          0          0          0          0          0          0          0   IO-APIC   8-edge      rtc0
  9:          0          1          0          0          0          0          0          0   IO-APIC   9-fasteoi   acpi
 11:          0          0          0          0          0          0          0          0   IO-APIC  11-fasteoi   virtio2
 12:          0          0          0          0          0        145          0          0   IO-APIC  12-edge      i8042
 24:          0          0          0          0          0          0          0          0   PCI-MSI 49152-edge      virtio0-config
 25:          0          0          0          0         67          0          0          0   PCI-MSI 49153-edge      virtio0-virtqueues
 26:          0          0          2          0          0          0          0          0   PCI-MSI 81920-edge      virtio1-config
 27: 1598815819          0          0          1          0          0          0          0   PCI-MSI 81921-edge      virtio1-input.0
 28:  985733575          0          0          0          1          0          0          0   PCI-MSI 81922-edge      virtio1-output.0
 29:          0  781891714          0          0          0          1          0          0   PCI-MSI 81923-edge      virtio1-input.1
 30:          0  786057519          0          0          0          0          1          0   PCI-MSI 81924-edge      virtio1-output.1
 31:          0          0 1154374536          0          0          0          0          1   PCI-MSI 81925-edge      virtio1-input.2
 32:          1          0  976270650          0          0          0          0          0   PCI-MSI 81926-edge      virtio1-output.2
 33:          0          1          0 2737393291          0          0          0          0   PCI-MSI 81927-edge      virtio1-input.3
 34:          0          0          1  811517299          0          0          0          0   PCI-MSI 81928-edge      virtio1-output.3
 35:          0          0          0          1 2268704997          0          0          0   PCI-MSI 81929-edge      virtio1-input.4
 36:          0          0          0          0  968975939          0          0          0   PCI-MSI 81930-edge      virtio1-output.4
 37:          0          0          0          0          0 3043629761          0          0   PCI-MSI 81931-edge      virtio1-input.5
 38:          0          0          0          0          0  837425340          1          0   PCI-MSI 81932-edge      virtio1-output.5
 39:          0          0          0          0          0          0 3270797477          1   PCI-MSI 81933-edge      virtio1-input.6
 40:          1          0          0          0          0          0 1008049976          0   PCI-MSI 81934-edge      virtio1-output.6
 41:          0          1          0          0          0          0          0 1957370464   PCI-MSI 81935-edge      virtio1-input.7
 42:          0          0          1          0          0          0          0  787139323   PCI-MSI 81936-edge      virtio1-output.7
 43:          0          0          0          0         13          0          0          0   PCI-MSI 65536-edge      nvme0q0
 44:          0          0          0   17497710          0          0          0          0   PCI-MSI 65537-edge      nvme0q1
 45:          0          0          0          0          0          0          0   18441522   PCI-MSI 65538-edge      nvme0q2
 46:          0          0          0         15          0          0          0          0   PCI-MSI 114688-edge      nvme1q0
 47:          0          0  974794306          0          0          0          0          0   PCI-MSI 114689-edge      nvme1q1
 48:          0          0          0          0          0          0  964469625          0   PCI-MSI 114690-edge      nvme1q2
...
...
...
Imbalance CPU utilization on a few CPU cores. Meanwhile other CPUs show negligible counts.
- virtio1-input.3–2.7B interrupts on CPU3
- virtio1-input.4–2.2B interrupts on CPU4
- virtio1-input.5–3.0B interrupts on CPU5
- virtio1-input.6–3.2B interrupts on CPU6
Each virtio input/output queue pair, for example, 27–28, 29–30, etc, shows high counts, but still skewed per CPU.
For example, virtio1-input.3 (CPU3) vs virtio1-output.3 (CPU3) both spiking together, which indicates both RX and TX softirqs are bottlenecking the same CPU threads.
NVMe interrupts (44–48)are also skewed, but much lower compared to network IRQs. This confirms that network softirq load, not disk I/O, is causing the CPU bottleneck.
cat /proc/softirqs
                    CPU0       CPU1       CPU2       CPU3       CPU4       CPU5       CPU6       CPU7
          HI:          0          0          0          0          0          0          0          0
       TIMER: 4294561051 3140431288 2975774619 3013910010 2969591807 2993951570 2944905096 2984977134
      NET_TX:       1528        829       1200       1115       1658       1673        903       1298
      NET_RX: 2148993814 1383970069 1904951097 3212264069 2891970300 3426495611 3921776767 2458244772
       BLOCK:          0          0          0         15         13          0          0          0
    IRQ_POLL:          0          0          0          0          0          0          0          0
     TASKLET:  157901749  111654374  120044652  138722871  256819607  306218733  105166936  218035717
       SCHED: 4028263025 3780209128 3155623341 3301205432 3155708517 3298799834 3139540584 3280823559
     HRTIMER:       3541        353        176      41870        696       7104       1838        175
RCU: 2232397653 2216128229 2242071434 2225580534 2234248233 2219893820 2237627090 2217149906- The system is experiencing a very high volume of receive (RX) softirqs, with billions of NET_RX events overall.
- There is a significant imbalance across CPU cores.
- TASKLET activity is also uneven, with CPU5 showing the highest usage. This is common when NIC or driver processing is involved.
- TIMER and SCHED activity are high across all cores, which is expected for a busy system. However, the most noticeable point is the high skew in NET_RX processing, indicating that network receive interrupts are processed on a few cores.
This indicates that the issue was not a lack of CPU, but where CPU time was being consumed.
Crossing the User–Kernel Space Boundary
Understanding the per-core CPU imbalance required diving deeper into the Linux kernel, beyond the database layer. And the network traffic turned out to be the missing piece.

Linux processes incoming network traffic using software interrupts, or softIRQs. After a hardware interrupt signals packet arrival, most of the processing is deferred to softIRQs to avoid blocking the interrupt handler.

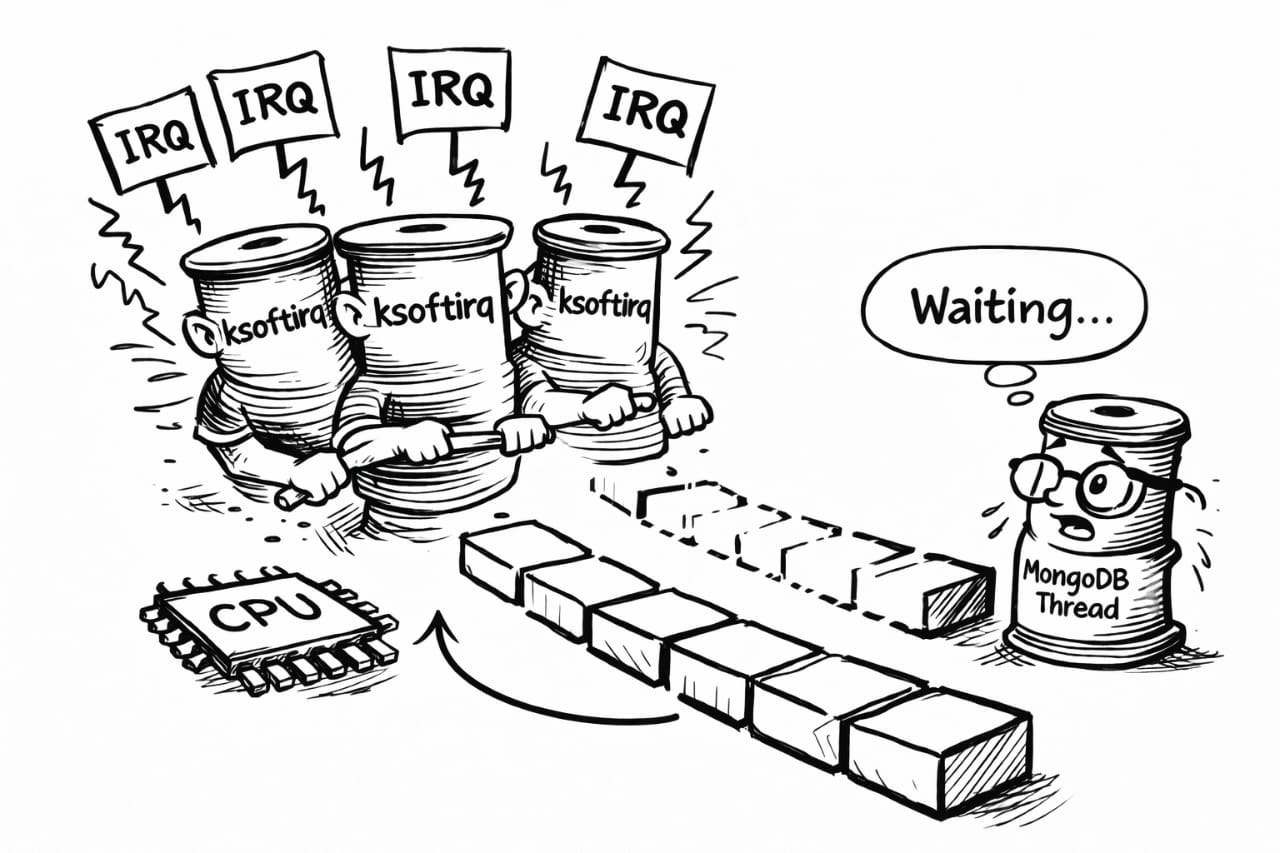
When packet volume is high or processing exceeds configured limits, softIRQ work is deferred to ksoftirqd kernel threads. These threads run in process context and compete directly with user-space applications for CPU time.
The network receive (NET_RX) softIRQ interrupts was significantly high. More importantly, the workload was unevenly distributed across CPU cores.
A Subtle Imbalance with Big Consequences
SoftIRQ metrics showed that a few CPU cores were responsible for processing the majority of network receive traffic. On those cores, ksoftirqd threads consumed a large share of CPU cycles.

MongoDB threads scheduled on the same cores were frequently preempted. Eviction and checkpoint threads, which depend on consistent scheduling to keep cache pressure under control, ran less often than required. Although other CPU cores were idle, the affected threads did not benefit from that available capacity.
This scheduling imbalance explains the earlier eviction behavior. Eviction threads were not blocked on disk or memory, they were simply not getting scheduled often enough.
Why Disk and Memory Metrics Stayed Quiet
Disk and memory metrics did not indicate stress during this period. NVMe interrupt counts were low relative to network interrupts, and disk latency remained stable. Memory usage stayed within configured bounds, and no swapping occurred.
This is what makes the problem difficult to diagnose. Traditional indicators of resource exhaustion never appear because the bottleneck exists entirely at the CPU scheduling level.
Why MongoDB Is Impacted Early
MongoDB does not dynamically rebalance background threads based on kernel-level contention. If eviction threads are consistently scheduled on CPU cores dominated by ksoftirqd, eviction work slows regardless of available capacity elsewhere.
As eviction slows, cache pressure increases. As cache pressure increases, eviction work moves into application threads. This increases write latency without any change in query patterns, disk performance, or memory usage.
From the outside, it looks like a database performance issue. In reality, MongoDB is waiting for CPU time.
Kernel and Database Tuning
Avoiding this behavior is less about tuning a database configuration and more about where execution is allowed to compete. Systems remain stable when kernel-level work and database background threads have predictable access to CPU time, and begin to degrade when that balance shifts. Addressing this boundary, rather than adjusting MongoDB or WiredTiger configuration in isolation, determines whether cache pressure accumulates gradually or is avoided. Below are some possible approaches to address this bottleneck.
IRQ Affinity and CPU Isolation
The first indication of imbalance appears at the CPU scheduling layer. When network interrupt handling and deferred softIRQ processing are allocated to a subset of CPU cores, those cores become unavailable for user-space execution, even if other cores remain underutilized.
Distributing network interrupts more evenly across cores using IRQ affinity reduces localized CPU saturation. Isolating MongoDB execution from cores that consistently handle high volumes of softIRQ processing further limits scheduling interference and allows background threads, such as eviction and checkpoint workers, to progress reliably.
SoftIRQ Budget Tuning
SoftIRQ processing has a direct impact on how CPU time is consumed under sustained network load. The Linux network stack provides controls that govern how much work is performed per scheduling cycle before execution is deferred to kernel threads. When these limits are too restrictive, softIRQ work is frequently deferred, increasing contention with user-space processes.
net.core.netdev_budget — Maximum packets processed per softIRQ run
net.core.netdev_budget_usecs — Maximum microseconds per run
net.core.netdev_max_backlog — Backlog queue length
Note: These parameters must be tuned based on the system’s workload characteristics.
Adjusting these limits helps prevent prolonged kernel execution on individual cores and improves scheduling fairness during periods of elevated network activity.
Closing Thoughts
In a write heavy database system, when usual indicators such as query execution, index usage, cache sizing, and disk or network I/O performance appear normal, yet latency begins to rise, the initial instinct is often to scale the system. Adding more nodes, increasing instance sizes, or allocating additional resources feels like the safest path forward, especially when the system is already under load.
What looked like a scaling problem turned out to be an execution problem. MongoDB was not constrained by memory or I/O bottleneck, and adding more hardware would not have resolved the uneven CPU scheduling that caused the slowdown. The database was simply waiting for CPU time that was already available elsewhere in the system.
Recognizing this distinction is important. By focusing on tuning the underlying system, it is often possible to stabilize the performance without scaling the system. Beyond improving latency and predictability, it avoids unnecessary infrastructure cost, reduces operational overhead, and makes better use of existing resources.
“Not every performance problem is a signal to scale, some are a signal to look deeper.”
In systems like this, tuning is not an optimization exercise. It is a reminder that scaling should come after understanding how the system executes, not before.
메타데이터
- post_id
- a233992a3f60
- slug
- when-mongodb-isnt-slow-it-s-starved-a-performance-mystery-a233992a3f60
- url
- https://medium.com/gojekengineering/when-mongodb-isnt-slow-it-s-starved-a-performance-mystery-a233992a3f60
- canonical_url
- https://medium.com/gojekengineering/when-mongodb-isnt-slow-it-s-starved-a-performance-mystery-a233992a3f60
- author_url
- https://medium.com/@yuvaraj.klei
- status
- ok
- fetched_at
- 2026-06-13 09:11:36