AI-Powered Lead Scoring: How SMB Teams Can Prioritize Their Way to Faster Revenue
Most SMB sales teams aren’t losing deals because of bad products or weak pitches. They’re losing because the wrong reps are calling the…
AI-Powered Lead Scoring: How SMB Teams Can Prioritize Their Way to Faster Revenue

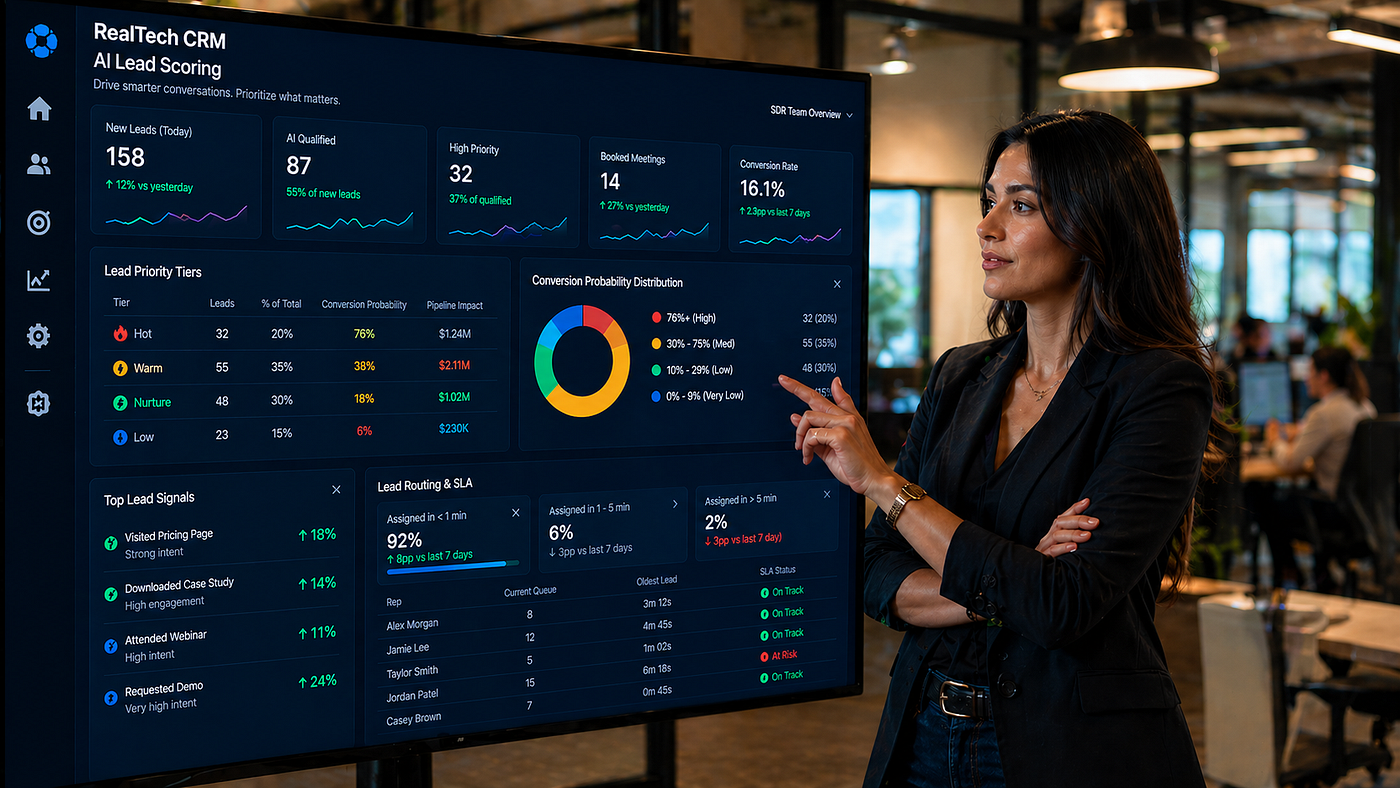
Ranked queues in action — a RevOps manager prioritizing leads by AI score rather than gut feel, inside a live CRM dashboard.
Most SMB sales teams aren’t losing deals because of bad products or weak pitches. They’re losing because the wrong reps are calling the wrong leads at the wrong time — and no one has the data to know it.
Gut feel and basic firmographics — company size, industry, job title — are how most SMB teams still decide who to call first. The result is predictable: high-intent accounts go cold while reps burn hours on leads that were never going to convert. AI-driven lead scoring fixes this at the root, ranking deals by real conversion patterns pulled from your own historical data, and recalibrating in real time as buyer behavior changes.
For SDR and BDR leaders, VP Marketing, and RevOps managers in B2B SaaS, fintech, HR tech, and IT services — here’s the practical playbook.
Why Points-Based Scoring Failed You
Before building the right system, it’s worth understanding why the old one broke. Traditional points-based scoring assigns static values to lead attributes: +10 for downloading an ebook, +20 for a demo request, -5 for a small company size. The problem is that these weights are opinions, not evidence. They’re set once by a marketing ops manager, never validated against actual conversion data, and become increasingly inaccurate as your ICP and buyer behavior evolve.
The deeper failure is that points-based scoring treats all behaviors equally regardless of context. A pricing page visit by a 500-person fintech company means something entirely different than the same visit by a two-person startup. Static rules can’t capture that nuance — ML models can.
AI lead scoring doesn’t replace human judgment. It replaces human guesswork with patterns your own closed-won data already contains.
Mining Your CRM for Patterns That Actually Predict Conversion
The first step is archaeological: go back through 12–24 months of closed-won and closed-lost data and ask what was measurably different about the deals that closed.
The Three Signal Categories to Mine
Firmographic fit signals (who they are)
- Company size range of closed-won accounts vs. closed-lost
- Industry verticals with above-average win rates
- Tech stack indicators — tools they use that complement or compete with yours
- Funding stage or growth signals for SaaS and fintech buyers
Behavioral engagement signals (what they did)
- Pages visited and in what sequence — pricing before features vs. features before pricing tells different stories
- Content consumed: ROI calculators, integration docs, and comparison pages correlate with higher intent than blog posts
- Email engagement: click patterns on product-specific content vs. thought leadership
- Webinar attendance vs. registration-only — the gap in conversion rate between these two is consistently significant
Product and trial signals (how they used it — critical for SaaS)
- Feature activation depth in the first 72 hours of a trial
- Return visit frequency during trial period
- Workflow completion — leads who complete one core workflow convert at 3–4× the rate of those who don’t
- Team expansion events: inviting a second or third user during trial is one of the strongest conversion predictors in B2B SaaS
Building the Initial Model
For SMB teams without a data science team, the practical path is:
- Export your last 18–24 months of CRM data with a closed-won / closed-lost label on each opportunity
- Tag each record with the signals above — most CRMs have this data, it just needs extracting
- Run a simple logistic regression or use a tool like HubSpot’s predictive scoring, Salesforce Einstein, or a lightweight ML layer to identify which features have the highest predictive weight
- Start with 8–12 features maximum — a clean model with the right inputs outperforms a bloated one with noise
The output isn’t a perfect score. It’s a ranked list that’s meaningfully better than the alternative, and one that improves with every new outcome you feed back in.
One critical addition: negative signals. Unsubscribes, bounced emails on critical pages, prolonged inactivity after initial engagement, and company sizes outside your serviceable market all teach the model who isn’t a fit — preventing reps from spending time on leads that look engaged but were never going to buy.
Operationalizing Scores: Getting Them Into Daily Rep Workflow
A score that lives in a dashboard nobody opens is decorative analytics. The goal is behavioral change at the point of action — which means wiring scores into the tools reps already use every day.
Ranked Queues: Replace the Flat MQL List
The highest-leverage change is replacing the chronological or manual lead list with a dynamic, score-ranked queue — what some teams call Today’s Hits.
SDRs open the CRM and see accounts ordered by predicted conversion probability, with time-sensitive behaviors surfaced at the top:
- Multiple pricing page visits in the last 24 hours
- Trial activation with feature depth above threshold
- Engagement spike after a period of silence
- Stakeholder expansion (second user invited, admin role assigned)
The queue reorders continuously as new signals arrive. No manual sorting. No end-of-day triage by a manager.
SLAs Tied to Score Tiers
Score tiers only create urgency if they’re connected to response-time expectations:

SLAs Tied to Score Tiers
Speed-to-lead on Tier A accounts should be tracked weekly and reviewed in pipeline calls. When reps see that responding within 5 minutes to a Tier A lead converts at 3× the rate of a 2-hour response, the behavior change becomes self-reinforcing.
Automated Follow-Up Sequences by Score Band
Each tier should have a pre-built sequence that fires automatically when a lead is assigned:
- Tier A: 8-step, 12-day high-velocity sequence with calls, personalized emails, and a direct booking link
- Tier B: 6-step, 18-day standard sequence with email-first, call at day 5
- Tier C: Automated nurture with a single SDR review trigger at day 14 if engagement score rises
AI agents handle drafting and sending follow-ups, logging responses, and escalating to a human when a reply contains a buying signal or objection that requires judgment. Reps stay in conversations — agents handle everything that requires consistency rather than nuance.
Score Visibility Inside the CRM Record
Every lead record should show:
- The score prominently — not buried in a sub-tab
- The score breakdown: which signals drove it up or down (e.g., “Pricing page visited 3×: +18 points. Company size below ICP threshold: -12 points”)
- Score change alerts: when a lead moves from Tier C to Tier A within 48 hours, the assigned SDR gets a CRM notification immediately
This transparency is what converts skeptical reps into advocates. When a rep can see why a score changed, they trust it enough to act on it — and when they act on it and it converts, the system earns permanent buy-in.
Measuring Impact: The Three Metrics That Matter
1. Lead-to-Opportunity Conversion Rate
This is the primary proof point. Baseline it before launch by score tier, not in aggregate. After 60–90 days:
- Compare Tier A conversion rate vs. pre-scoring conversion rate for your top-quartile leads
- Compare against your control group if you ran an A/B test
- Target benchmark: ML-based scoring consistently delivers materially higher conversion rates than rule-based systems, with top-performing SMB teams reaching approximately 6% lead-to-opportunity conversion versus a ~3.2% B2B average
2. Sales Velocity
Track the formula: (Number of Opportunities × Average Deal Value × Win Rate) ÷ Sales Cycle Length
AI scoring improves all four variables simultaneously:
- More qualified opportunities entering the funnel (better top-of-funnel filtering)
- Higher win rates on scored leads (better ICP fit)
- Shorter sales cycles (faster response to high-intent signals)
Measure cycle length separately for Tier A vs. Tier B vs. unscored leads. The difference will be your clearest internal proof of concept.
3. Rep Capacity and Activity Quality
Track what reps are doing with the time scoring frees up:
- Calls made per rep per day on Tier A vs. pre-scoring period
- Ratio of discovery calls to demo calls (a higher ratio indicates better early qualification)
- Override rate: how often are reps manually reclassifying scores? Consistent overrides in a specific lead type signal a model gap — and a retraining opportunity
The leading indicator in the first 30 days isn’t conversion rate — it’s response time on Tier A leads. If that number isn’t above 80% compliance within SLA, fix the workflow before tuning the model.
The Retraining Loop: How the Model Gets Smarter
A scoring model isn’t a launch — it’s a living system. Quarterly retraining with fresh closed-won and closed-lost data keeps accuracy from drifting as buyer behavior evolves.
The minimum viable feedback loop:
- Every closed-won and closed-lost opportunity writes back to the training dataset automatically with its score at time of creation
- RevOps reviews rep override patterns monthly — consistent overrides in a specific segment reveal features the model is missing
- Score thresholds are reviewed quarterly against actual conversion outcomes by tier
- When a new product feature launches or a new ICP segment is added, trigger an immediate model refresh with segment-specific historical data
Teams that run this loop see compounding accuracy improvements. The model that was 70% predictive at launch routinely reaches 85–90% within two quarters when retraining is systematic.
What to Do First This Week
The fastest path to value isn’t buying a new tool. It’s using data you already have:
- Pull your last 18 months of closed-won and closed-lost opportunities from your CRM with all available fields
- Identify the top 5 behavioral signals that appear most consistently in closed-won deals but not in closed-lost
- Build a manual Tier A/B/C segmentation based on those 5 signals — this is your v0 scoring model, no ML required
- Wire Tier A into a fast-response SLA (< 1 hour, manual at first) and track conversion for 30 days
- Use those 30 days of outcome data as the foundation for your first ML model training run
The goal isn’t perfection on day one. It’s a ranked list that’s meaningfully better than the flat queue — and a feedback loop that makes it smarter every quarter.
The SMB teams winning on pipeline efficiency aren’t outprospecting competitors. They’re outprioritizing them — with models trained on their own data and workflows that make the right action the default.
Ready to wire AI scoring into your CRM and start moving pipeline? Let’s build it →
⇢ For more like this, join our Telegram channel → https://t.me/howdyanalytics
메타데이터
- post_id
- a43bca99a48d
- slug
- ai-powered-lead-scoring-how-smb-teams-can-prioritize-their-way-to-faster-revenue-a43bca99a48d
- url
- https://medium.com/@deepaksethionly/ai-powered-lead-scoring-how-smb-teams-can-prioritize-their-way-to-faster-revenue-a43bca99a48d
- canonical_url
- https://medium.com/@deepaksethionly/ai-powered-lead-scoring-how-smb-teams-can-prioritize-their-way-to-faster-revenue-a43bca99a48d
- author_url
- https://medium.com/@deepaksethionly
- status
- ok
- fetched_at
- 2026-06-09 15:37:30