One Run Is an Anecdote. Five Runs Are Evidence.
SmartWrapperOSS now reports mean ± std dev with 95% confidence intervals. What shipped, and what the error bars found on day one.
One Run Is an Anecdote. Five Runs Are Evidence.
- SmartWrapperOSS now reports mean ± std dev with 95% confidence intervals. What shipped, and what the error bars found on day one.
- From PRD → Product Release | A Technical PM’s lessons building AI in production.
SmartWrapperOSS is an open-source eval framework: run the same task through multiple orchestration frameworks (AutoGen-style, LangGraph-style) and multiple models (GPT-4o, Claude, Gemini), and compare quality, latency, and cost side by side, in one command.
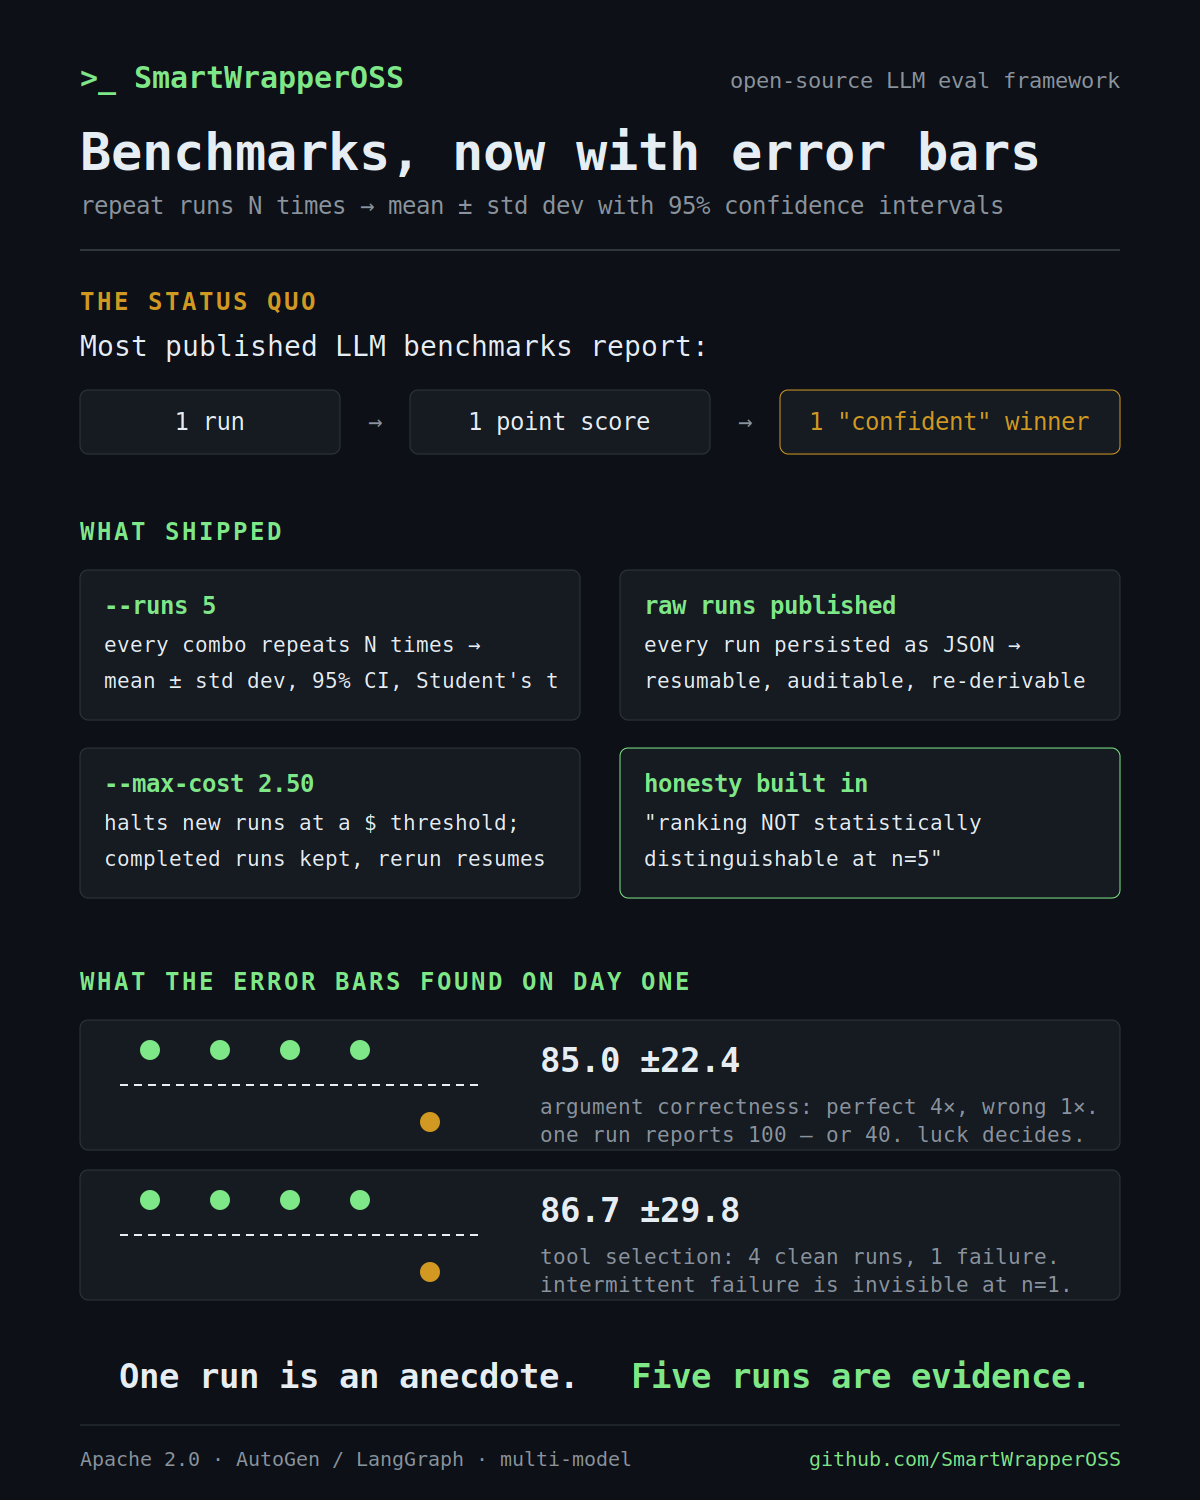
This release adds multi-run statistics. With one flag — — runs 5 — every (framework, model) combination repeats N times, and the comparison table reports mean ± std dev with 95% confidence intervals instead of a single number.
What shipped
1. Repeated runs with proper statistics. Confidence intervals use the Student’s t-distribution, which matters at realistic run counts (n=3–10, given API costs). Latency is reported as median/p95 rather than mean, because one slow API call shouldn’t skew a cell.
2. Raw runs, persisted and published. Every run is written to disk as JSON the moment it’s scored — full output, token counts, latency, cost, scores. This makes benchmarks resumable (a crash at run 4 of 5 never re-pays for runs 1–3), incremental (— runs 3 today, — runs 10 next week just adds seven), and auditable: the raw records are committed in the repo, so anyone can re-derive every published number.
3. Cost controls. Multi-run multiplies API spend, so — max-cost halts new runs at a dollar threshold. Completed runs are kept; rerun to resume.
4. Honest verdicts. When the top two combinations have overlapping confidence intervals, the tool prints: ”this ranking is NOT statistically distinguishable at n=5.” It refuses to declare a winner the data doesn’t support.
What the error bars showed
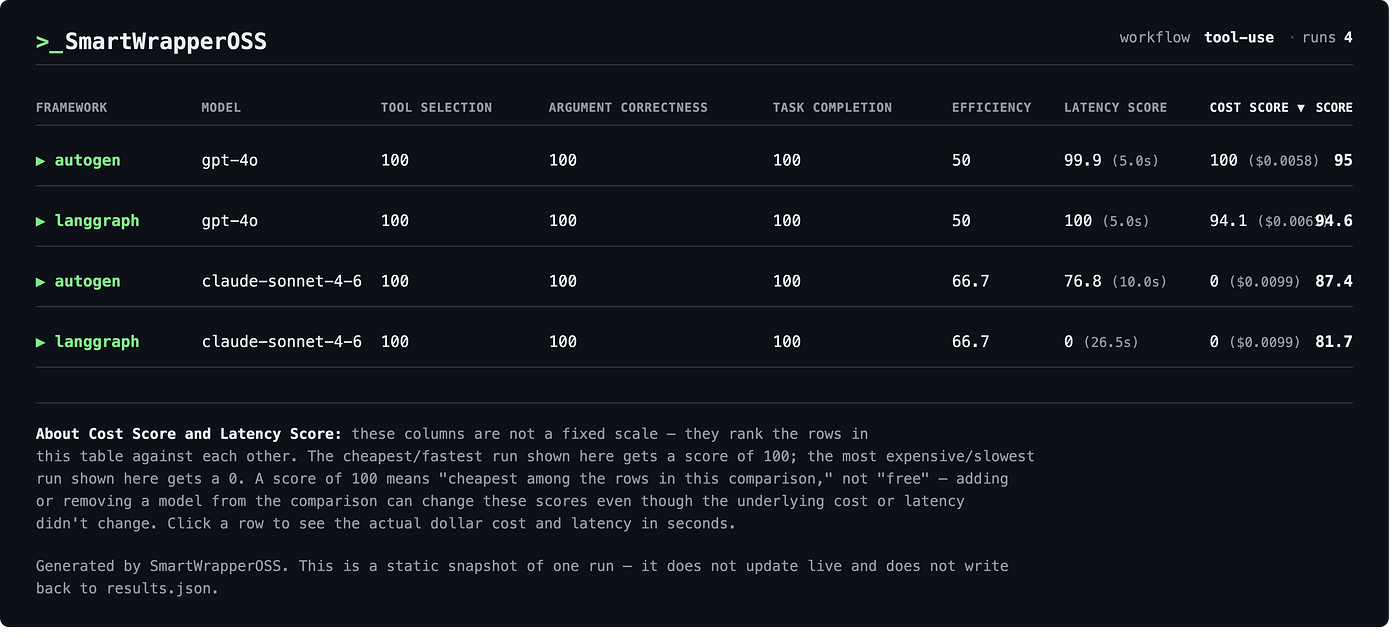
Running the benchmarks at n=5:
-
One combination scored 85.0 ±22.4 on argument correctness — perfect in four runs, badly wrong in one. Any single observation would show 100, or 40, depending on which run you caught.
-
Another showed 86.7 ±29.8 on tool selection — four clean runs, one outright failure. Intermittent behavior only becomes a measurement once you repeat.
-
In the summarization benchmark, the composite leader was not the best at everything: claude-sonnet-4–6 ranked near the bottom on composite (driven by latency and cost) yet won conciseness by 20+ points with near-zero variance. Which row is “best” depends on what your task actually needs.
Benchmarks, now with error bars.
Why this matters for product managers
Picking a model and framework is usually treated as a purely technical decision — but its consequences (quality, latency, cost) are product consequences, and this gives PMs the evidence to weigh in credibly.
Variance is a risk metric means alone hide: 85.0 ±22.4 is a feature that shines in the demo and fails intermittently in production — visible before launch, not after. The composite winner isn’t automatically your winner: which dimension matters — conciseness, latency, cost — is a requirements question, and weighting it is the PRD. And mean cost per run × projected volume is your margin conversation, while p95 latency is the UX your users actually remember.
The interactive error-bar dashboards, raw run records, and code are in the repo. Run it against your own tasks — that’s what it’s for.
DISCLAIMER
Opinions expressed are solely my own in a personal capacity and do not represent the views, policies, or positions of any current or former employer, or their affiliates.
I have no affiliations with OpenAI, Anthropic, or Google. Scores shown are from a fixed benchmark task at n=5 and are directional signals, not ground truth — see the project README for the full methodology and limitations. Verify current model pricing against your provider’s documentation.
메타데이터
- post_id
- a4bf681a78fb
- slug
- one-run-is-an-anecdote-five-runs-are-evidence-a4bf681a78fb
- url
- https://medium.com/from-prd-pr-product-release/one-run-is-an-anecdote-five-runs-are-evidence-a4bf681a78fb
- canonical_url
- https://medium.com/from-prd-pr-product-release/one-run-is-an-anecdote-five-runs-are-evidence-a4bf681a78fb
- author_url
- https://medium.com/@aditijain4151
- status
- ok
- fetched_at
- 2026-07-09 00:50:33