How The NHL & AWS Measure Momentum With NHL Edge IQ
Ice Tilt helps crack the code on how action on the ice translates to momentum shifts within the game
How The NHL & AWS Measure Momentum With NHL Edge IQ
Ice Tilt helps crack the code on how action on the ice translates to momentum shifts within the game

Hockey has always been one of the hardest sports to measure in real time.
Goals, shots, saves, faceoff wins, and penalties are easy to count.
But things like momentum and control, what team has the winning edge?
The moment one team is gaining momentum and rythym, is much harder to calculate.
That has always been more of a human feeling or vibe.
Fans can feel it. Coaches can see it. Broadcasters can talk about it.
But until recently, it was difficult to turn that feeling into a clear, data-driven metric.
NHL EDGE IQ Ice Tilt
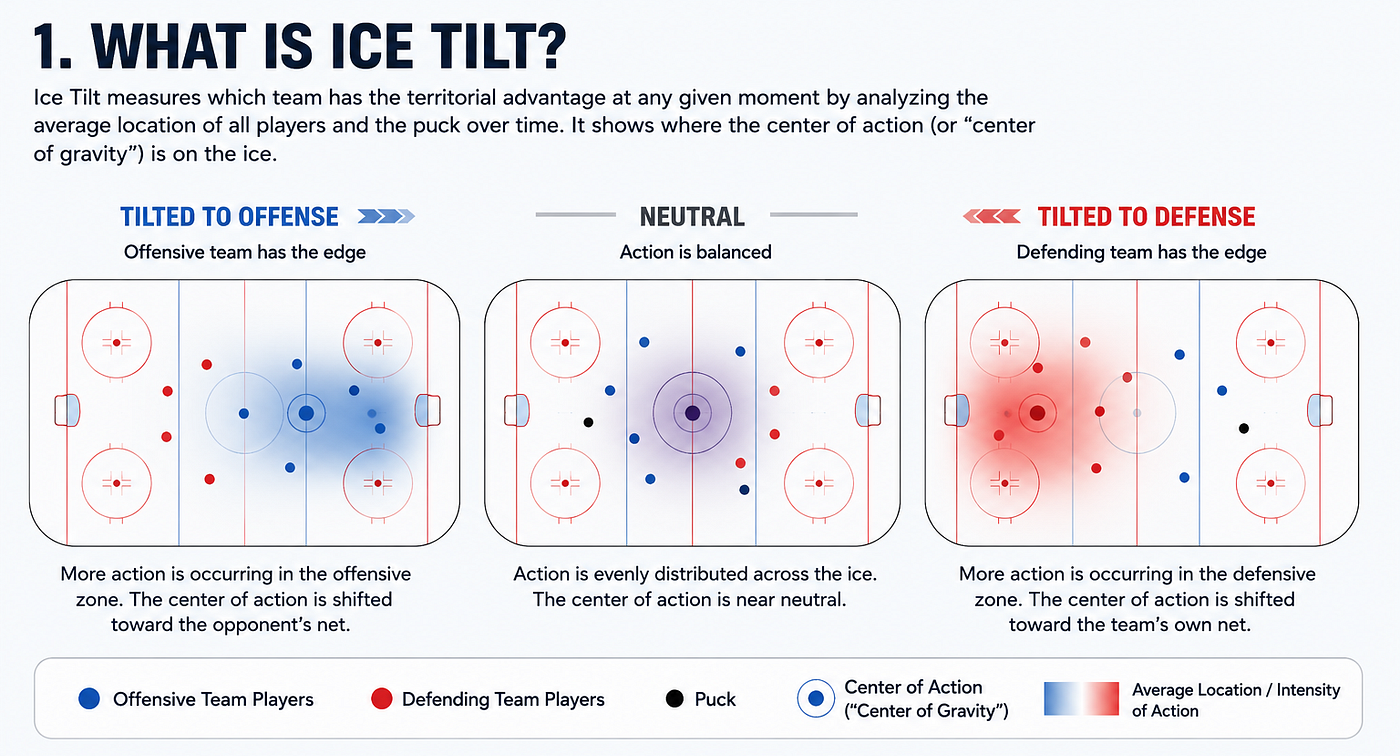
That is what the NHL and AWS are trying to solve with NHL EDGE IQ Ice Tilt, a new real-time statistic designed to show which team has the territorial advantage during a game.
Ice Tilt is built around a simple but powerful idea:
The team controlling the game is usually spending more time in the opponent’s end of the ice. If the puck, skaters, and overall flow of play are consistently closer to one team’s goal, the ice is “tilted” in favor of the attacking team.
Instead of only measuring who has the puck, Ice Tilt looks at where the action is happening.
That distinction matters.
A team might technically have possession, but if they are stuck in their own zone, under pressure, and unable to break out, they are not really controlling the game.
Traditional puck-based metrics like possession or zone time can tell part of the story, but they do not always capture the bigger picture of territorial control and momentum.
Ice Tilt takes this further by analyzing the average location of players and the puck over time. During an NHL game, the NHL EDGE Puck and Player Tracking system captures positional data from every player on the ice and the puck at 100Hz. With five skaters, one goalie per team, and the puck, that creates around 3,600 data points per second for a single game.
Over one period, that becomes nearly 13 million data points.
AWS processes this stream of data alongside game event data such as clock stoppages, line changes, and power plays. The system then calculates a rolling average over two-minute windows to show where the “center of gravity” of the game is moving.
The result is a near real-time view of which team has the edge, and by how much.
This becomes especially interesting when connected to game events.
For example, when a team goes on a power play, you would expect the ice to tilt in their favor. But what happens if the opposing team successfully kills the penalty? Does the momentum shift back? Does the team that killed the penalty suddenly gain energy? Ice Tilt can help identify those turning points and give broadcasters, analysts, and teams a clearer way to explain them.
Architecture Under The Hood
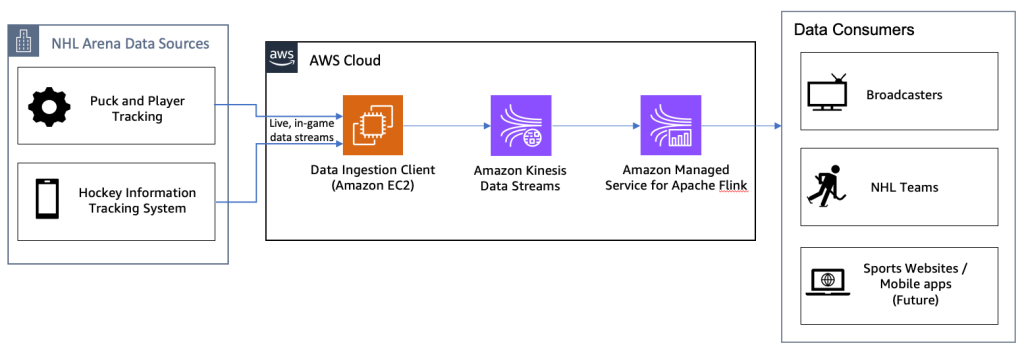
Under the hood, the architecture is a real-time streaming system.
Data from NHL arenas is sent through the NHL’s OASIS Platform into AWS.
From there, Amazon EC2 ingests the data and places it onto Amazon Kinesis Data Streams. Amazon Managed Service for Apache Flink processes the live stream and calculates the Ice Tilt value. The final results are then sent back to downstream systems, including broadcasters, and stored in Amazon S3 for long-term analytics.
This architecture is designed for speed.
That is critical because hockey moves fast. Players can skate over 20 miles per hour, the puck can travel around 100 miles per hour, and multiple NHL games can happen at the same time across different arenas. The Ice Tilt system has to ingest, process, calculate, and distribute results in seconds, while handling up to 16 simultaneous games.
According to AWS, the system can compute and deliver Ice Tilt with less than one second of processing latency, while the full data loop can complete in under three seconds.
That speed is what makes the metric useful for live broadcasts.
If the stat arrived minutes later, it would only be useful for post-game analysis. But because it is calculated in near real time, Ice Tilt can power live graphics, commentary, and storytelling during the game itself.
The bigger opportunity is what comes next.
The use cases of Ice Tilt
Today, Ice Tilt is based on a logic-driven calculation. But because the data is archived in Amazon S3, it can later be used for deeper analysis and machine learning.
Over time, the NHL could use this data to understand not just when momentum changed, but why it changed, and potentially even predict when it is about to change.
That is what makes Ice Tilt more than just another sports stat.
It is a good example of how real-time data, streaming architecture, and cloud analytics can turn something that used to be mostly instinctive into something measurable.
For fans, it can make broadcasts more insightful.
For teams, it can support better strategy and preparation.
And for the NHL, it creates a new way to explain one of hockey’s most exciting but hardest-to-define concepts: momentum.
👋 My name is Uriel Bitton and I’m committed to helping you master AWS, serverless and DynamoDB.
🚀 Join the waitlist for Dynasight.app — a new DynamoDB FinOps experience.
☕️ Need help with DynamoDB? Book a 1:1 with me here.
Thanks for reading and see you in the next one!
References
- “AWS and NHL unveil new NHL EDGE IQ Ice Tilt metric to help measure momentum during the game”. Ari Entin. Dec 29, 2023. https://aws.amazon.com/blogs/media/aws-and-nhl-unveil-new-ice-tilt-stat-to-measure-team-momentum-during-the-game/
메타데이터
- post_id
- a4e2edc85278
- slug
- how-the-nhl-aws-measure-momentum-with-nhl-edge-iq-a4e2edc85278
- url
- https://medium.com/tech-odyssey/how-the-nhl-aws-measure-momentum-with-nhl-edge-iq-a4e2edc85278
- canonical_url
- https://medium.com/tech-odyssey/how-the-nhl-aws-measure-momentum-with-nhl-edge-iq-a4e2edc85278
- author_url
- https://medium.com/@atomicsdigital
- status
- ok
- fetched_at
- 2026-06-09 15:37:30