Cracking the Budget #2: The Central Office Grew. Cutting It Won’t Save Us.
SPS added 269 district-office FTE since 2014 — but strip out the recodes and restricted funding and only about 48 FTE are worth examining…
Cracking the Budget #2: The Central Office Grew. Cutting It Helps But It Won’t Save Us.
SPS added 269 district-office FTE since 2014 — but strip out the recodes and restricted funding and only about 48 FTE are worth examining, worth $7.8M–$13.4M against a $23.7M deficit.
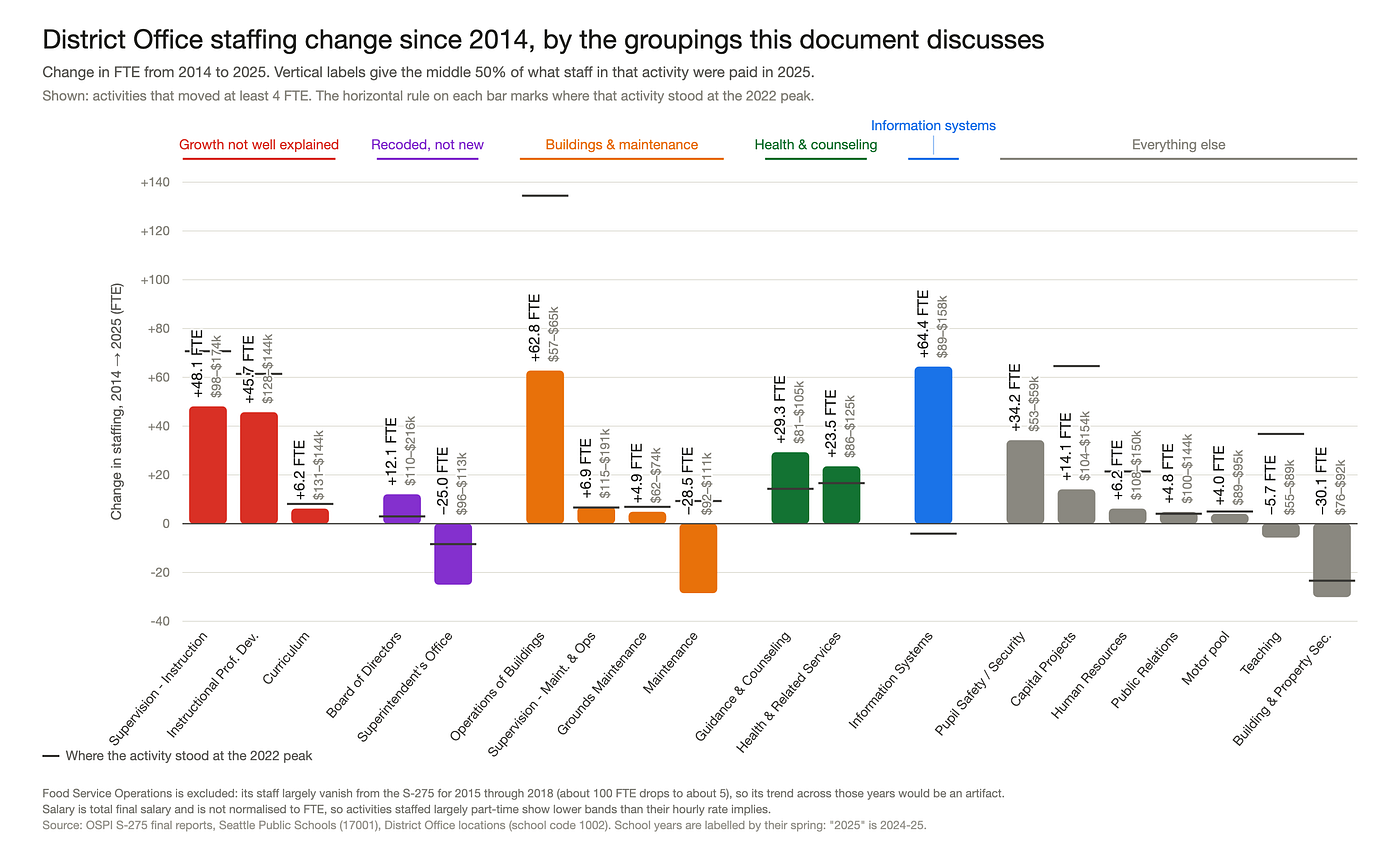
District office FTE change since 2014 by activity: growth concentrated in building ops, supervision and instructional support.
Seattle Public Schools is in a multi-year budget crisis: the district ran a $23.7M general-fund deficit in 2024–25, has debated school closures, and is now restructuring its central office. A recurring question in every budget conversation is whether the central office grew, by how much, and whether cutting it back would fix the deficit. This article digs into the state’s S-275 personnel data to answer that question with actual numbers. This is the second post in the Cracking the Budget series. (First was Chronic Underspend).
Summary
In 2014, SPS served almost exactly the same number of students as it does today — about 48,500 K-12 FTE in both years — in roughly the same number of school buildings. However, when comparing staffing with 2025, the current “District Office / Centrally Managed” staffing is 269 FTE higher than in 2014. The increases have a concentration of unexplained growth in a few activities such as Supervision — Instruction (this does NOT include Principals), Instructional Professional Development, and Operations of Buildings (a part of the Operations org). This does not mean we can actually remove 269 people, or that removing 269 people would result in 269 people’s compensation worth of reduction in the deficit. Not every position should be removed, and once you sift out the recodes, the restricted funding, and the services we want anyway, only about 48 FTE obviously look like they could be examined — which would only shrink the deficit by about $7.8M to $13.4M. Far less than the 2024–25 deficit of $23.7M, and definitely far less than future deficits, since insurance alone just jumped by a few million this year.
We cannot achieve solvency by reducing staffing in the District Office alone. We definitely cannot get to the point of adding more funding to any other buckets via cuts here. The math, so far, does not work out.
How do you go from 269 FTE of growth to just 48 worth examining?
Before continuing, I want to call out that this post is specifically going to highlight potential for cuts and that any such cut means a person’s job or career. There are real humans behind the numbers that we will now discuss in abstract. Please be respectful of that, always.
The picture is not nearly as simple as “we bloated by 269 FTE and that’s causing us to have a deficit.” And it definitely is not as simple as “let’s just cut ourselves back to 2014 staffing numbers.”
First, we need to recognize that there are teams that have experienced continual cuts since 2022 and will find the idea of “growth” hard to swallow. That is understandable as 2022 was the peak in District Office/Centrally Managed staff. From 2022 to 2025, we shed 181 FTE — quite a lot of lives and departments disrupted. However that still leaves us with 269 FTE more when compared to 2014.

District office FTE rises from 1,393 in 2014 to a 1,842 peak in 2022, then falls to 1,661 in 2025 — still 269 above 2014.
Next, not all “growth” contributes to the deficit. Some growth in the top-level chart is just recoding positions to different buckets and not real changes. Others use restricted funds or grants that cannot be repurposed to other activities or positions. Focusing such changes won’t have a deficit impact for the Operating Budget. Examples of this would be the Information Systems “growth” (mostly recoding) and the grant-funded positions such as the 400k a year sub-grant from Alliance for Education funding the Office of African American Male Achievement.

Excerpt from June 30, 2026 SPS Active Grants Inventory showing Alliance for Education’s 400k yearly funding of the Office of African American Male Achievement.
Lastly, and most importantly, growth in staffing isn’t intrinsically bad. We don’t know which parts of the 2014 configuration were underfunded and really needed to grow. There are also services we likely want to provide regardless of the extra cost. A prime example of this kind of growth is staffing in the Guidance & Counseling and Health & Related Services activities.
Overall though, we should examine the growth in Supervision — Instruction as well as Instructional Professional Development staffing. Then we should understand how the impacts of these structural staffing changes from the last decade line up with the future expenditure — especially if the funding for the program is not guaranteed — leading them to draw from the same shared money pool as every other service in the district that isn’t fully funded.
Which orgs saw the most growth since 2014?
This is a hard question to answer, because the OSPI S-275 staffing data does not give enough information to reliably work our way back to a department. This is really a major failure in the budget book and district transparency. In 2002–2003 budget book, the district used to provide departmental org charts with breakdowns of FTE + salary, and we should go back to that.

Example of Staffing breakdown by org chart from the 2002–2003 budget book page 87.
I’d even be okay with just the department summary numbers that existed in the budget book until 2014–15, before they were removed under Superintendent Larry Nyland (see “How did we miss this” from the original The 31% No One Talks About article). They looked like this:

Example of Central Budgets Staffing Summary from 2013–2014 budget book page 41
Pairing the fact that Nyland allowed a change that caused over a decade with no transparency about District Office / Centrally Managed growth with the fact that he was one of the originators of Student Outcomes Focused Governance, makes him involved in two of the things that most damaged fiscal governance for SPS.
However, not all is lost. At a coarse-grained level, the combination of Program, Activity, and Duty Title can aaaalmost identify a section of the org chart.
Parent Esther Stifano spent over a month manually combing through a PRR’ed 2023 Central Office staff list (a large subset of the “District Office / Centrally Managed” set) and tabulating about 1,750 reporting and department relations — a 1,021-row roster covering roughly 930 named central-office staff. From that, I was able to fuzzily match the names of most of the employees (about 84%) to corresponding S-275 records, which then lets us map orgs back to sets of (Program, Activity, Duty-title) combos.
Using this mapping we can infer the following with — with medium confidence:
The growth concentrates almost entirely under the Chief Academics Office with much under the Academics department. Of the Supervision — Instruction FTE we can attribute to an org, roughly three-quarters sits under Academics — and for Instructional Professional Development, nearly all of it does. Accountability, Operations, and HR each hold only small slices.
A big chunk of Instructional Professional Development (IPD) can’t be attributed at all. About two-thirds of the Instructional Professional Development FTE belongs to part-time, itinerant instructional-support staff who don’t appear anywhere in the PRR’ed Central Office staff list.
Here’s the org chart for reference.

PRR’ed SPS org chart, Aug 2024: board and superintendent above branches for Academics, Operations, HR, Public Affairs and more.
Also, how ridiculous is it that we had to PRR a staff list now when a quarter century ago, we apparently had the technology and know-how to print it on each budget book along with a bunch of 3D Excel pie-charts.
Which orgs saw the most cuts since 2022?
Contrastingly, while there have been some cuts in all of those orgs since 2022, most of the largest cuts landed under Fred Podesta’s operations org.
Here is a chart for which activities have been most targeted by reductions.

District office cuts since 2022 concentrated in building operations, capital projects, teaching and maintenance.
As you can see, almost all reductions have happened in Building Operations, Capital Projects, Teaching, and Maintenance. The Capital Projects line is not really a reduction, though: most of those staff were recoded into Information Systems in 2025 rather than cut, as covered in the next section.
Operations org grew a lot into 2022 but over the past 3 years most cuts have concentrated there and it is now closeish to 2014 levels.
In contrast, while there have been sizable reductions to Supervision — Instruction and Instructional Professional Development totaling 38 FTE, they still end with 94 FTE more in those roles for supporting the same number of students as in 2014. As the next section shows, only about 4 FTE of that gap is reclassification.
Which changes are just recoding?
Some of the movement in these charts is the district giving the same people a different OSPI activity code rather than hiring or cutting anyone. The two can be told apart because the S-275 lets us track individuals. Recodes show up as the same individuals appearing under a new code the following year. Three are large enough to matter, and two things that look like recodes turn out not to be.
Capital Projects into Information Systems, 2025
The largest one in the series. 72 people moved directly from the capital projects fund into Information Systems between 2024 and 2025 (“moved directly” here means the person’s largest District Office assignment changed from capital projects to Information Systems), and counting everyone, 96 of the 105 people in Information Systems in 2025 had been in capital projects the year before. Capital projects staffing fell 74 FTE and Information Systems rose 75 FTE in the same year. Essentially nobody was hired.
Superintendent’s Office into Board of Directors, 2025
9 people and 9 FTE moved in 2025, and 11 people and 11 FTE across the whole period. Board of Directors goes from 1 FTE in 2014 to 13 in 2025, and almost all of that +12 FTE is those people.
The safety and security chain, 2016 to 2024
There are three separate moves spread over a decade. This is why no single activity in this area has a readable trend. In 2016, Building and Property Security into Pupil Management and Safety: 37 people, 29 FTE. In 2021 and 2022, a round trip between Pupil Management and Safety and Operations of Buildings: 28 people (22 FTE) out and 26 people (20 FTE) back. In 2024, Pupil Management and Safety into the newly used Pupil Safety / Security code: 22 people, 17 FTE. This is why Building and Property Security shows −30 FTE since 2014 while Pupil Safety / Security appears from nothing at 34 FTE. Taken as one whole group, those three activities are close to flat: 60 FTE in 2014 against 64 in 2025.
Two that look like recodes but are not
Maintenance into Operations of Buildings. There is almost no movement between these two codes. Roughly 10 FTE moved one way over twelve years and then 8 FTE moved back, each move one to three people at a time. The −29 FTE in Maintenance and the +63 FTE in Operations of Buildings are real staffing changes, not relabelling. They likely describe a structural change to outsource trades-people, so the staffing savings there probably moved into a Purchased Services line item.
Superintendent’s Office into Supervision — Instruction. Over the past twelve years, only 4 people accounting for 4 FTE moved.
While the Superintendent’s Office does shed 25 FTE between 2014 and 2025, the Board of Directors is the only activity that received any concentration of this staff. The rest is a long tail of one- and two-person moves: Supervision — Maintenance & Operations (5), Supervision — Instruction (4), Human Resources (4), Public Relations (3).
This means that if the Superintendent’s Office contributes only about 4 FTE to Supervision — Instruction, then subtracting a Superintendent’s Office reclassification does not explain away its growth.
Supervision — Instruction grew in three steps — 2016 (+26), 2018 (+20) and 2021 (+18) — and in each of those years the people newly appearing under the code split between transfers/recodes from elsewhere in the district office (13, 15 and 12 FTE) and people entirely new to SPS (16, 14 and 21 FTE) — roughly even in 2016 and 2018, tilted toward new hires in 2021 — plus a few FTE each step transferring in from SPS schools.
The transfers/recodes come from many small sources rather than one department, the largest single ones being Instructional Professional Development in 2016 (8 FTE) and Teaching in 2018 (9 FTE).
Can we dig deeper into Supervision — Instruction and Instructional Professional Development?
A little!
Each staffing “assignment” in the S-275 is tagged with its program, activity, duty-title, and “building” (aka school). We’ve already locked in building (District Office) and narrowed to two activities. We can next break that apart by both Program and Duty Title within the programs.
Supervision — Instruction
This activity went up +48 FTE, from 76 FTE in 2014 to 124 in 2025. The chart below puts the programs down the left, with the 2014 bar above the 2025 bar for each, and colors every bar by duty title.

Supervision-Instruction grew 76 to 124 FTE, mostly in unrestricted Basic Education and in senior roles. Remember, Supervision — Instruction does NOT include principals.
Two things stand out.
Most of the growth is in Basic Education, which went from 31 FTE to 64. That is unrestricted money, and it is about 33 of the 48 FTE added.
The growth skews senior: Director or Supervisor went from 7 FTE to 20 and Professional from 14 to 39, while Office or Clerical added only 5. It’s unclear what “Professional” means, but this is worth investigating.
The rest comes from more explainable categories. Head Start appears from nothing at 8 FTE, Learning Assistance goes from 1 to 6 and Highly Capable from 2 to 5. This is partly offset by declines in Vocational Basic and Other Title Grants.
Instructional Professional Development
This activity — Instructional Professional Development, or IPD from here on — went up +46 FTE, from 29 FTE in 2014 to 75 in 2025. While the total delta is similar to Supervision — Instruction, it breaks down completely differently.

IPD grew 29 to 75 FTE, almost entirely one duty code and mostly on restricted categorical funding.
For IPD, the duty title tells us almost nothing here as nearly every bar in the chart is a single color: Other Support Personnel. This amount went from 26 FTE to 74 FTE. Our inability to understand what this 48 FTE does at all is a direct result of the removal of staffing breakdown from the budget book. More on budget book discrepancy (again) later.
But going back to IPD, unlike Supervision — Instruction, most of the growth is areas other than Basic Education.
- Basic Education goes only from 7 FTE to 22, about 15 of the 46 added.
- ESEA Disadvantaged from 2 to 12
- Special Education Supplemental Federal from 0 to 10
- Learning Assistance from 2 to 11
- Other Title Grants falls from 15 to 6
That last move looks like grant money shifting between ESEA lines rather than anything new.
How do these two areas impact the deficit?
Put the two together and of the roughly 94 FTE these activities added since 2014, about 48 FTE sit in Basic Education and about 46 FTE in restricted programs.
Staff coded to Basic Education come from more fungible resources, so they should be examined first. Staff coded to a restricted revenue stream likely cannot be removed as easily without a high risk of changing service delivery to a vulnerable population.
Whether or not any removals here actually result in a deficit impact will depend on whether the upstream program is currently fully funded or underfunded (hint: they are all underfunded to some degree) and whether, in each case, the removal releases funds that can be redistributed in a way that lowers the drawdown of the general fund.
This is a hard question that we do not have enough info on in the public to evaluate. But because removal of a staff that is funded by restricted revenue might just mean that the revenue cannot be used — or worse is just removed — means we can scope the savings down to 48 FTE of positions which translates to a deficit shrinkage $7.8M to $13.4M (33% to 57% of the $23.7M deficit for that year) at best.
Can you show your work?
I love that you always ask that. It never gets old.
The range was calculated by examining the reported Total Final Salary of 48 FTE of Basic Education growth since 2014 across both activities. Note that this growth is a net change in headcount rather than an identifiable list of people, so there is no single set of positions to price. What can be priced is removing 48 FTE from the 87 FTE now coded to Basic Education, or 94 FTE from the 199 FTE these two activities hold in total, and in each case the low and high ends are the cheapest and the most expensive way to do that. The total range from $6.3M to $10.7M of salary depending on which end is removed. Adding 25% for benefits (we haven’t figured out how to calculate it exactly from public data) gives you the possible savings.
The width of the range is entirely a question of which positions go. Supervision — Instruction Basic Education staff run from about $70k to over $250k per FTE, so the same 33 FTE is worth $3.8M or $8.0M depending on the choice. The spread for the 15 FTE of Basic Education growth in Instructional Professional Development is nearly flat: about $2.5M the low end to $2.8M on the high end. (Each figure is independently rounded so the pieces won’t sum up exactly to the totals above.)
This is not enough to cover the deficit. We might be able to get to full 2024–25 deficit coverage (this is before the multi-million dollar insurance hikes that just occurred this year) if we reduced all 94 FTE that is above 2014. But that seems very unlikely since half of those staff will come from restricted funds and as stated before, the revenue might reduce with the expense. But for completeness, here is a chart of both:

Cutting 48 FTE saves $7.8M–$13.4M against a $23.7M deficit; even all 94 FTE only reaches $15.7M–$25.1M.
Wait a minute, I pulled the s275, redid the numbers, and they really don’t match the budget book. What gives!
Ah ha ha ha. HAHAHAHA. Ha. …hah. I hate my life.
This is back again to Nyland removing the staffing data from the budget book. First, as stated in Cracking the Budget #1: Chronic Underspend, because SPS’s actuals vary so widely from the budget, you CANNOT compare numbers across the two safely without a lot of work. The s275 columns we use are (mostly) in Actual Dollars and FTE. The budget book is ₿udget Dollars. And the F195 has ₿udget FTE.
To visualize the problem, here is a graph of the budgeted versus actual allocations for the activities in question.

Budgeted FTE sits at or above actual FTE in both activities every year, with the gap widening to 18 and 28 FTE. Remember: open head count can by itself drive us into binding conditions so the growing gap is bad.
Second, the S-275 is a very error-ridden file that represents a snapshot of the HIRED staff on October 1st of any given year. If staff are fired later, they are still there. If they are hired later, they are not added for the year. The file is created mostly by the HR department. Many fields (e.g., insurance and benefits) are just estimates that are averages across some subpopulation, repeated. The “total final salary” column is the only really reliable column for compensation, but it only includes salary and does not break it down between base contract, supplemental contract, etc. This column is provided by payroll and should match the F-196 if cross-referenced by Program and Object — which, of course, it doesn’t. Some errors are very large: for example, nearly all Food Service workers vanish from the file for 2015 through 2018. It took me literal months to distill a logical schema for it. I hate this file with a passion.
That the budget book lacks breakdowns for the staffing in the area that needs the most oversight — along with other issues, like Program, Activity, and Object being presented only as independent roll-ups instead of the intersecting data-cube they were designed to be — points at a strong need to redesign the budget book. As is, it provides too little info about things we need to understand (central office staffing; Program-Activity-Object as a data-cube like the F-195 presents), far too much info on things we already know (school allocations), and roll-ups without detailed breakdowns that create misunderstanding (e.g., the Objects roll-up for Purchased Services). At minimum, the working spreadsheet for the F-195 should be published at the same time as the budget book. Otherwise, we’re always six months late in being able to do any useful analysis on the budget. But that will be a later post.
For now, if you want to explore more, I’ve added interactive Sankey graphs showing money flow from resource to different expenditures.
If you click on a band related to Salary, you can find links opening up a historical view of FTE and expenditure changes. And as a bonus, the FTE graphs, for the Program, Activity granularity, now include the budgeted FTE. You can see the huge amount of never-filled FTE yearly that has inflated our budget deficit and made it impossible to know if a budget change results in any money move. See this graph of the Other FTE category budget versus actuals.

Budgeted ‘Other’ staffing fell 20 FTE in 2025 while actuals rose 50 — the two series move in opposite directions
The grey is Budgeted (F-195, general fund) and the blue is Actuals (S-275) FTE for the “Other” category. The “Other” category is defined as every activity outside Teaching, Student Support, and Building Support: central administration, IT, food service, transportation, and the like.
In 2025 it looks like the budget shrank by about 20 FTE while actual staffing grew by about 50. However, the biggest single reason is the capital-projects staff recoded into Information Systems which accounts for nearly all of the supposed “Actuals” growth.
When the two series can move in opposite directions like this, a budget change tells you nothing about what happened to real staffing.
We need budget level breakdowns of staffing per department.
How does this interact with the office restructuring?
Honestly, I don’t know. We have to see what the structure actually is first. You can see this portion of the Budget special session board meeting when they explain how confusing it is to know what’s centrally managed versus actual “central office” vs schools and what cuts they are trying to make. But it’s not enough info to plot the numbers. For one, I have no idea if the savings presented are budget dollars or actual dollars. It’s also hard to know if the savings are mostly done by fixing the ridiculously growing staffing variance between budget and actual (if they did this, it is a HUGE fix btw even if it’s shifting only budget dollars. Gotta clear the weeds first.).
Having said that, the biggest thing that stood out to me is when Brent Jones asked for staff to be cut, Podesta’s org really did a lot of cuts, but others did less.
In that sense, the fiscal command structure feels wrong. Having a re-org might, by a pure factor of shaking things up, allow reevaluation of clusters where the org chain didn’t try to contract.
However, all these things are 1 to 2 year time frames. Folks all seem to really want to see results in the order of months. This is horridly unrealistic for a 7000 person (roughly 6,100 FTE) organization that has been through demoralizing leadership churn for a decade plus. The first step has to be reestablishing a direction to align on. Then you have to reestablish a layer of lieutenants that can investigate downwards. Then those people have to actually integrate into their role correctly to assess the needs of the staff and constraints of the org. And THEN they can report changes.
The org changes are rolling out now. I would not expect anyone to have good ideas for what the org needs to become until at least Nov 2026 timeframe (that’s 2 months of school in session). Then you have to figure out how it fits in strategically with everyone else, socialize it, and jump through all the bureaucratic hoops to start any staffing changes. Only then would you see major shifts, including reductions. That sucks, but it’s hard to see it going a lot faster.
And even after all that, cuts to the District Office alone will not bridge the deficit, let alone free up bunches of money to use in any other area (more APs, more art teachers, more principles, higher teacher salaries, better ratios, etc).
So how much money will be saved? Don’t know. Will the restructure probably break up ossification and have lots of effects in the budget and beyond? Absolutely. When will we see it? Later that we all wish cause humans aren’t machines — we don’t just change.
What’s next?
The next post will either break down Purchased Services or be about the current issues in spending, particularly on Transportation. I’m pretty convinced that the state making youth transit free is what blew the biggest hole in SPS’s finances. Does that not make sense? Good. You are sane. Our state’s transportation funding formula is not.
FAQ
Would removing the Supervision Instruction and IPD staff make us solvent?
No. See the chart earlier showing the likely possible gains from reducing these areas. We can make a significant dent perhaps, but we would not pull even.
Would removing the IT Staff make us solvent?
No. The eye-popping 75 FTE jump in IT staff — Information Systems went from 27 FTE in 2023–24 to 102 in 2024–25 — is the Capital Projects recode covered above, not hiring. Timing matters too: a change that lands in 2025 cannot explain a deficit that existed in 2024. And it’s almost certainly funded by the capital levy via some accounting tricks. Otherwise, I think we’d have seen a world of hurt.

Information Systems rose 75 FTE in 2025 as capital projects fell 74; the combined total barely moves.
What about growth in Operations of Buildings, Health & Related Services, and Guidance and Counseling?
Sharp reader! This makes up a significant chunk of the “District Office / Centrally Managed” staffing growth since 2014. However, I’ve also never heard anyone say that we had too many custodians, too many nurses, or too many counselors. Thus, I excluded it from heavy analysis.
However, if you wisht to jump in, here’s a link to the Money Flow Sankey configured to just show the 3 activities in question with the layer order changed to show Activity -> Object -> NCES and NCES uncollapsed. It will look like this:

Money Flow Sankey configured to just show the 3 activities in question with the layer order changed to show Activity -> Object -> NCES and NCES uncollapsed.
What you can do with this is click on the bands of interest and then use that to jump to a graph showing detailed info for the history of that band.

Same Sankey but with the specific band of interest clicked showing the deeper exploration links for history of spending and FTE.
Dig as you wish, make your own analyses, and then please publish so we can all learn!
Common Acronyms
- AAFTE — Annual Average Full-Time Equivalent, the enrollment measure OSPI uses for funding: the average of the year’s monthly counts, with part-time students counted fractionally. The ~48,500 figure in this post is K-12 AAFTE and does not include the college portion of Running Start enrollment (that funding mostly passes through to the colleges anyway).
- FTE — Full-Time Equivalent, for staff. A half-time employee is 0.5 FTE. Distinct from headcount, which counts individuals. Similarly named but different from AAFTE: in this post, FTE means staff and AAFTE means students.
- OSPI — the state Office of Superintendent of Public Instruction.
- PRR — Public Records Request, how the public gets non-published records; Washington’s version of what people often call a FOIA request. It often takes months, and the results are usually gobs of hard to read PDFs.
Common Terms
- Budget vs. Actuals — Budget is what we planned to spend; Actuals is what actually got spent by year end. The difference between the two is what finance folks call “variance.”
- District Office / Centrally Managed — the S-275’s bucket for staff not assigned to a specific school. Broader than “central administration” or “JSCEE”: it includes central administration, IT, building trades, and itinerant staff who serve many schools.
- Duty Title — the state’s categories for a job; the closest thing we have to a job title. Examples: Elementary Homeroom Teacher, Aide, Service Worker, Speech Language Pathologist or Audiologist, Director or Supervisor, Other Support Personnel.
- F-195, F-196, S-275 — reports districts must file with OSPI. The F-195 is the budget for the year. The F-196 is the Actuals. The S-275 is the (very error-ridden) personnel file.
- Program, Activity, Object — the state accounting codes tagging every line item in the Budget and, later, the Actuals. Money flows in allocated to a Program; it is spent against an (Activity, Object) combination. Activities are functions like Teaching, Human Resources, or Supervision — Instruction. Objects are seven spending categories (plus two transfer codes) that, for this post, let us separate Salary, Benefits, and everything else — and let us match data across reports.
But what about Cost of living Adjustments for staff, raises above COLA, better ratios, more librarian, more art teachers, more music teachers, more IAs, better curriculum, [insert thing you care about]?
…this is a very very scary thing I realized recently.
At the end of last year, the first back-of-the-envelope calculation made me think that we could pull close to even if not slightly ahead by handling this bucket of growth. But after doing it more thoroughly now (understanding the breakdowns of Supervision — Instruction + IPD), I find that we can’t bridge much more than half the deficit at best.
And that’s before including the, sudden, multi-million dollar growth in uncontrollable permanent cost increases such as insurance.
It’s quite possible that we do not have enough money to provide any of the above. In fact, it’s quite possible that to stay solvent, we would have to cut some of the above — and nothing listed there seems anything less than basic function.
This is something I don’t think folks have internalized because, due the muddied state of the budget for the past decade+ (thanks again Nyland), it’s easy to just say “cut central office” or “cut contracts” or (extremly erroniously) “we have a large fund balance” to justify why we should be able to get more funds.
Yes there is millions of dollars of stuff here that probably could be reconsiderd and trimmed down. But as of now, I’m pretty convinced that will not sum to $25+ million which has HUGE negative implications for every advocacy effort (rando parent, PTSA, union, etc) that, likely correctly, identifies that current allocation does not meet needs of staff or student.
I don’t think we as a community have fully internalized what that means which is: the district cannot solve this insolvency by reallocating funds. Something must change somewhere else, or we will end up in binding conditions and then, afer a few years, receivership with loss of local control.
You seem still pretty upset at Student Outcomes Focused Governance. Are you?
Yes. Cause we’re still cleaning up the mess (see last entry).
But since we’re on this topic, I think some shade should also be thrown at the Council of Great City Schools — the folks who created Student Outcomes Focused Governance and still have it on their website.
Remember this is the method that suggested we remove the finance committee. And somehow let board members enact governance rules to stop each other from asking detailed questions because they weren’t “strategic” despite very hands-on coaching (seriously this vid is worth a watch to see how useless the “coaching” is. Find more by searching for AJ Crabill in the SPS By The Numbers Transcripts Archive).
Since we were paying them 55k in membership dues and addition fees for coaching in the FY 2024–25 school year (See this PRR 176 onwards) and their marketing material claimed “$96 return for each $1 paid in dues” for them saving various funding sources, I’m extra annoyed.
It’s not much money to spend sure, but if you think about the dollar amount of hours lost for staff, union, community due to the lack of transparency created over time via the people behind this, it’s like spending money each year just to create more debt. (Also they don’t seem to have been doing much reported lobbying recently so even that $96 is suspect).
As long as they’re pushing SOFG, I have to question their collective advice. Especially about “governance.”
What’s your favorite Unicode emoji
☃. Always.
AI Usage Note
This post was done with medium use of Claude Code for generating images, verifying numbers, and copy editing. The reasoning and numbers were manually rechecked so they should be right.
메타데이터
- post_id
- a4f6e04c2e52
- slug
- cracking-the-budget-2-the-central-office-grew-cutting-it-wont-save-us-a4f6e04c2e52
- url
- https://medium.com/@awongawong/cracking-the-budget-2-the-central-office-grew-cutting-it-wont-save-us-a4f6e04c2e52
- canonical_url
- https://medium.com/@awongawong/cracking-the-budget-2-the-central-office-grew-cutting-it-wont-save-us-a4f6e04c2e52
- author_url
- https://medium.com/@awongawong
- status
- ok
- fetched_at
- 2026-08-07 22:47:36