COMPLETE THREAT INTELLIGENCE PIPELINE FROM STIX FEEDS TO LIVING DASHBOARDS
Part-2
COMPLETE THREAT INTELLIGENCE PIPELINE FROM STIX FEEDS TO LIVING DASHBOARDS
Part-2
MISP 2.5 · AWS EC2 · Taxonomies · Feeds · TAXII 2.1 · STIX 2.1 Export
Before diving into the ELK stack, here is a 16-point recap of everything completed in Part 1 on a dedicated AWS EC2 instance (c7i-flex.large · Ubuntu 24.04 · Elastic IP X.XXX.XXX.XXX).
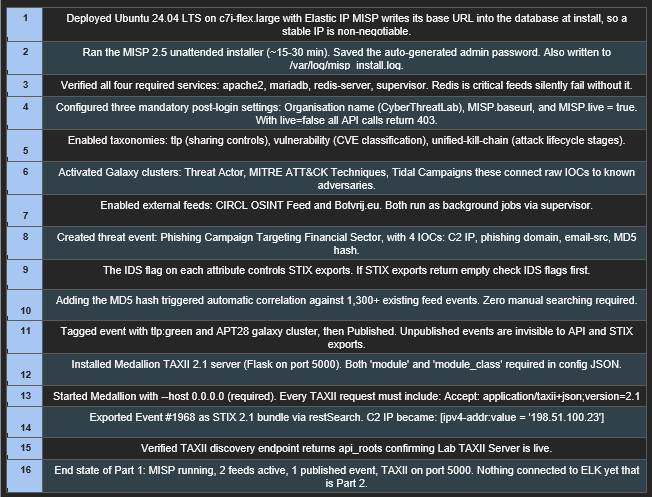
Key Gotchas from Part 1
⚠️ Medallion is NOT a systemd service. Restart every session: nohup ~/.local/bin/medallion — host 0.0.0.0 — port 5000 ~/medallion_config.json > ~/medallion.log 2>&1 & If port 5000 in use: pkill -f medallion && sleep 2 then restart.
• IDS flag must be checked on each MISP attribute, otherwise it will not appear in STIX exports.
• MISP.live must be true or all API calls return 403 check Administration → Server Settings → MISP.
• Unpublished events are invisible to the API and STIX exports always click Publish after creating an event.
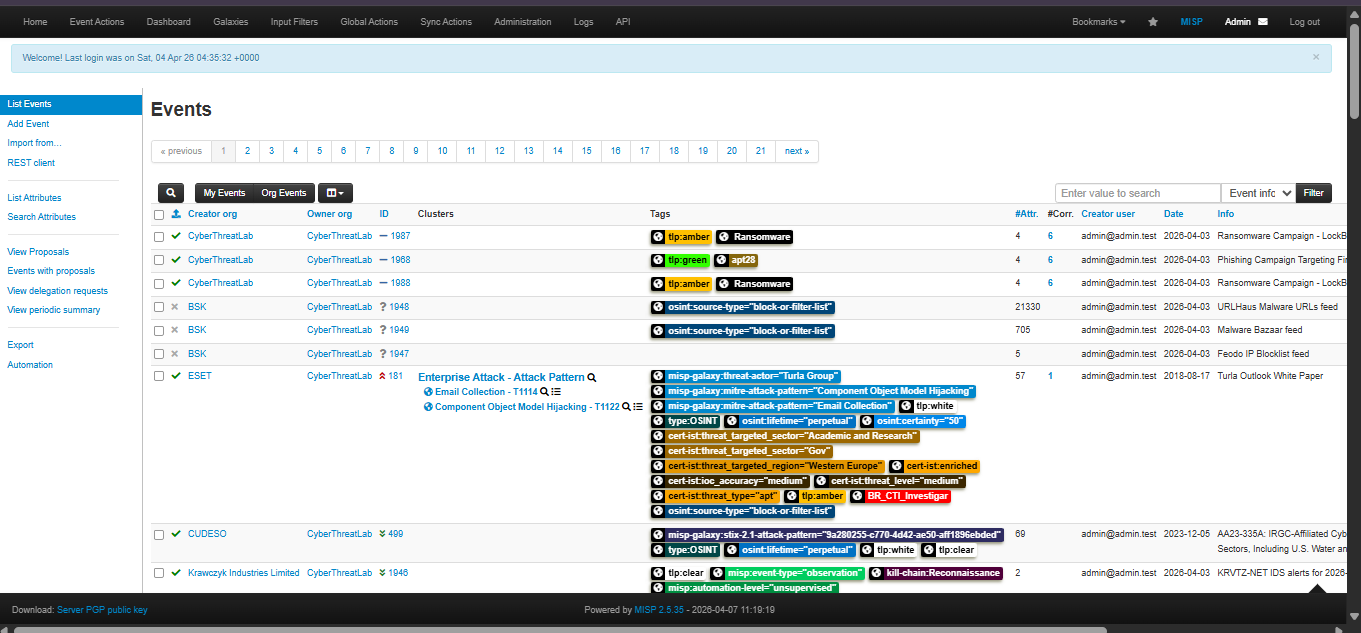
MISP Events list before integration showing existing published events (Phishing Campaign, Ransomware, LockBit 3.0) that will be exported to ELK in Part 2:
About This Part 2 Blog
From a single MISP instance to a fully automated, bidirectional ELK pipeline
Welcome to Part 2 of the Complete Threat Intelligence Pipeline series. Part 1 laid the foundation by deploying MISP 2.5 on AWS EC2, configuring taxonomies and Galaxy clusters, enabling external feeds (CIRCL OSINT and Botvrij.eu), and standing up the Medallion TAXII 2.1 server on port 5000. At the end of Part 1 we had a single, isolated MISP node with one published event and zero downstream consumers.
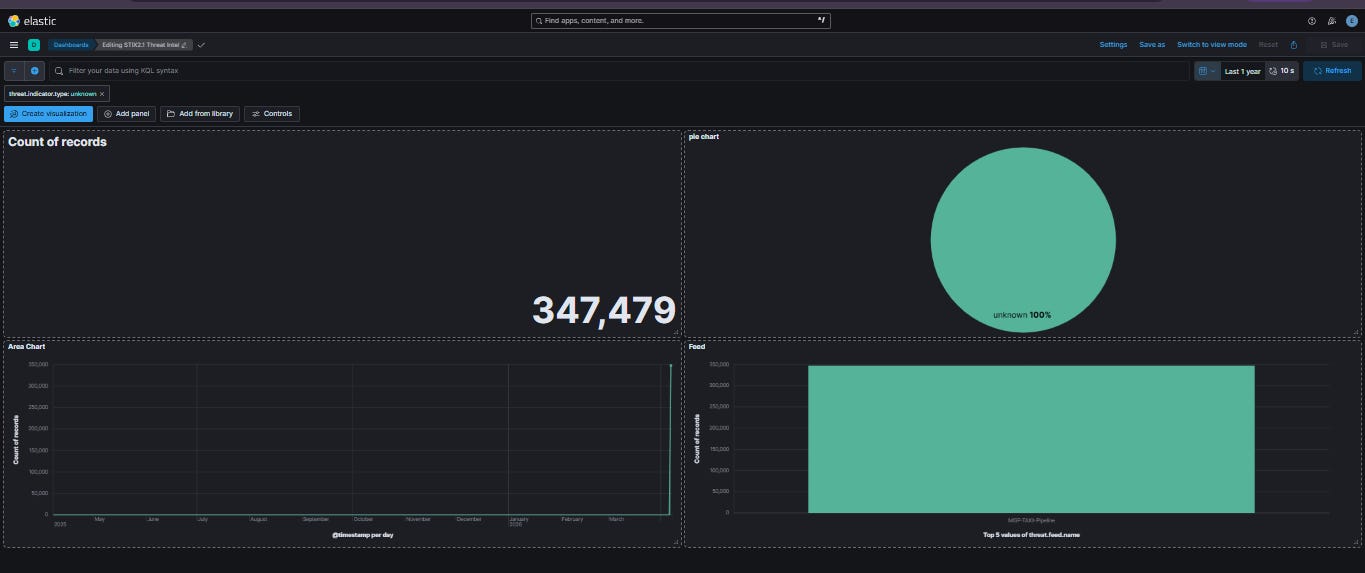
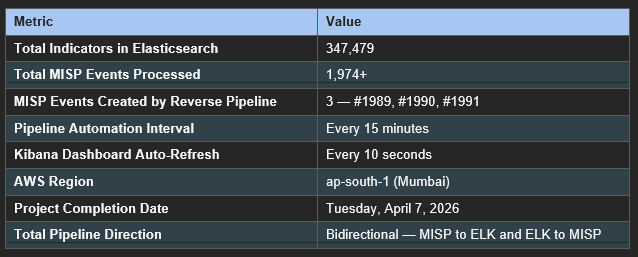
This Part 2 blog turns that isolated node into a production-grade threat intelligence pipeline. Across eighteen chapters you will provision a second AWS EC2 instance (t3.xlarge, Ubuntu 22.04), install and harden the full Elasticsearch + Kibana + Logstash stack, design an ECS-aligned index for STIX 2.1 indicators, build the Python pipeline that polls MISP via TAXII and writes IOCs into Elasticsearch, construct a multi-panel Kibana dashboard visualising 347,479 indicators, and wire up the reverse pipeline that pushes ELK detections back into MISP as new events. The final chapter automates the entire bidirectional cycle with a systemd timer running every fifteen minutes.
Every command, every error, and every fix encountered during the live build is documented exactly as it happened. Screenshots are cross-referenced to the original session PDF so you can verify your output against the real lab environment as you follow along.
Project Environment & Structure
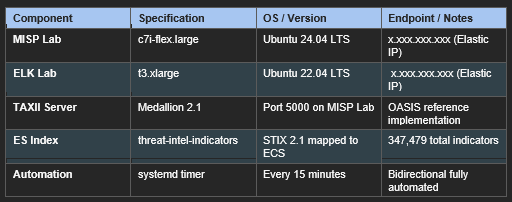
The full pipeline runs across two AWS EC2 instances. The MISP Lab serves curated threat intelligence over TAXII; the ELK Lab indexes incoming indicators into Elasticsearch and surfaces them through Kibana. A pair of Python scripts moves data in both directions on a 15-minute systemd timer, with zero manual intervention once configured.
1. Lab Infrastructure
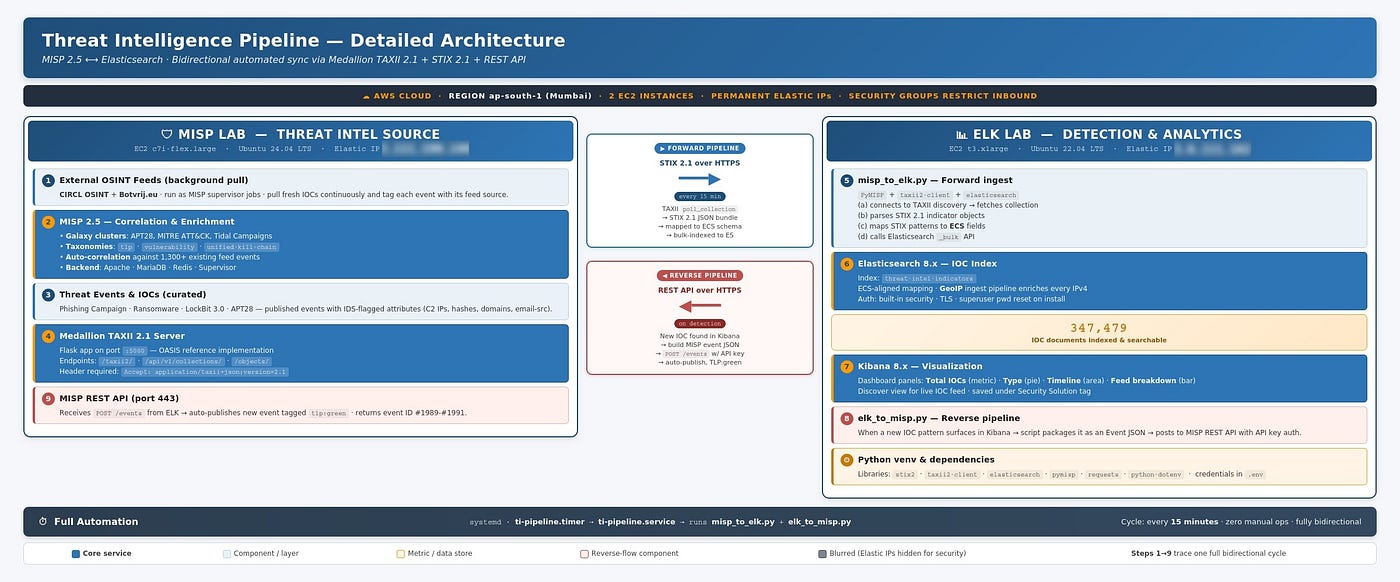
2. Pipeline Architecture & Data Flow.
Forward pipeline (MISP → ELK): the TAXII client polls the Medallion server every 15 minutes, parses STIX 2.1 bundles, normalises the indicators into ECS-aligned documents, and bulk-indexes them into Elasticsearch. Kibana surfaces the result.

Reverse pipeline (ELK → MISP): when a new IOC pattern surfaces in Kibana, elk_to_misp.py packages it and posts it to the MISP REST API, where it becomes a new auto-published event tagged tlp:green and visible to all downstream consumers.

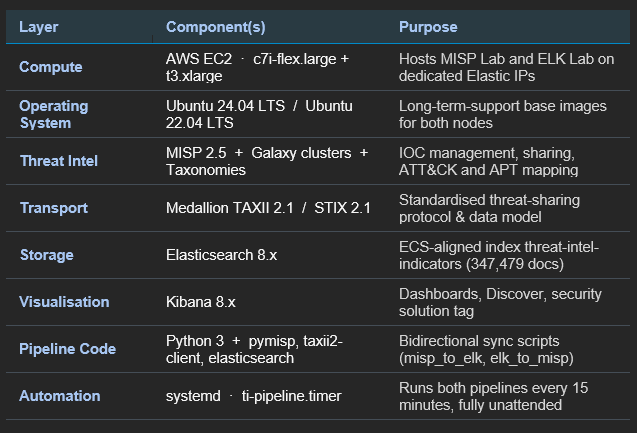
3. Technology Stack
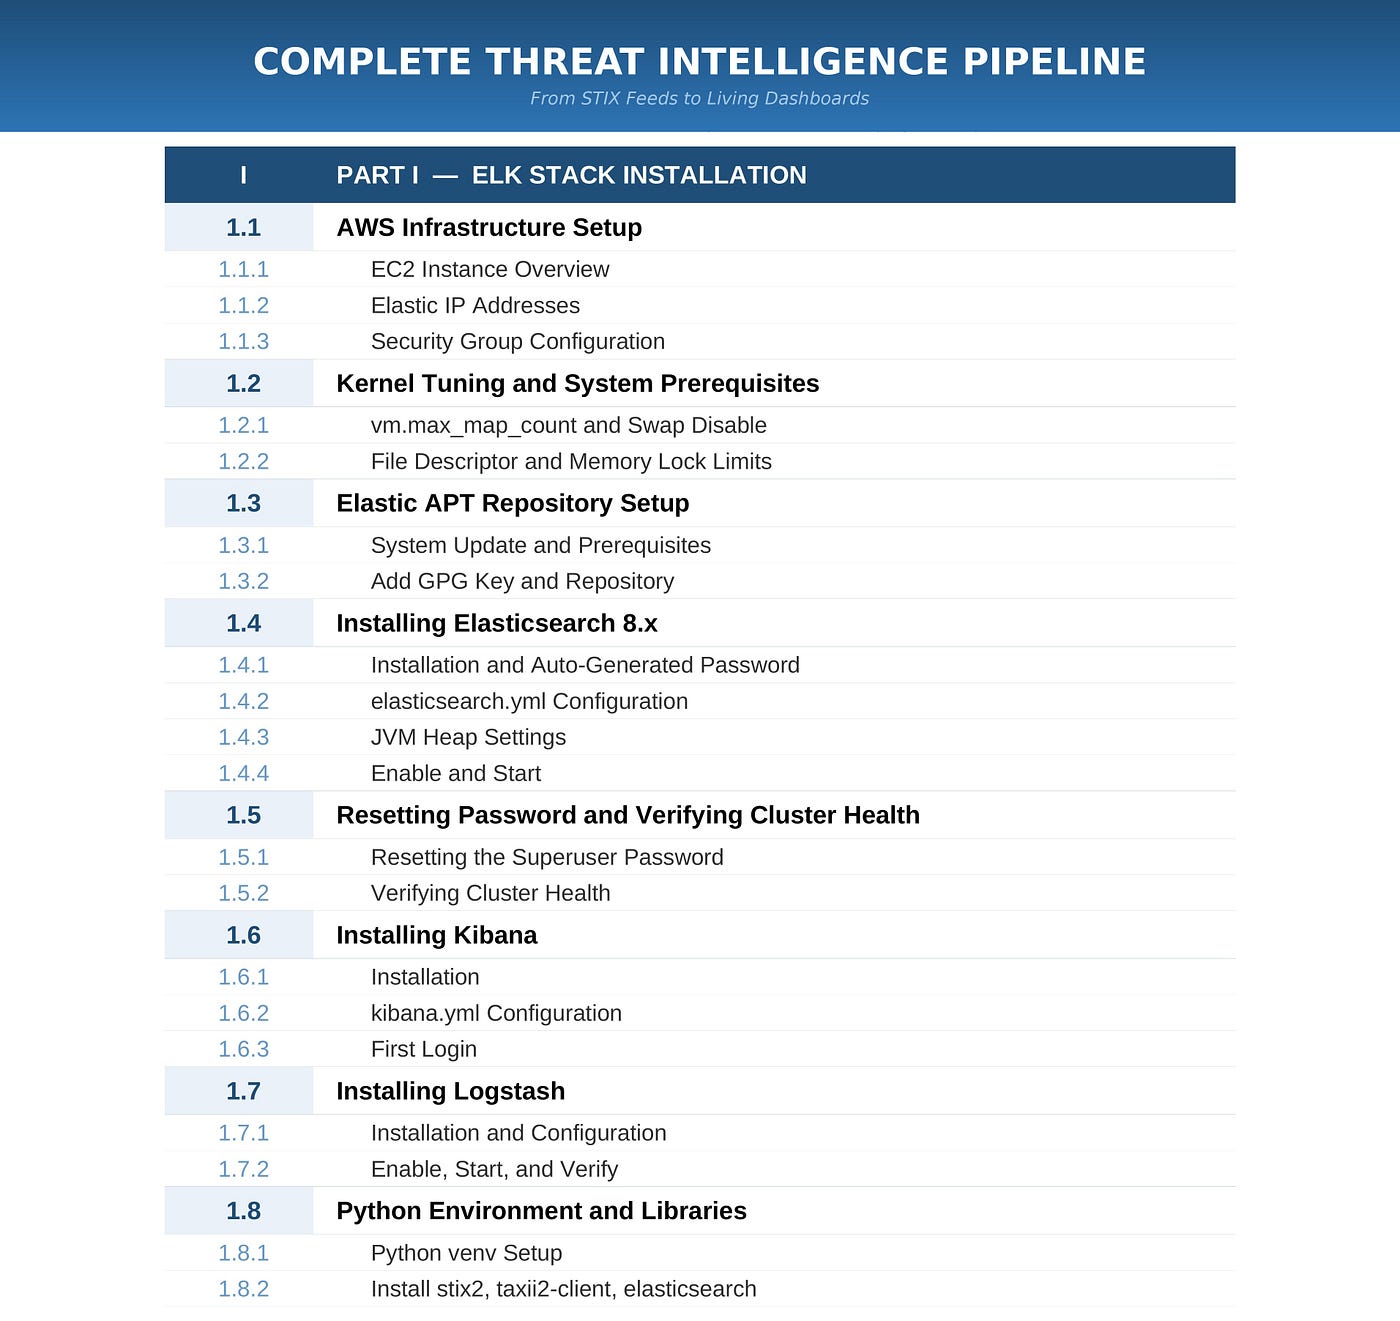
🛠️ What You Need Before Starting
This is a hands-on lab blog not a theoretical overview. You will be running real commands on real AWS infrastructure. Here is what you need:
• An AWS account with EC2 access two instances will be used (t3.xlarge + c7i-flex.large)
• Basic Linux command line comfort we use sudo, apt, systemctl, curl throughout
• Part 1 complete MISP 2.5 installed, at least one published event with IOCs, Medallion TAXII running (Part 0 recap covers this)
• ~3–4 hours of focused time the full pipeline from blank EC2 instance to 347,479 indexed indicators
• Patience for errors this blog documents every real error encountered and exactly how it was fixed
PART 1 — ELK STACK INSTALLATION
Installing Elasticsearch · Kibana · Logstash on AWS EC2
This section covers the full ELK Stack installation on a fresh t3.xlarge Ubuntu 22.04 instance. Elasticsearch 8.x comes with security enabled by default TLS, authentication, and auto-generated certificates are all set up automatically. This is a significant change from older versions where security was optional.
1. AWS Infrastructure Setup
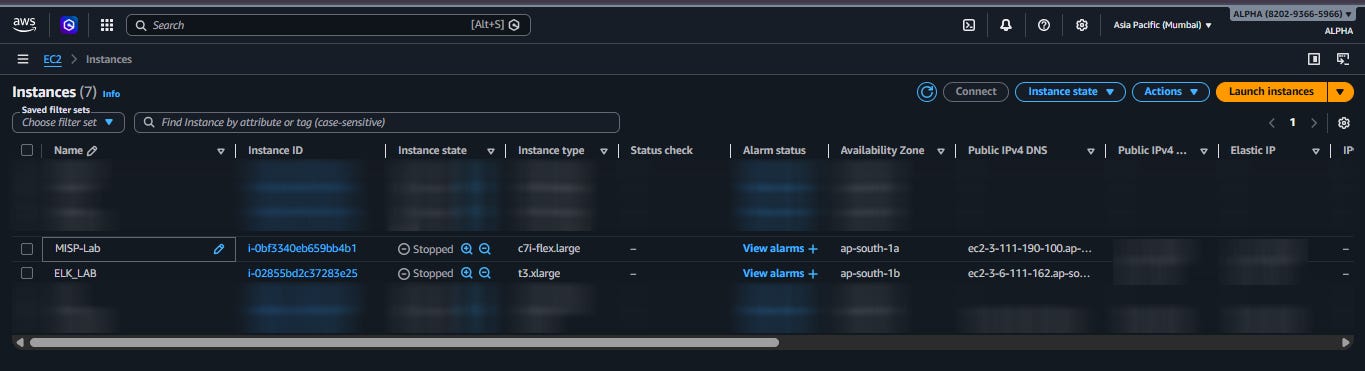
1.1.1 EC2 Instance Overview
Both instances run in ap-south-1 (Mumbai) with permanent Elastic IPs. MISP writes its base URL into the database at install time a changing IP breaks everything.
1.1.2 Elastic IP Addresses
Both MISP (x.xxx.xxx.xxx) and ELK (x.x.xxx.xxx) have permanent Elastic IPs assigned. These never change even after instance restarts.

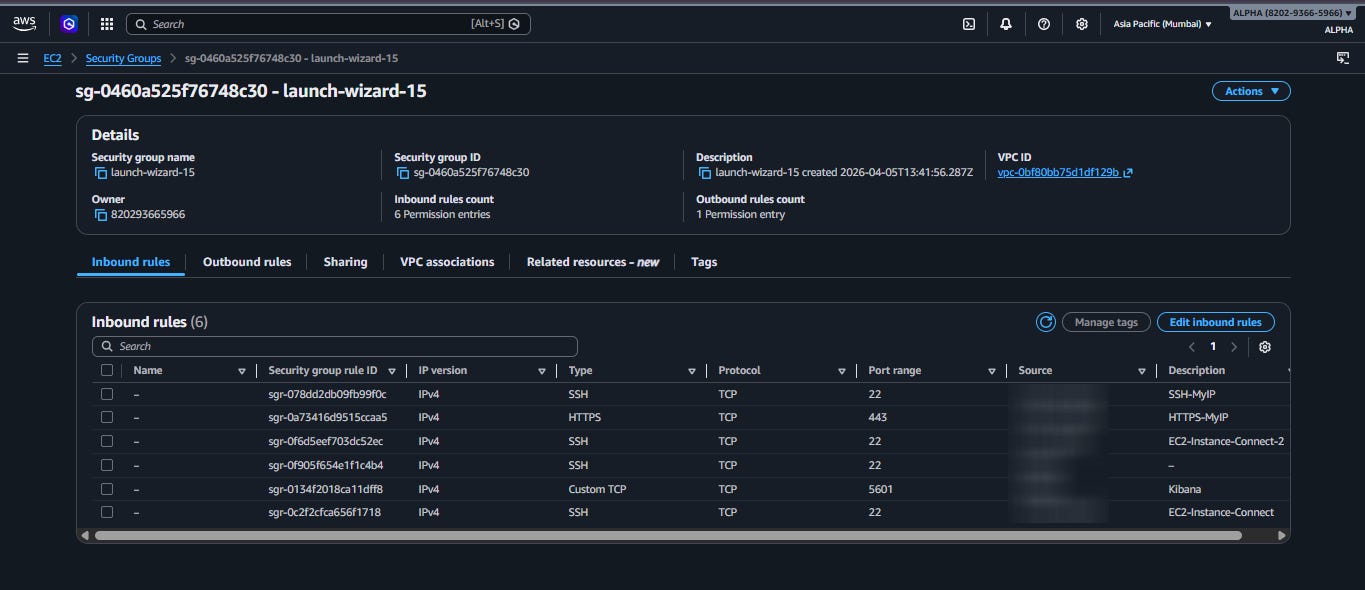
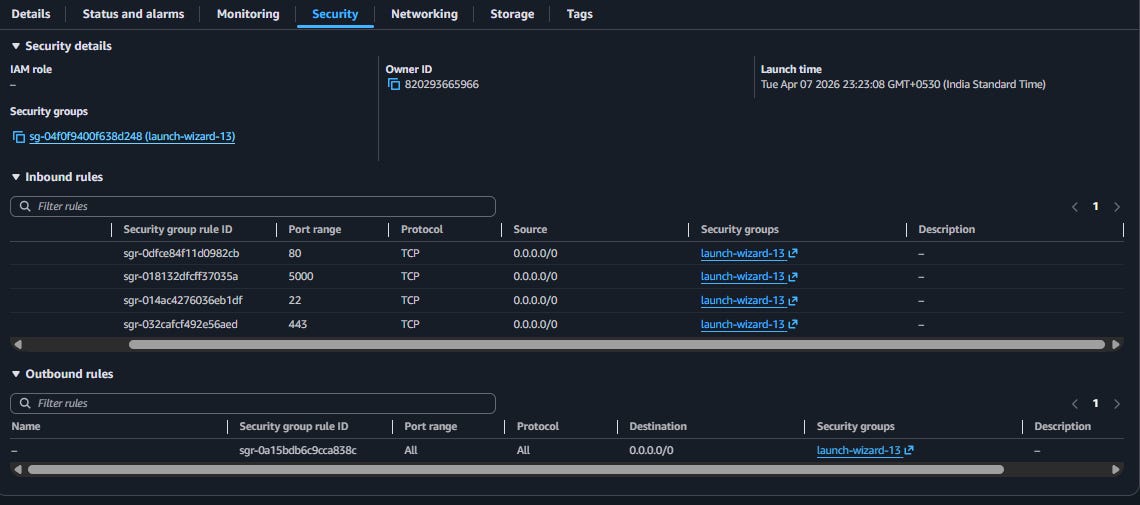
1.1.3 Security Group Configuration
Two separate security groups are needed. ELK Lab exposes SSH, HTTPS, and Kibana. MISP Lab additionally needs port 5000 open for Medallion TAXII server connections from ELK Lab.
1.2. Kernel Tuning and System Prerequisites
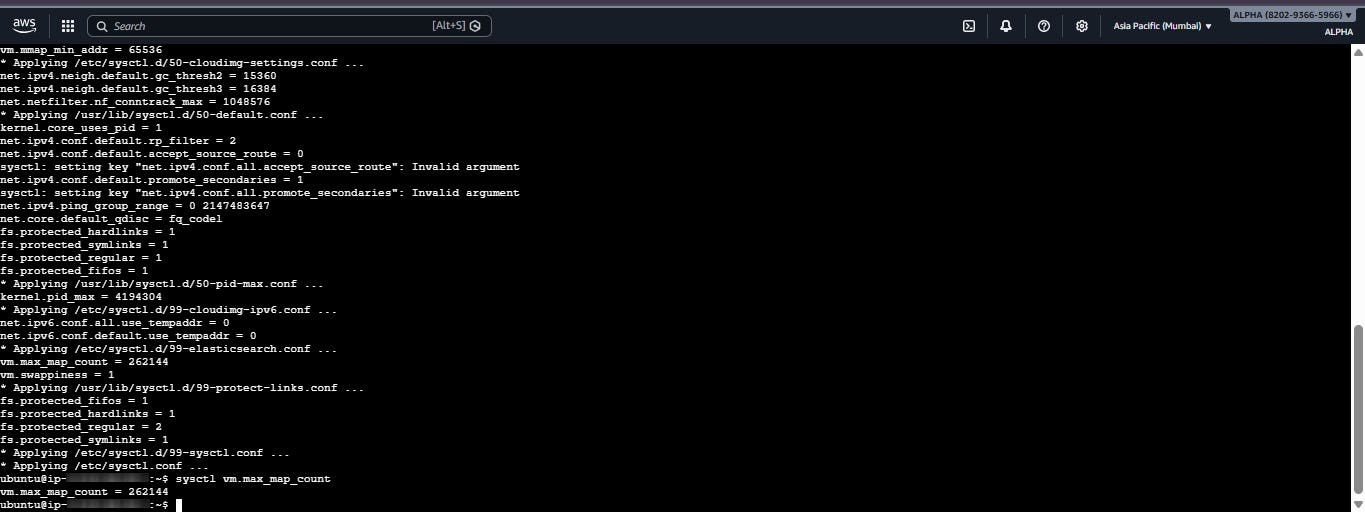
1.2.1 vm.max_map_count and Swap Disable
Elasticsearch checks vm.max_map_count at startup and refuses to start if it is below 262144. Swap must also be disabled.
echo “vm.max_map_count=262144” | sudo tee /etc/sysctl.d/99-elasticsearch.conf
echo “vm.swappiness=1” | sudo tee -a /etc/sysctl.d/99-elasticsearch.conf
sudo sysctl — system
sudo swapoff -a
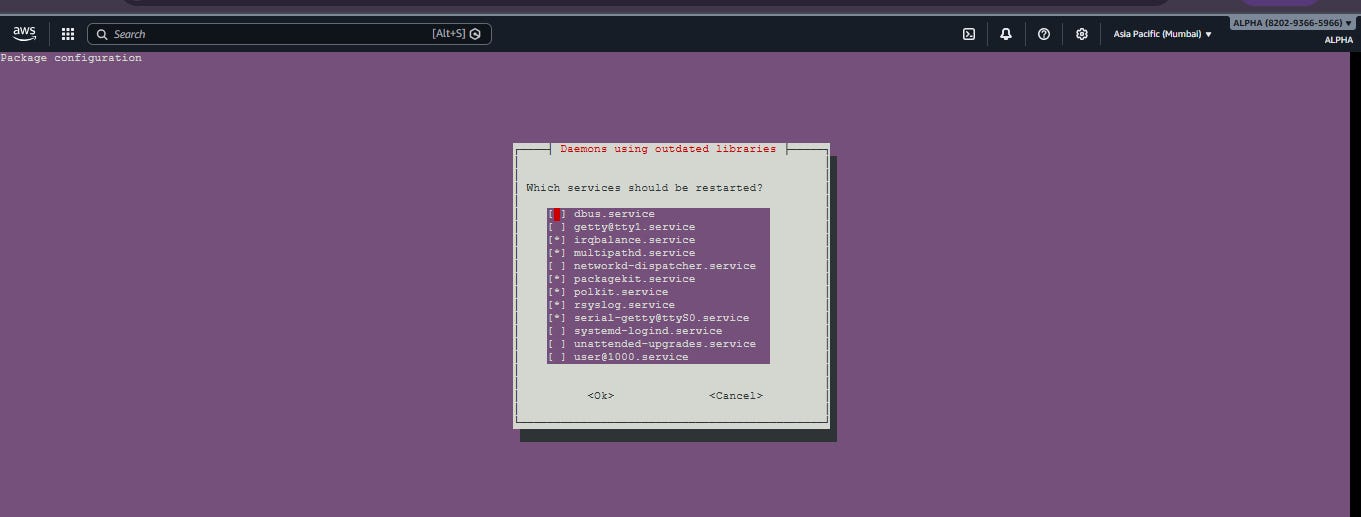
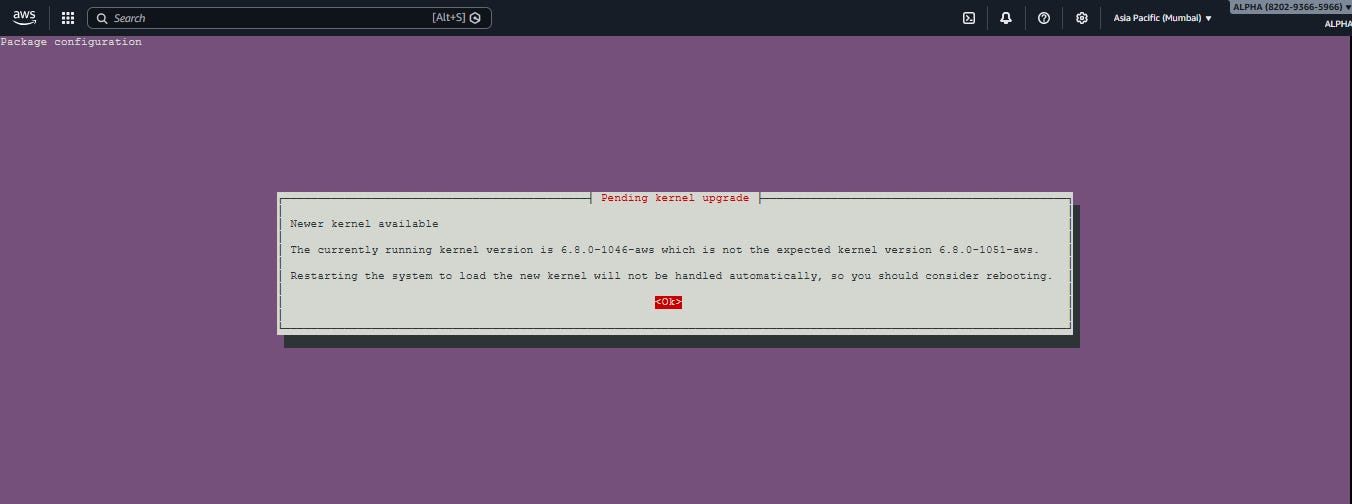
During apt upgrade you will see dialogs these are normal. Click OK to proceed.
1.2.2 File Descriptor and Memory Lock Limits
cat << ‘EOF’ | sudo tee /etc/security/limits.d/50-elasticsearch.conf
elasticsearch soft nofile 65535
elasticsearch hard nofile 65535
elasticsearch soft memlock unlimited
elasticsearch hard memlock unlimited
EOF
sudo mkdir -p /etc/systemd/system/elasticsearch.service.d
printf ‘[Service]\nLimitMEMLOCK=infinity\nLimitNOFILE=65535\n’ | sudo tee /etc/systemd/system/elasticsearch.service.d/override.conf
sudo systemctl daemon-reload
1.3 Elastic APT Repository
1.3.1 System Update and Prerequisites
Update package lists and install the prerequisites required to add a signed APT repository. Elasticsearch, Kibana, and Logstash will all come from the same Elastic repo.
sudo apt update && sudo apt upgrade -y
sudo apt install -y apt-transport-https curl gnupg
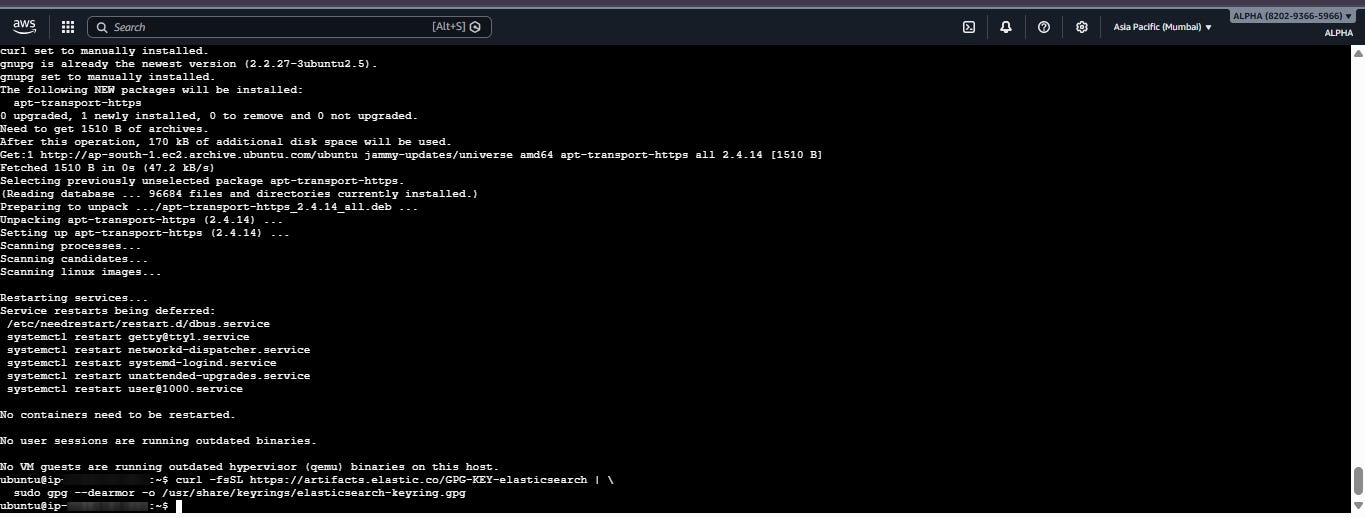
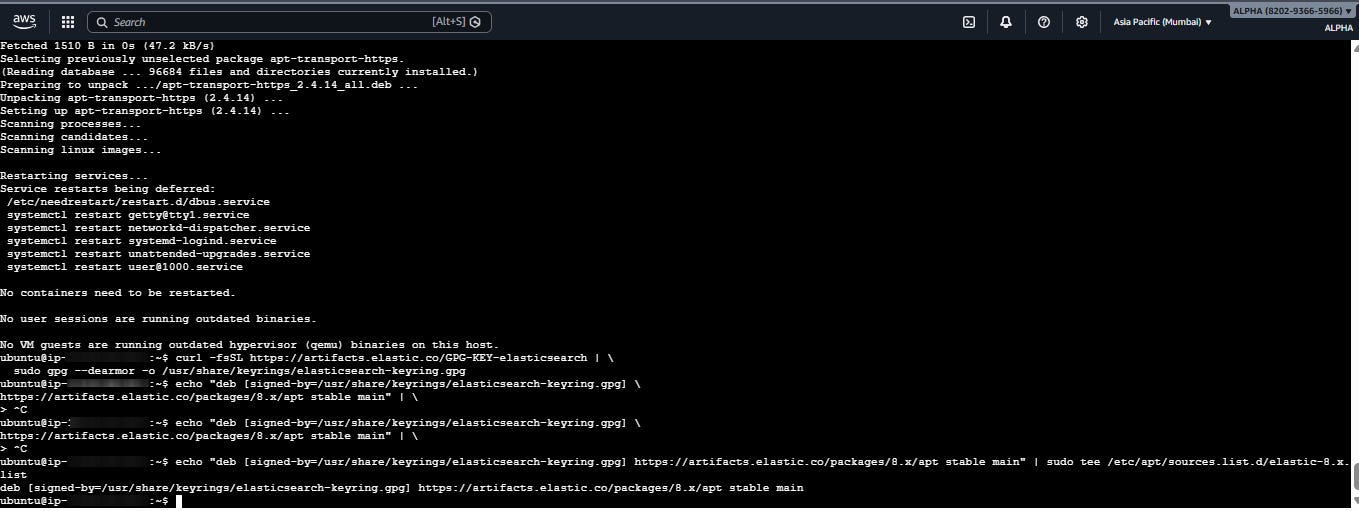
1.3.2 Add GPG Key and Repository
curl -fsSL https://artifacts.elastic.co/GPG-KEY-elasticsearch | \
sudo gpg — dearmor -o /usr/share/keyrings/elasticsearch-keyring.gpg
echo “deb [signed-by=/usr/share/keyrings/elasticsearch-keyring.gpg] \
https://artifacts.elastic.co/packages/8.x/apt stable main” | \
sudo tee /etc/apt/sources.list.d/elastic-8.x.list
sudo apt update
1.4 Installing Elasticsearch 8.x
1.4.1 Installation and Auto-Generated Password
sudo apt install -y elasticsearch
⚠️ The auto-generated elastic superuser password is highlighted in the install output. SAVE IT IMMEDIATELY — shown only once. Also written to /var/log/elasticsearch install log.
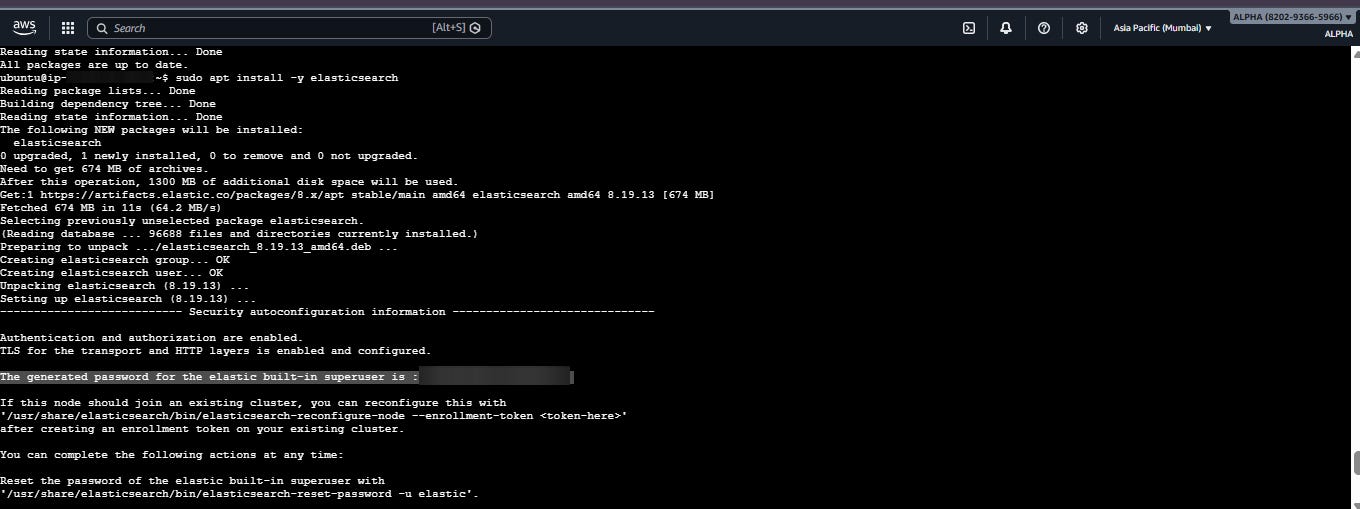
When the install completes, Elasticsearch has already auto-configured TLS for both the HTTP and transport layers, created a CA certificate, and generated an enrollment token for Kibana. This is the biggest change from Elasticsearch 7.x in version 8.x you cannot skip security even for a lab. The auto-configuration handles it all.
1.4.2 elasticsearch.yml Configuration
Edit /etc/elasticsearch/elasticsearch.yml for single-node lab operation:
cluster.name: elk-lab
node.name: elk-node-1
path.data: /var/lib/elasticsearch
path.logs: /var/log/elasticsearch
network.host: localhost
http.port: 9200
discovery.type: single-node
bootstrap.memory_lock: true
xpack.security.enabled: true # ON by default in 8.x — keep it
1.4.3 JVM Heap Settings
Create /etc/elasticsearch/jvm.options.d/heap.options — give ES half of available RAM, capped at 31 GB:
-Xms8g # For 16 GB instance
-Xmx8g
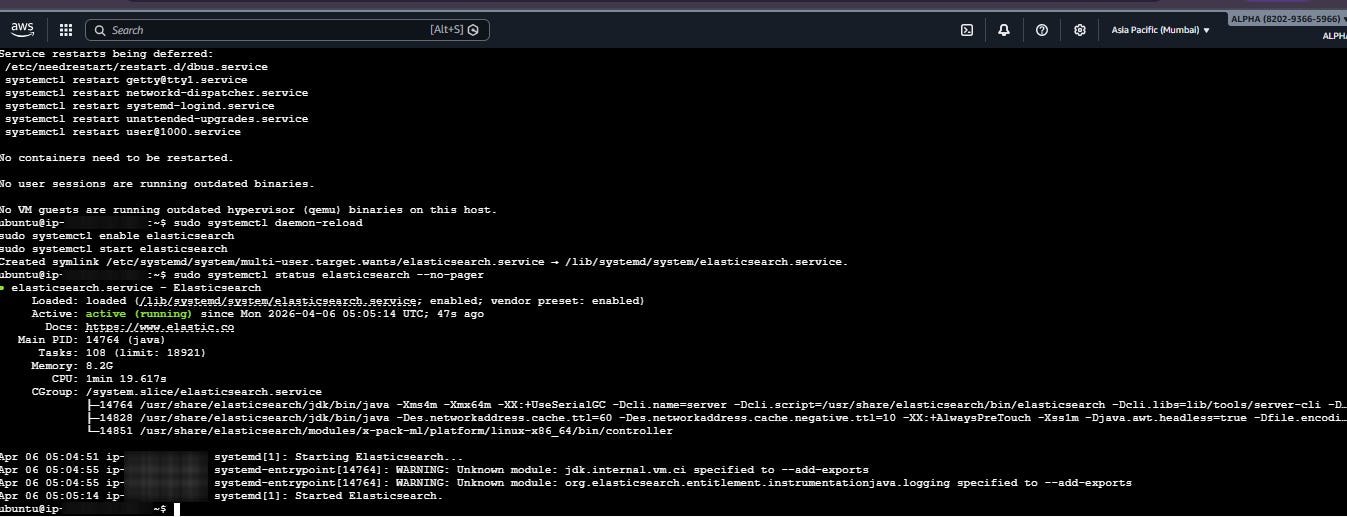
1.4.4 Enable and Start
sudo systemctl daemon-reload
sudo systemctl enable elasticsearch && sudo systemctl start elasticsearch
1.5 Resetting Password and Verifying Cluster Health
1.5.1 Resetting the Superuser Password
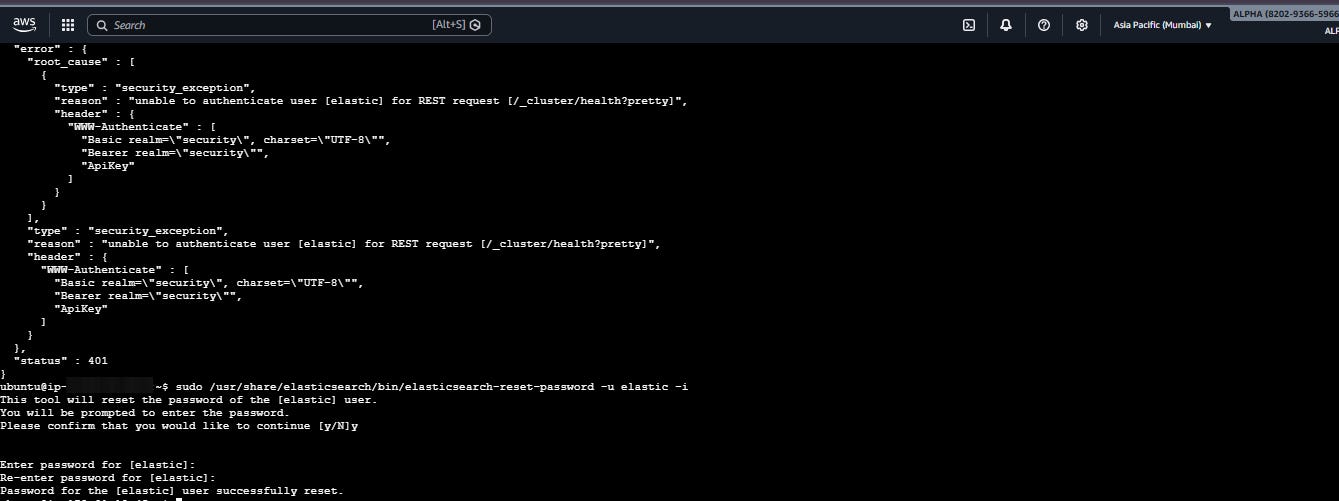
If the install-time password was not saved (common after session restart), reset it interactively using the built-in tool:
sudo /usr/share/elasticsearch/bin/elasticsearch-reset-password -u elastic -i
1.5.2 Verifying Cluster Health
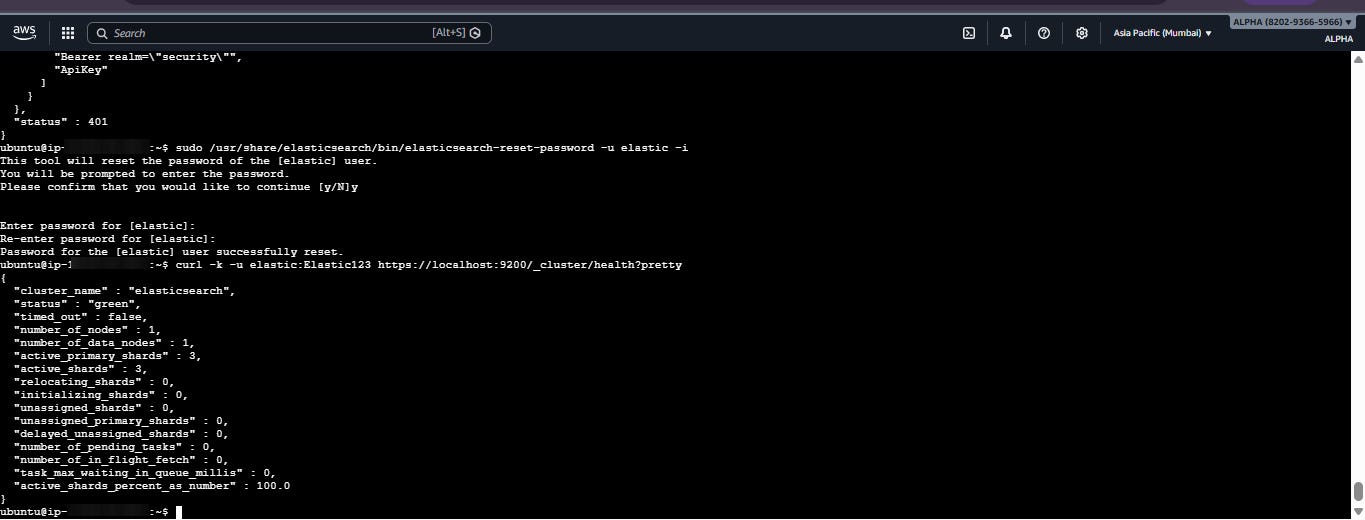
Confirm Elasticsearch is running and the cluster is healthy before proceeding to Kibana installation:
curl -k -u elastic:Elastic123 https://localhost:9200/_cluster/health?pretty
1.6. Installing Kibana
1.6.1 Installation
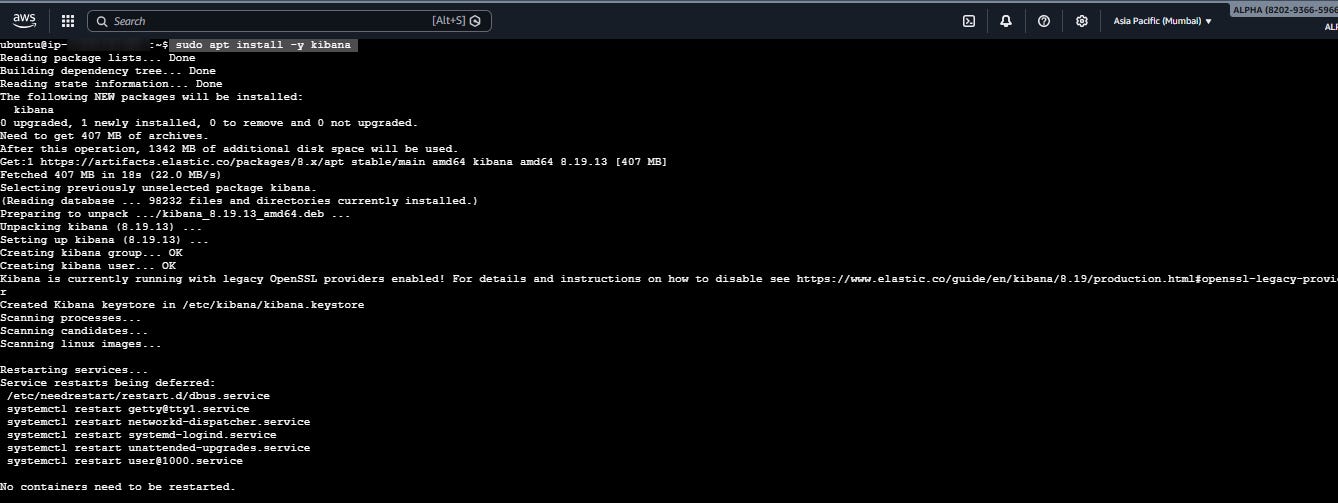
Install Kibana from the Elastic APT repository. The package fetches ~407 MB and automatically creates the kibana user, group, and keystore.
sudo apt install -y kibana
1.6.2 kibana.yml Configuration
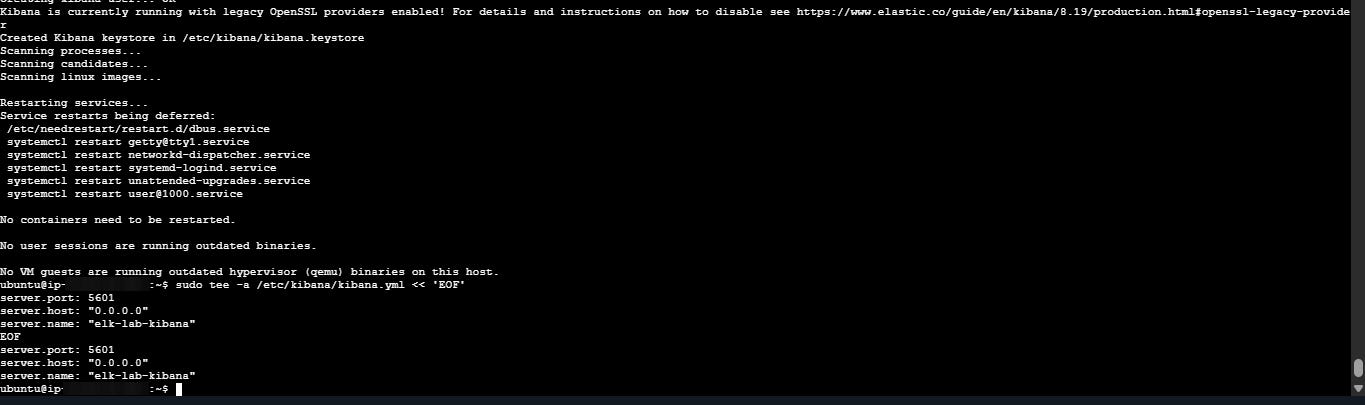
sudo tee -a /etc/kibana/kibana.yml << ‘EOF’
server.port: 5601
server.host: “0.0.0.0”
server.name: “elk-lab-kibana”
EOF
sudo /usr/share/elasticsearch/bin/elasticsearch-create-enrollment-token -s kibana
sudo systemctl enable kibana && sudo systemctl start kibana
⚠️ Kibana enrollment tokens expire after 30 minutes. Generate the token immediately before starting Kibana for the first time.
1.6.3 First Login
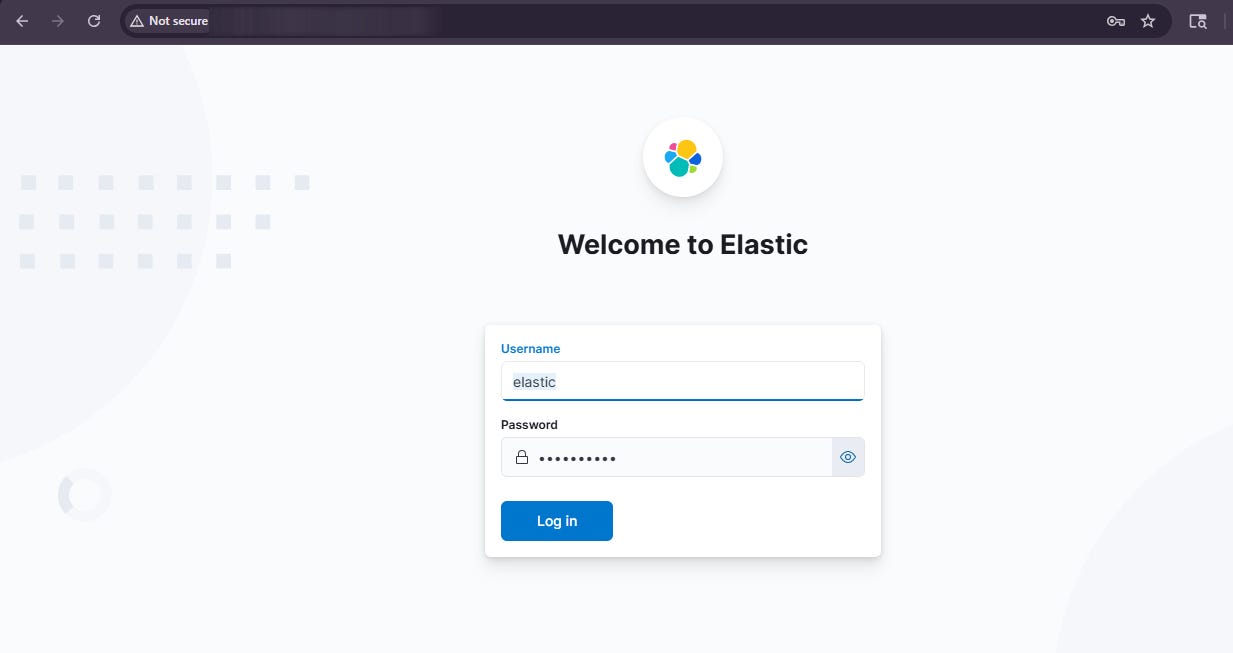
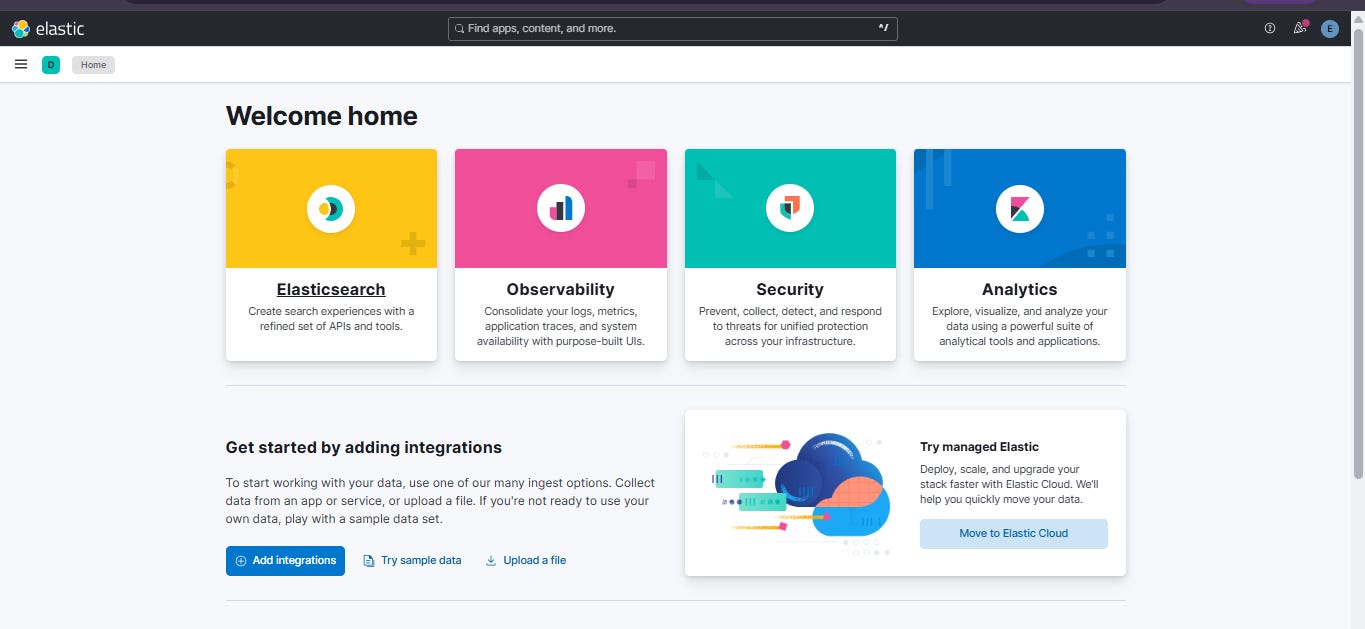
Navigate to http://3.6.111.162:5601, accept self-signed cert warning, paste enrollment token, then log in with elastic and the auto-generated password.
1.7. Installing Logstash
1.7.1 Installation and Configuration
sudo apt install -y logstash
Set Logstash heap in /etc/logstash/jvm.options to prevent memory pressure alongside Elasticsearch and Kibana:
-Xms1g # /etc/logstash/jvm.options
-Xmx1g
1.7.2 Enable, Start, and Verify
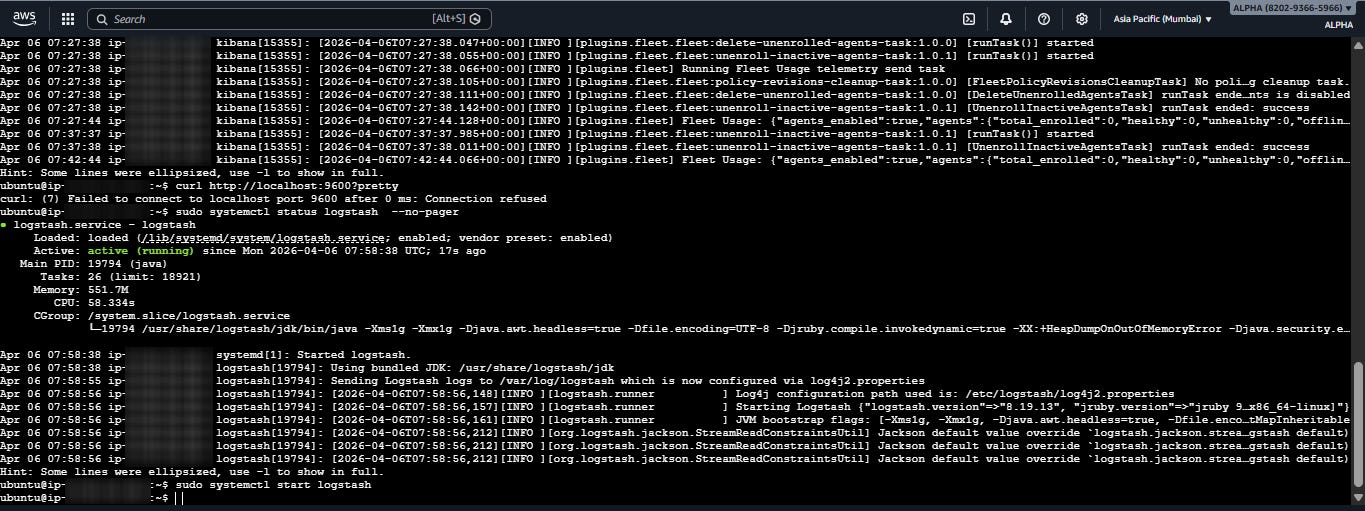
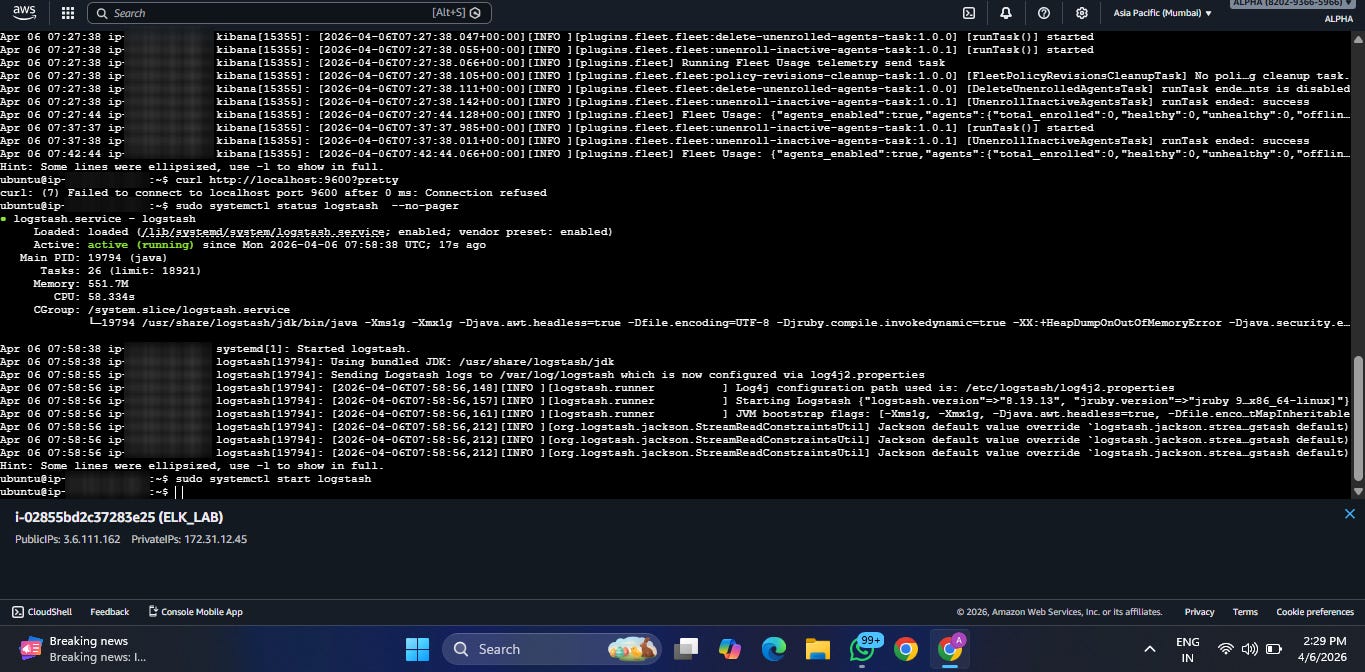
sudo systemctl enable logstash && sudo systemctl start logstash
Verify Logstash is running. Note: port 9600 (Logstash monitoring API) may show connection refused initially restart resolves this:
1.8 Python Environment and Libraries
1.8.1 Python venv Setup
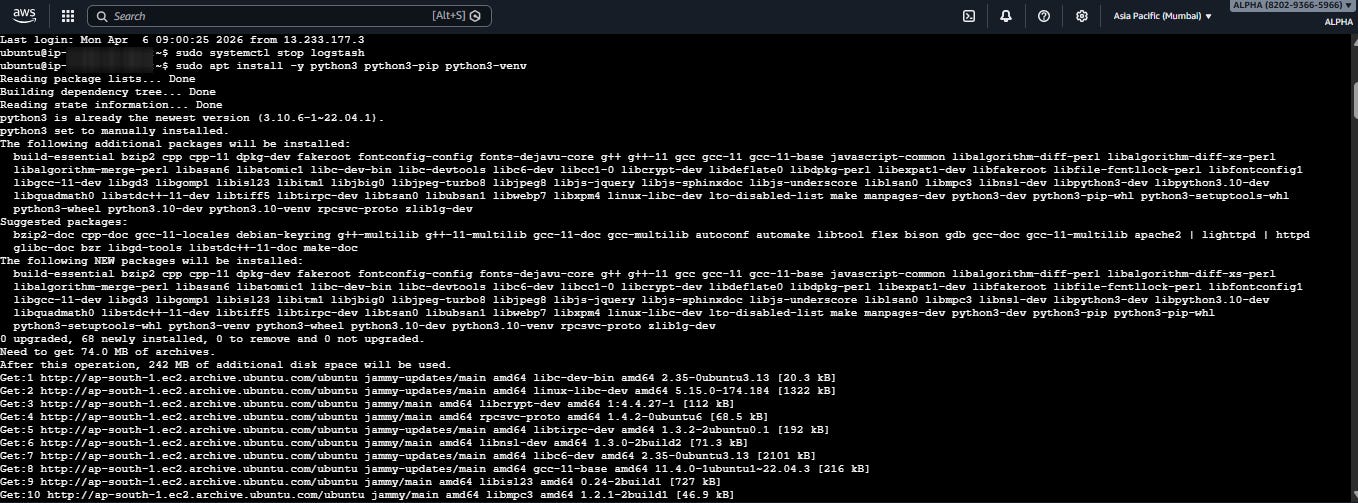
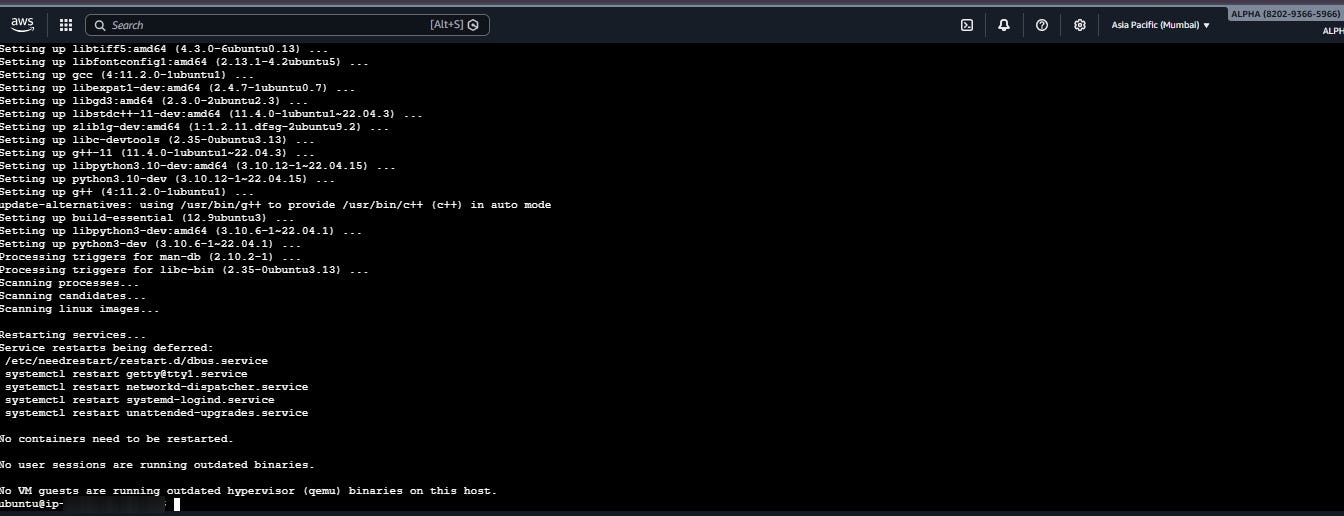
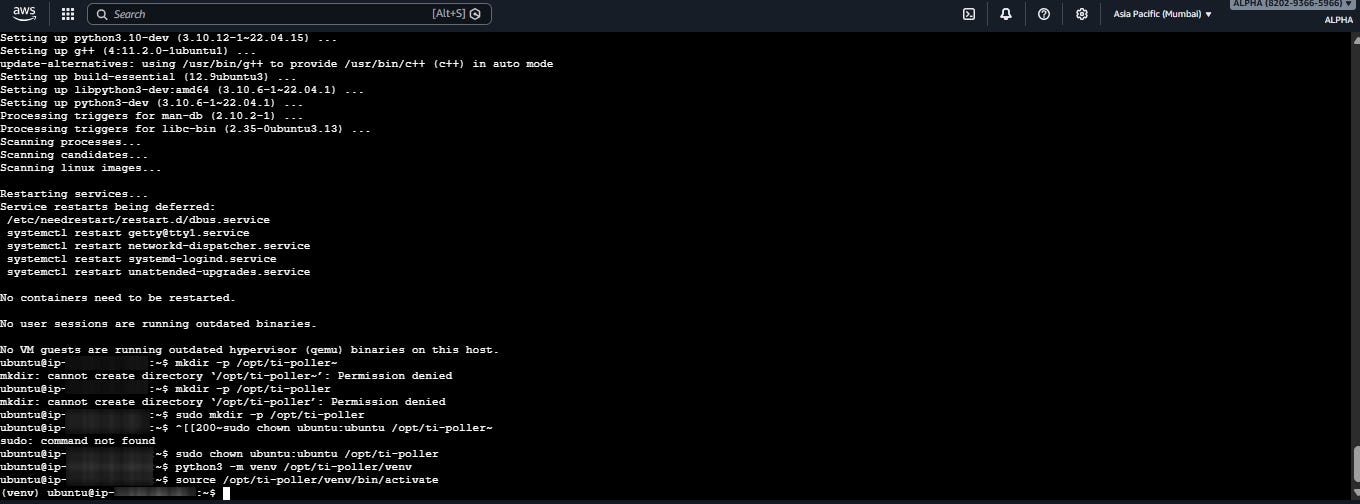
Install Python tooling and create an isolated virtual environment for the STIX/TAXII pipeline so its dependencies do not conflict with system packages.
sudo apt install -y python3 python3-pip python3-venv
sudo mkdir -p /opt/ti-poller && sudo chown ubuntu:ubuntu /opt/ti-poller
python3 -m venv /opt/ti-poller/venv
source /opt/ti-poller/venv/bin/activate
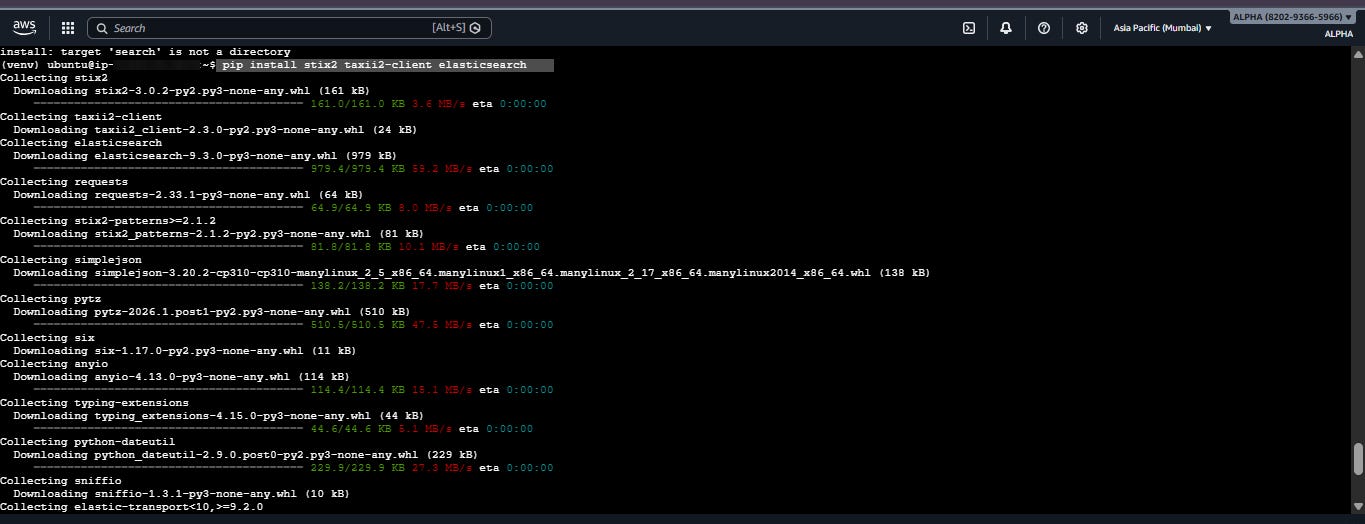
1.8.2 Install Libraries
pip install stix2 taxii2-client elasticsearch requests
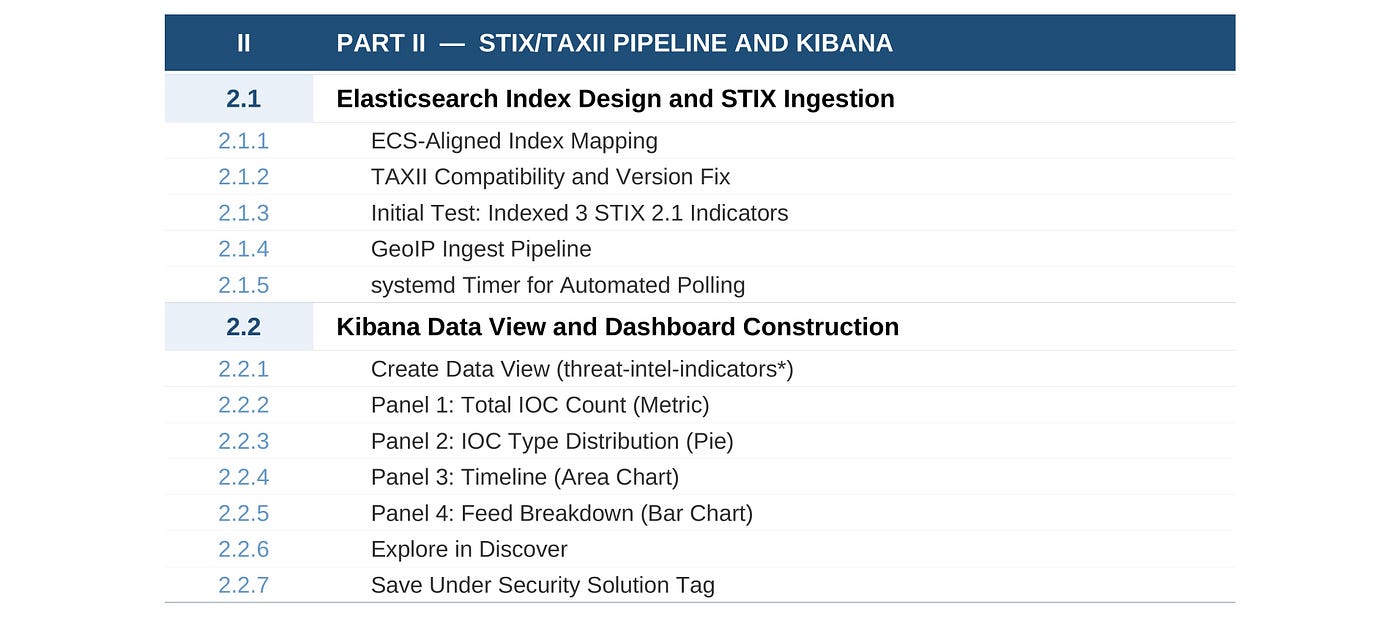
PART 2 — STIX/TAXII PIPELINE AND KIBANA
With ELK running, this section connects it to actual threat intelligence data. The most important architectural decision here is the index mapping specifically using ECS (Elastic Common Schema) field names like threat.indicator.ip and threat.indicator.type. This is not just a naming convention: it unlocks Elastic Security’s native indicator match rules, which cross-reference live event data against your threat intel automatically.
One real gotcha is documented here: the MITRE ATT&CK TAXII server connection timed out during testing this is an access restriction on their end, not a pipeline bug. The solution was to use sample data first to verify the pipeline works end-to-end, then switch to MISP as the live TAXII source.
2.1 Elasticsearch Index Design and STIX Ingestion
2.1.1 ECS-Aligned Index Mapping
Align with ECS threat.indicator.* fields to unlock Elastic Security’s native indicator match rules. The ip field type enables CIDR-range queries; geo_point enables Kibana Maps.
PUT threat-intel-indicators
{
“mappings”: { “properties”: {
“@timestamp”: { “type”: “date” },
“threat.indicator.type”: { “type”: “keyword” },
“threat.indicator.ip”: { “type”: “ip” },
“threat.indicator.domain”: { “type”: “keyword” },
“threat.indicator.geo.location”: { “type”: “geo_point” },
“threat.indicator.confidence”: { “type”: “keyword” },
“threat.feed.name”: { “type”: “keyword” }
} }
}
⚠️ Map geo_point BEFORE indexing any documents. Auto-mapping creates an ‘object’ type that Kibana Maps cannot use. If documents were indexed first, delete the index, recreate with explicit mapping, and re-run the pipeline.
2.1.2 TAXII Compatibility and Version Fix
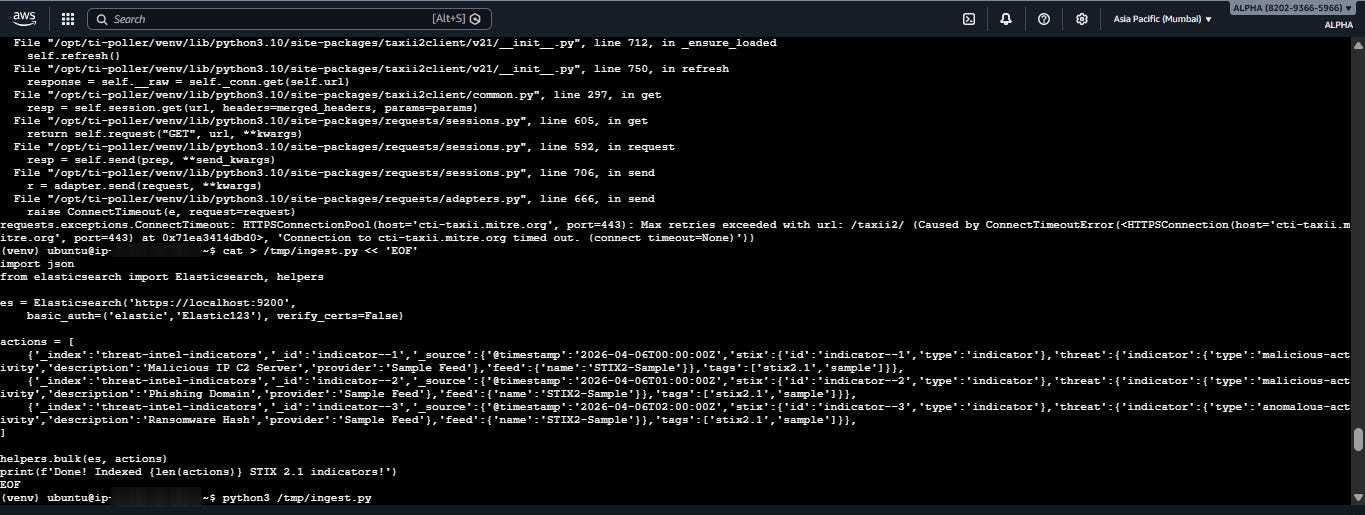
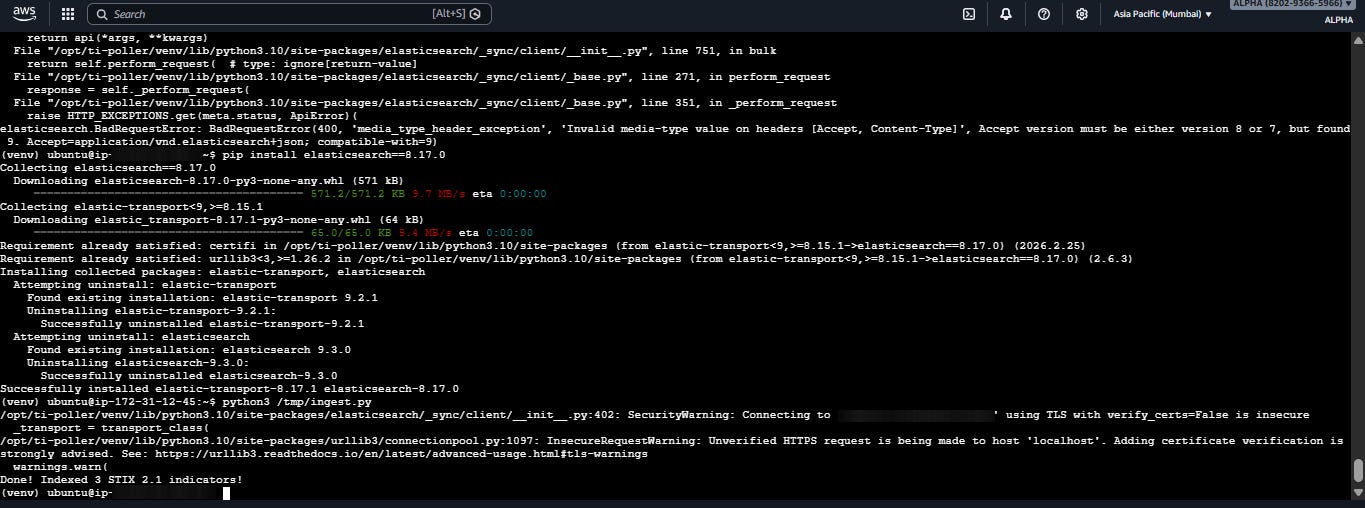
Initial test used the MITRE ATT&CK TAXII server connection timed out because MITRE restricts access. When switching to local sample data, an elasticsearch library version mismatch caused HTTP 400 errors.
2.1.3 Initial Test — Indexed 3 STIX 2.1 Indicators
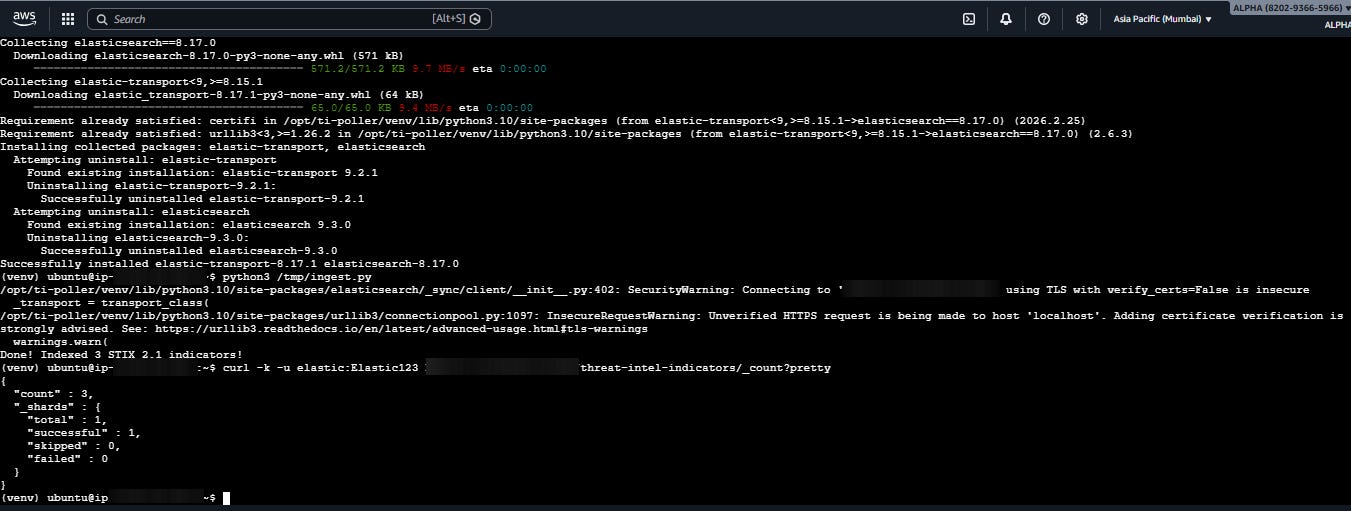
After fixing the library version, the ingestion script ran successfully and indexed 3 sample STIX 2.1 indicators.
2.1.4 GeoIP Ingest Pipeline
Set up a GeoIP ingest pipeline to automatically enrich IP indicators with geolocation data. The geo_point field must already be mapped in the index before this pipeline runs.
PUT _ingest/pipeline/threat-intel-geoip
{
“description”: “Enrich IP indicators with geolocation”,
“processors”: [{
“geoip”: {
“field”: “threat.indicator.ip”,
“target_field”: “threat.indicator.geo”,
“ignore_missing”: true,
“properties”: [“country_iso_code”,”country_name”,”city_name”,”location”]
}
}]
}
ℹ️ Elasticsearch uses bundled MaxMind GeoLite2 databases that auto-update every 3 days. The location field must be geo_point in the mapping — it cannot be auto-detected and will silently fail if the mapping is wrong.
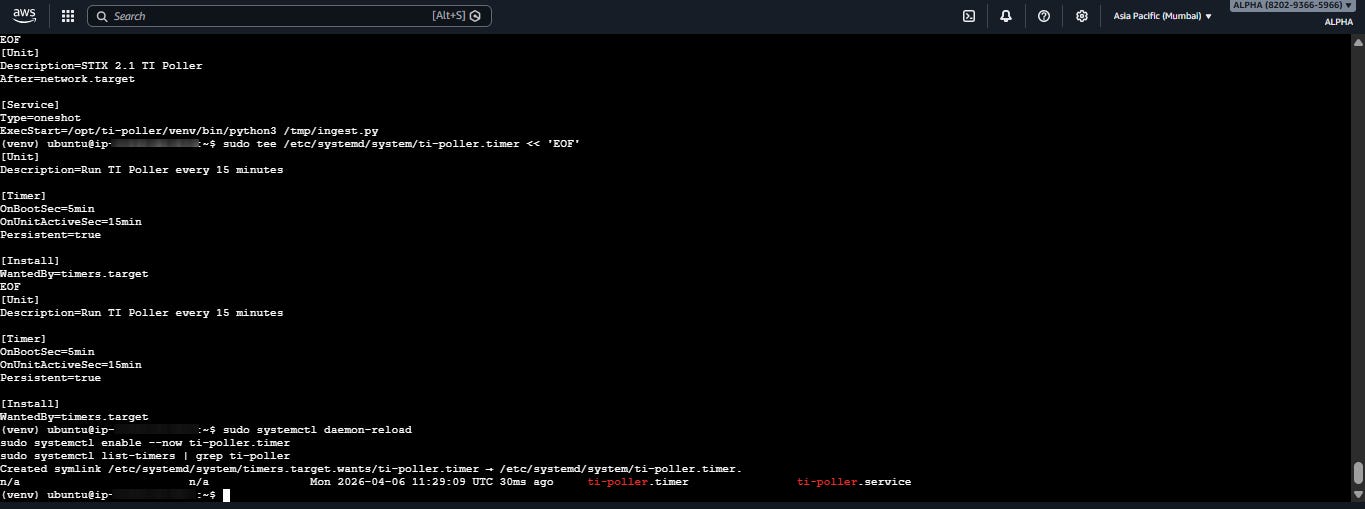
2.1.5 systemd Timer for Automated Polling
A systemd timer was set up to replace cron for pipeline scheduling better logging, dependency management, and persistent catch-up.
2.2 Kibana Data View and Dashboard Construction
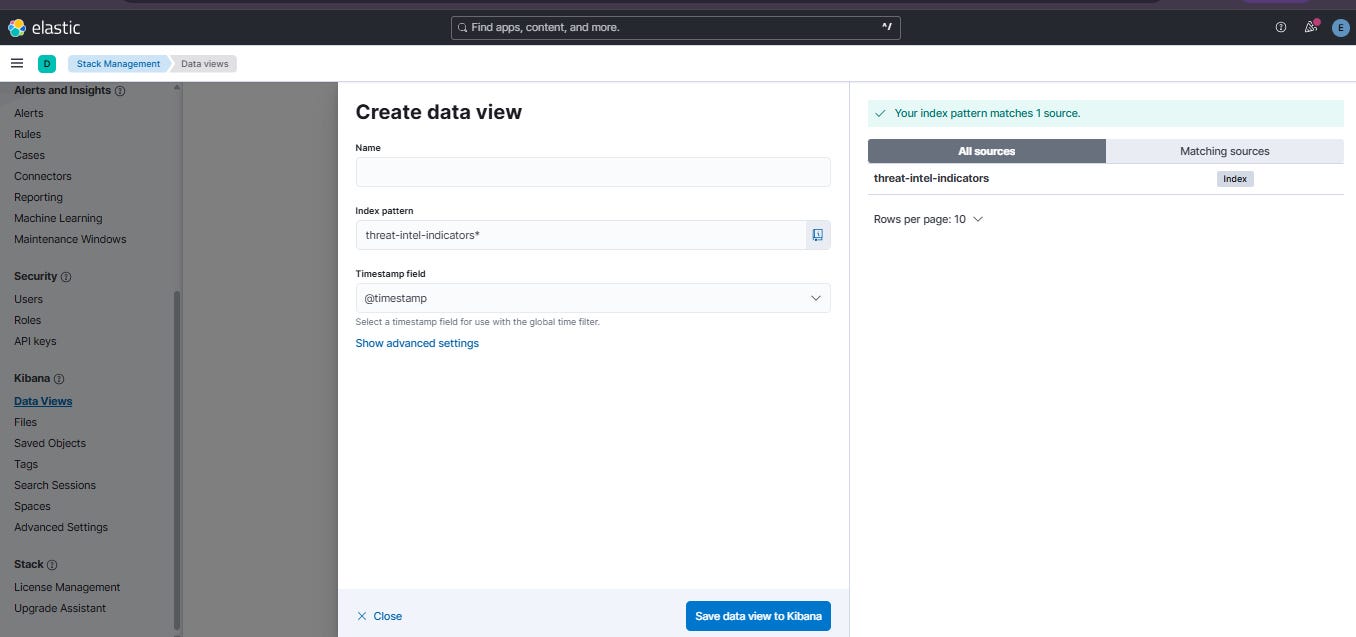
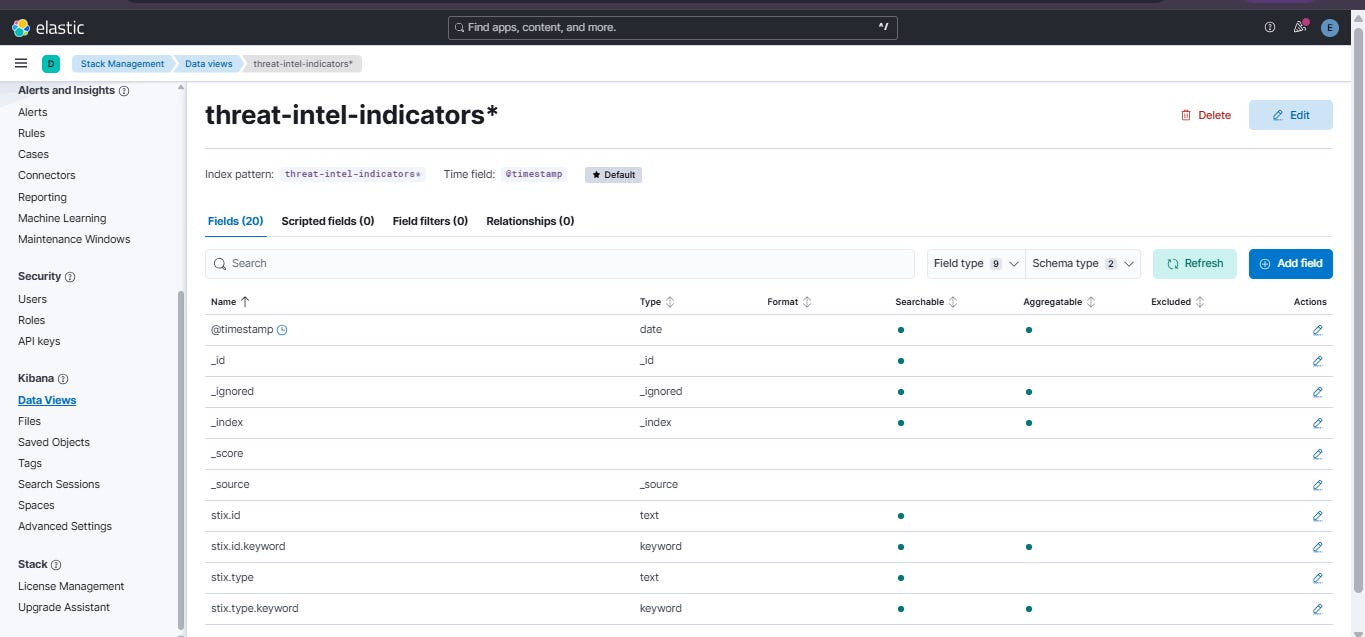
*2.2.1 Create Data View (threat-intel-indicators)**
Stack Management → Data Views → Create data view. Index pattern: threat-intel-indicators*. Time field: @timestamp. This enables Kibana’s time picker for all visualizations.
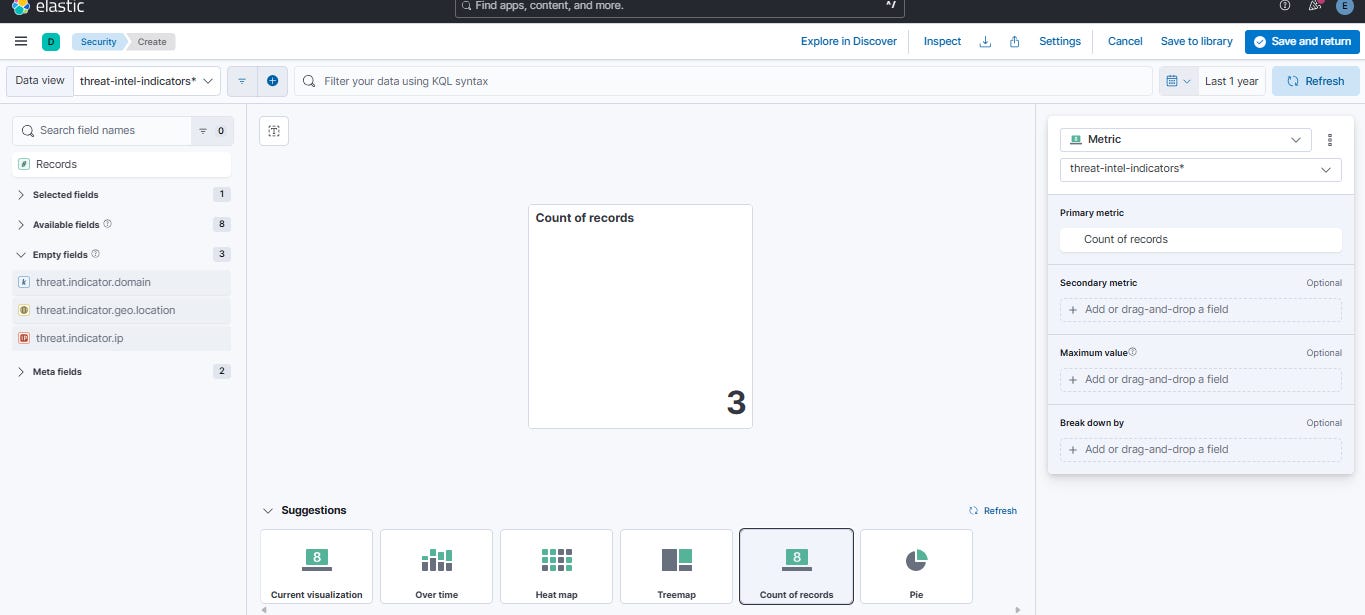
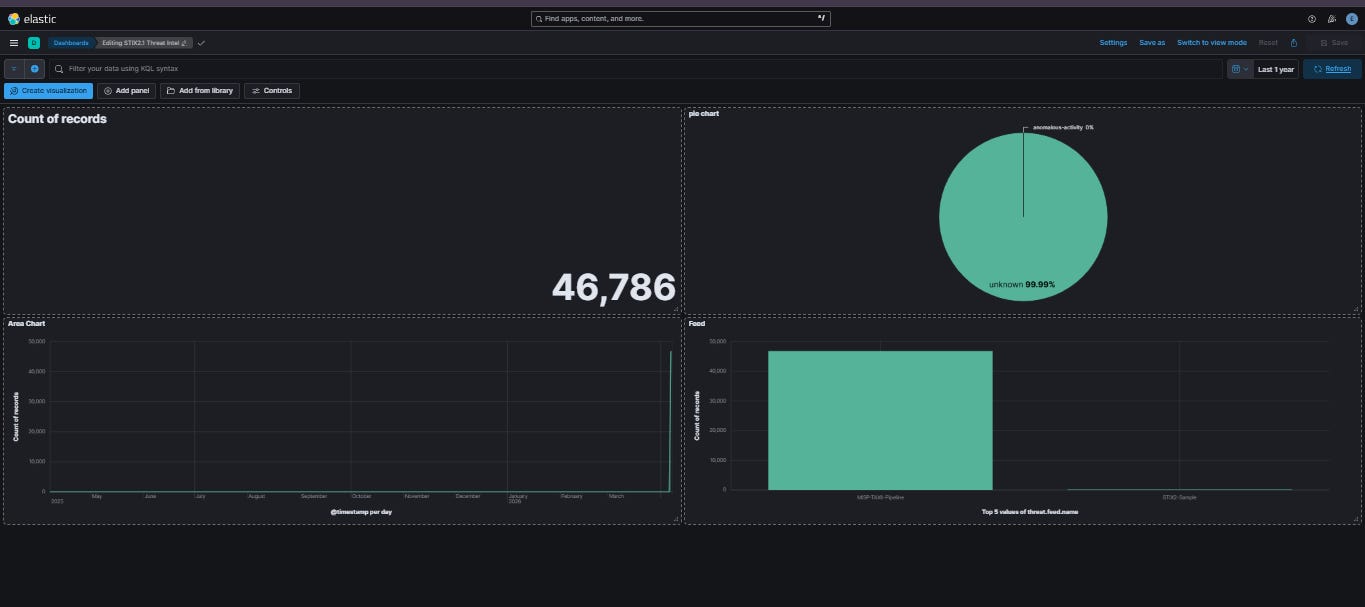
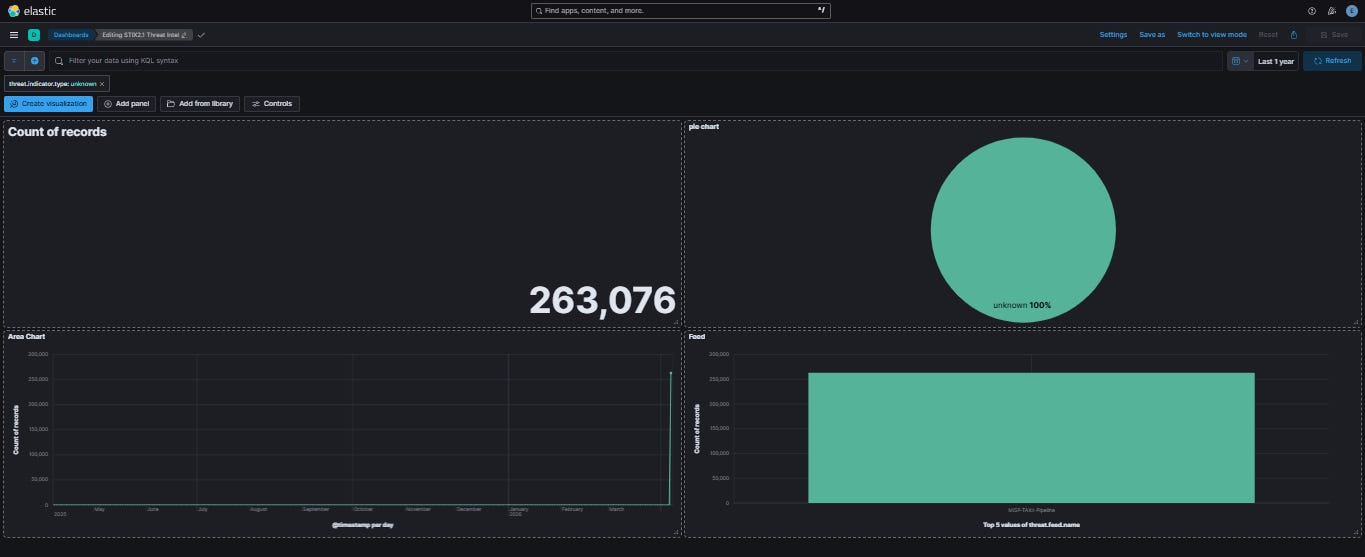
2.2.2 Panel 1 — Total IOC Count (Metric)
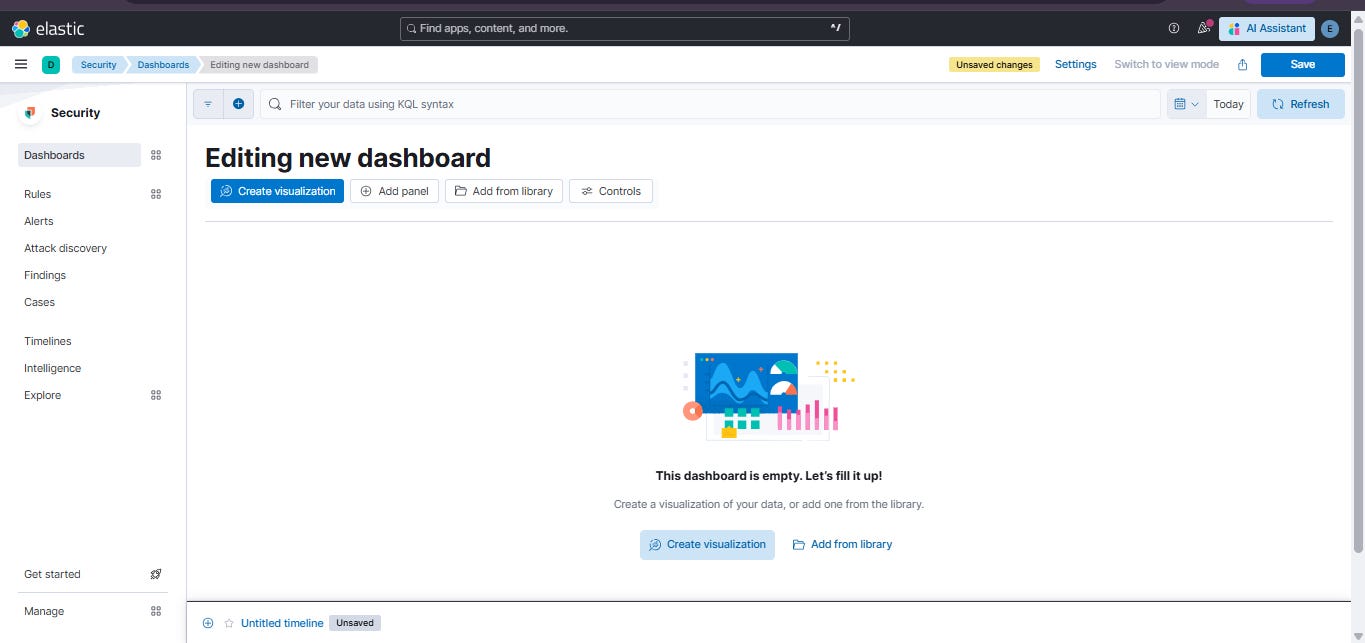
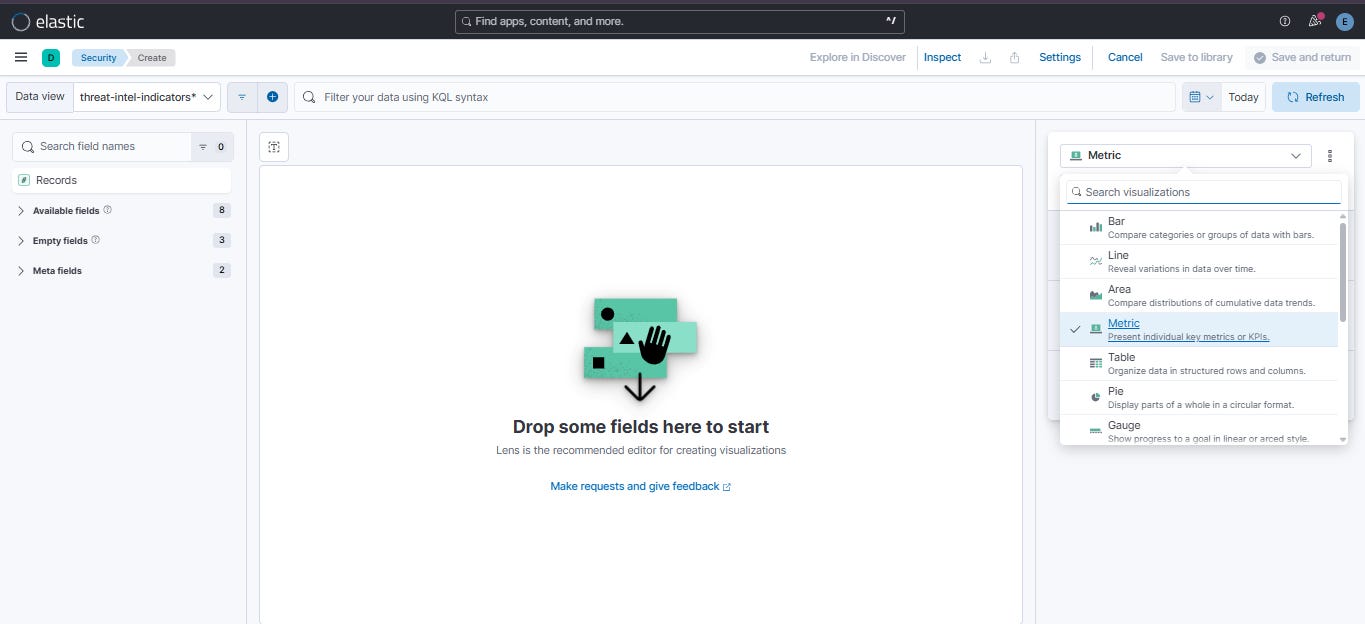
Security → Dashboards → Create dashboard → Create visualization → Select Metric type. Drag Records to Primary metric. This shows the live total count of all indexed indicators.
2.2.3 Panel 2 — IOC Type Distribution (Pie)
Create visualization → Pie type. Slice by: Top 5 values of threat.indicator.type. This shows proportional split across IP, domain, hash, URL types.
(Pie chart panel configuration follows same Kibana Lens workflow as the bar chart shown below)
2.2.4 Panel 3 — Timeline (Area Chart)
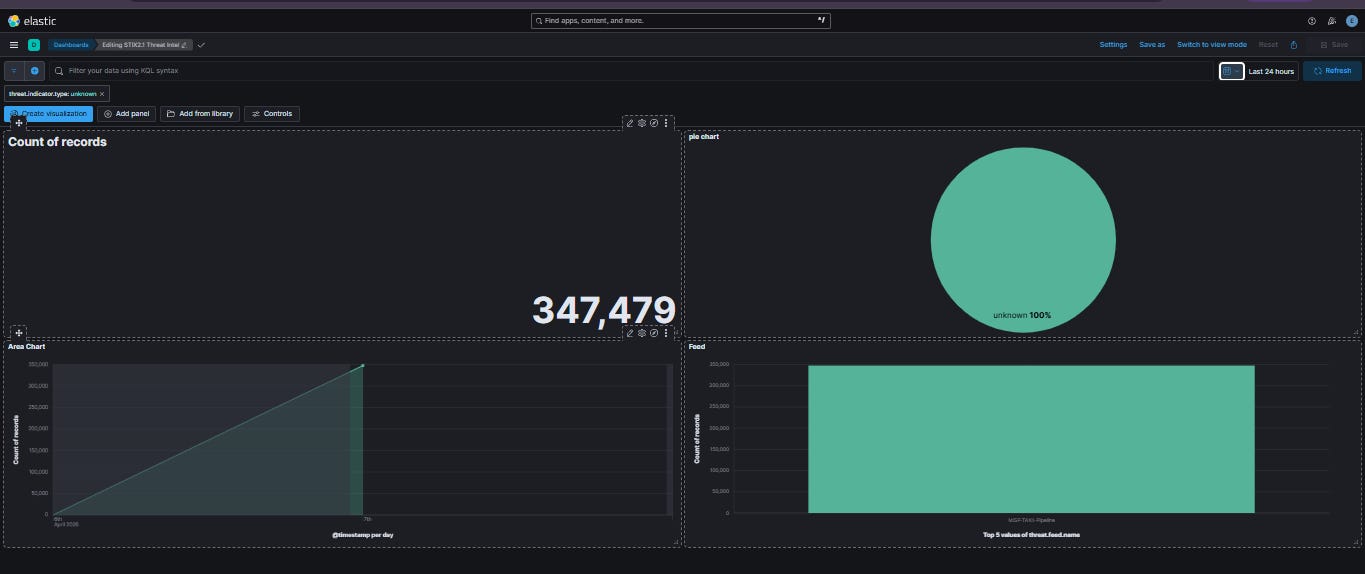
Create visualization → Line/Area type. X-axis: @timestamp (date histogram, daily). Y-axis: Count of records. Breakdown by: threat.feed.name. Reveals feed activity spikes.
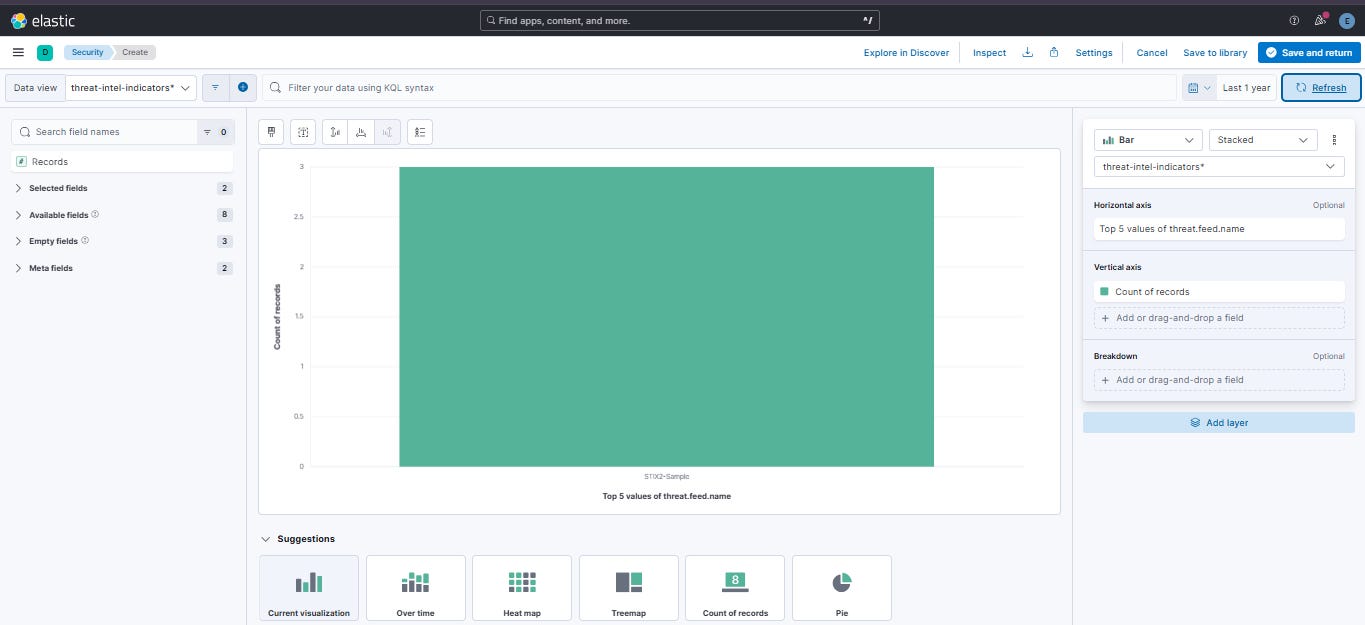
2.2.5 Panel 4 — Feed Breakdown (Bar Chart)
Create visualization → Bar type. Horizontal axis: Top 5 values of threat.feed.name. Vertical axis: Count of records.
2.2.6 Explore in Discover
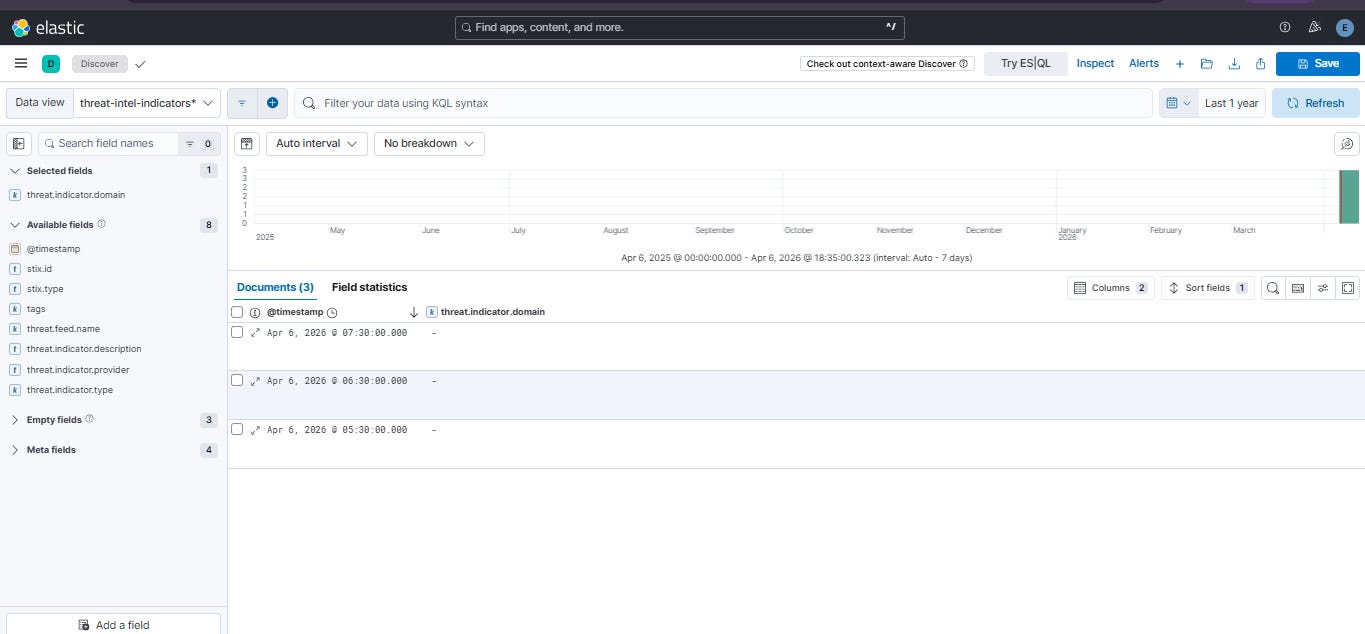
Set time range to Last 1 year. Navigate to Discover and select the threat-intel-indicators* data view to see all indexed indicators with their ECS fields.
2.2.7 Save Under Security Solution Tag
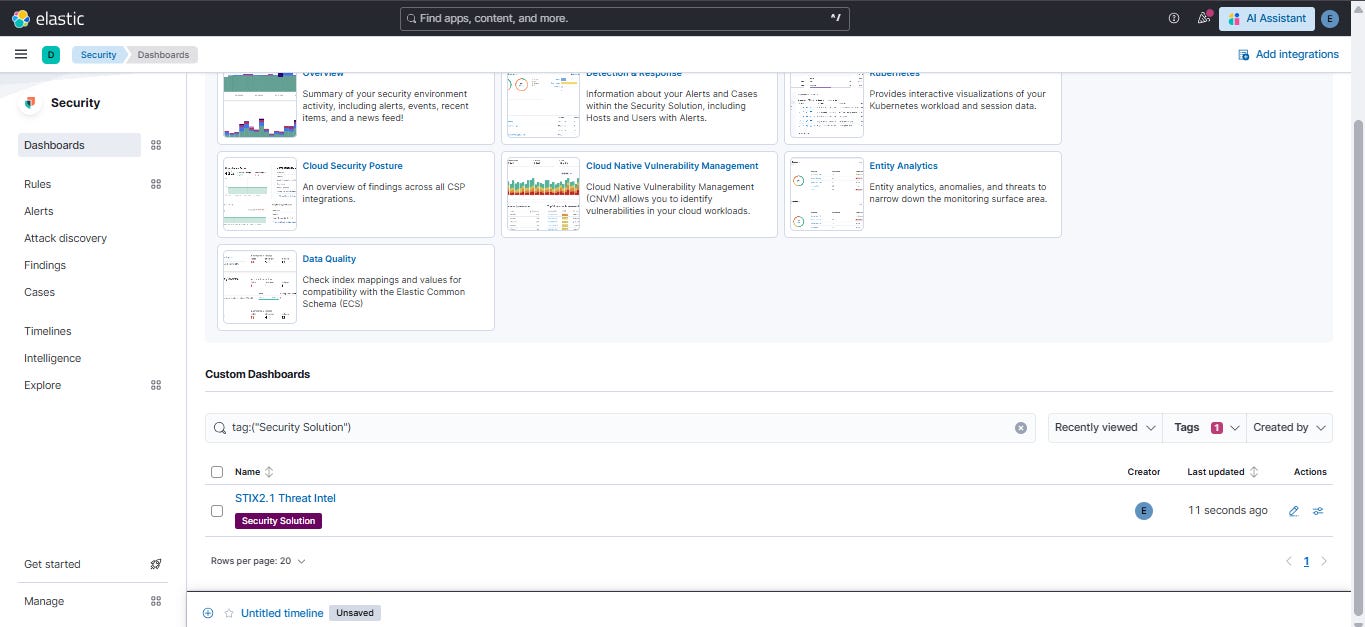
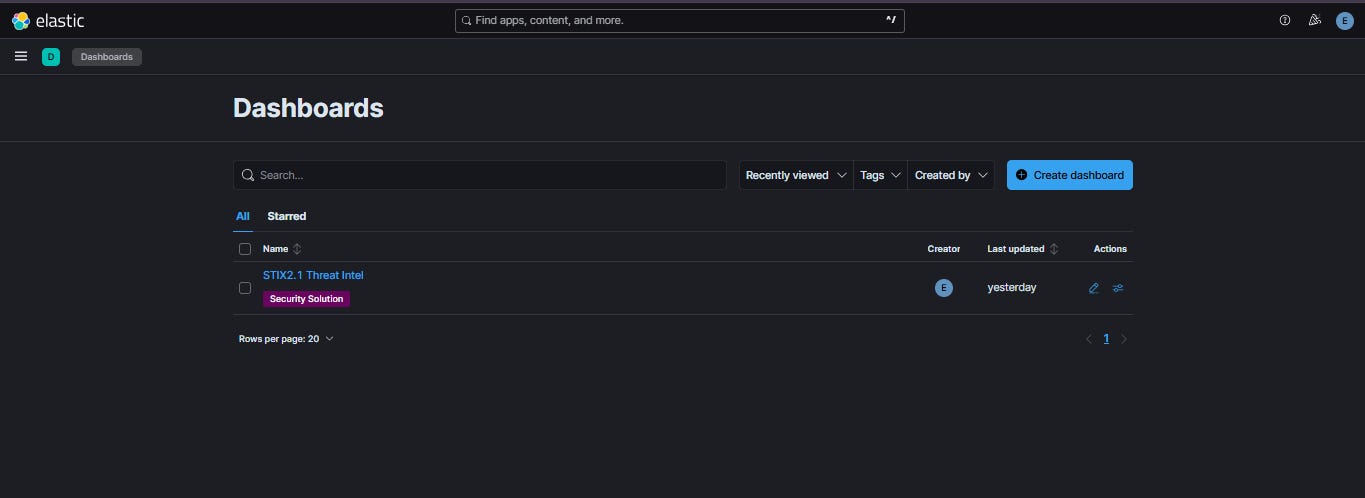
When saving the dashboard, add the tag ‘Security Solution’. The dashboard then appears in Security → Dashboards alongside built-in Elastic Security dashboards.
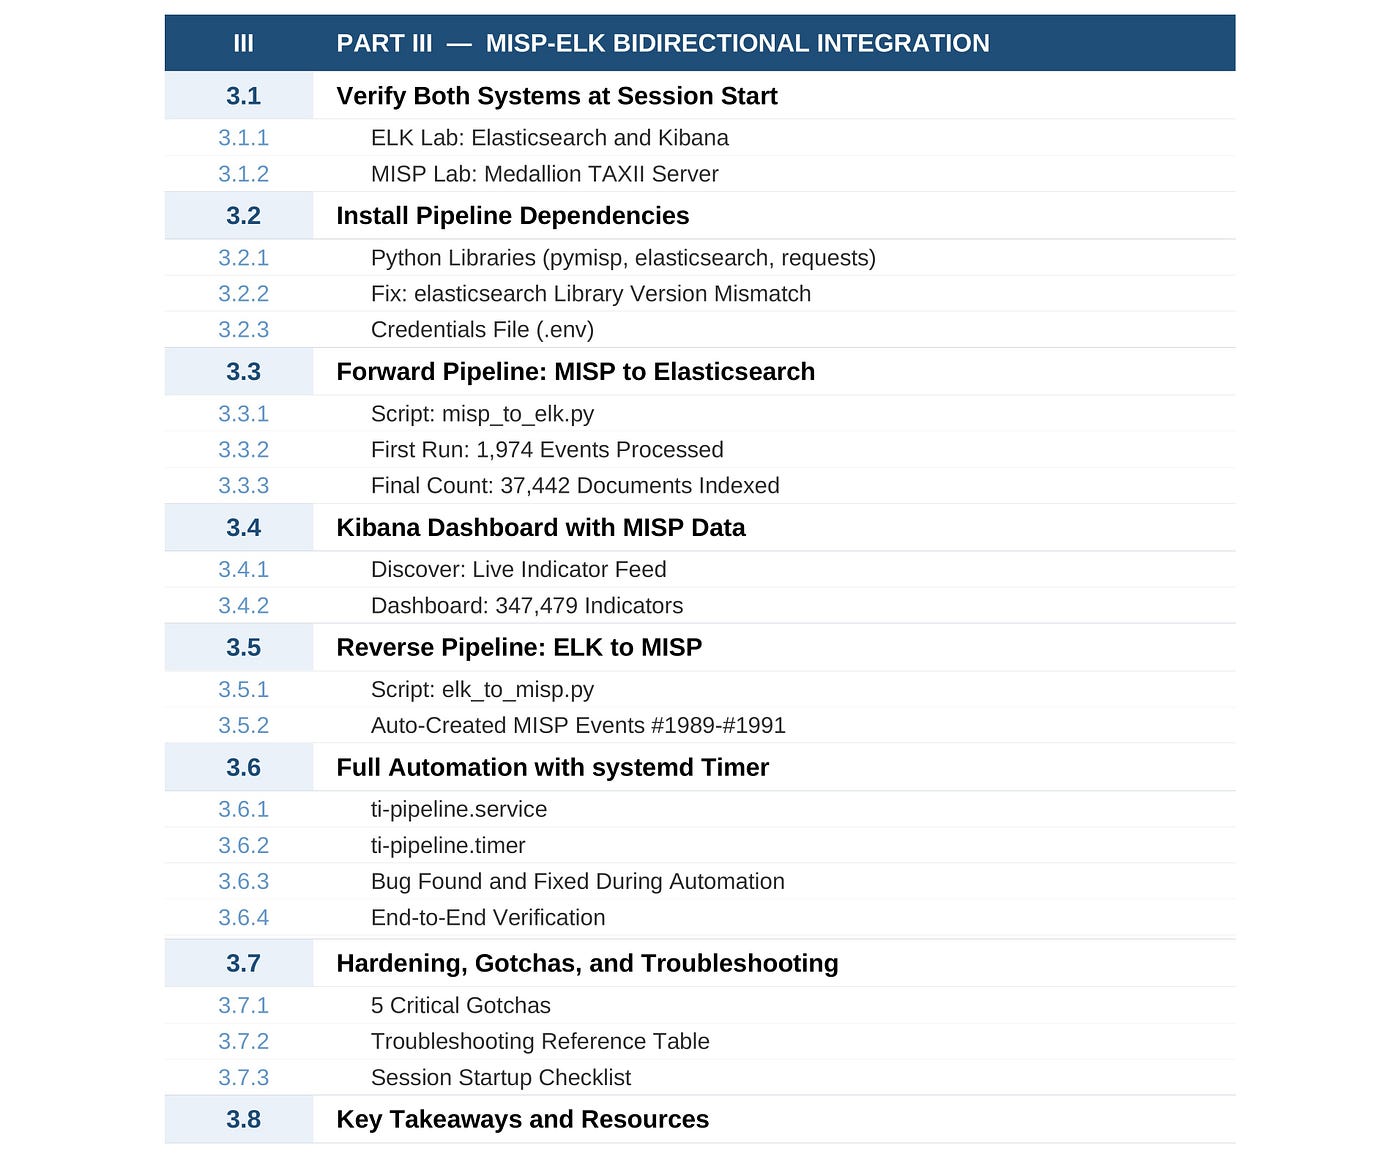
PART 3 — MISP-\ELK BIDIRECTIONAL INTEGRATION
MISP 2.5 Bidirectional ELK Pipeline
Forward · Reverse · Automation · 347,479 Indicators · MISP Events #1989–1991
3.1. Verify Both Systems at Session Start
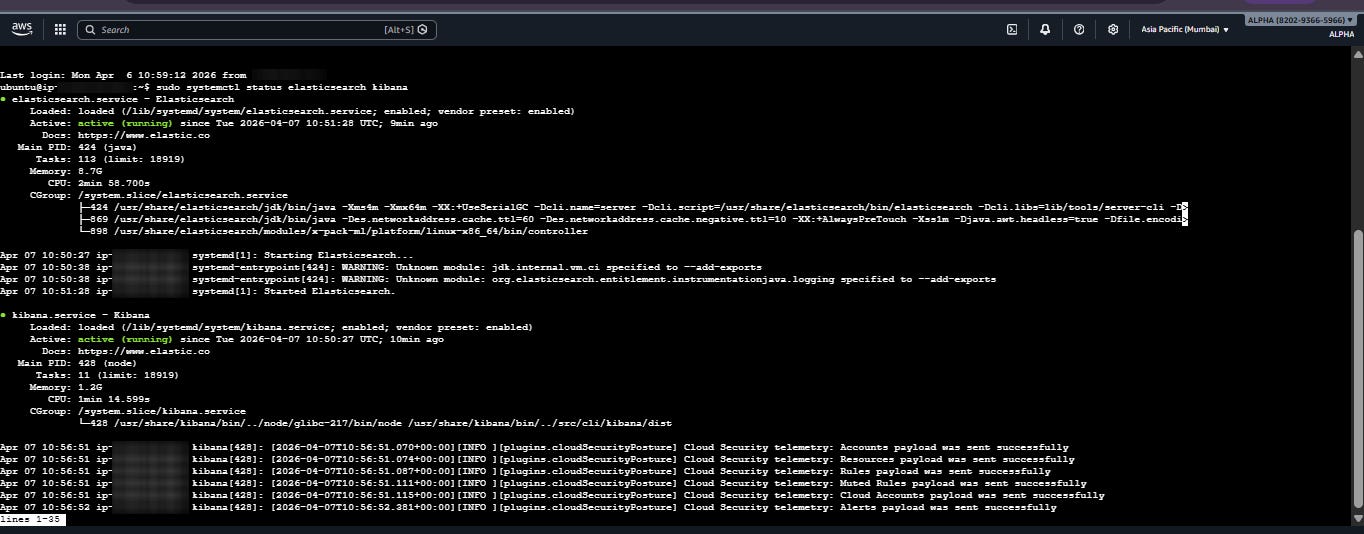
3.1.1 ELK Lab Elasticsearch and Kibana
sudo systemctl status elasticsearch kibana
curl -k -u elastic:Elastic123 https://localhost:9200/_cluster/health?pretty
3.1.2 MISP Lab Medallion TAXII Server
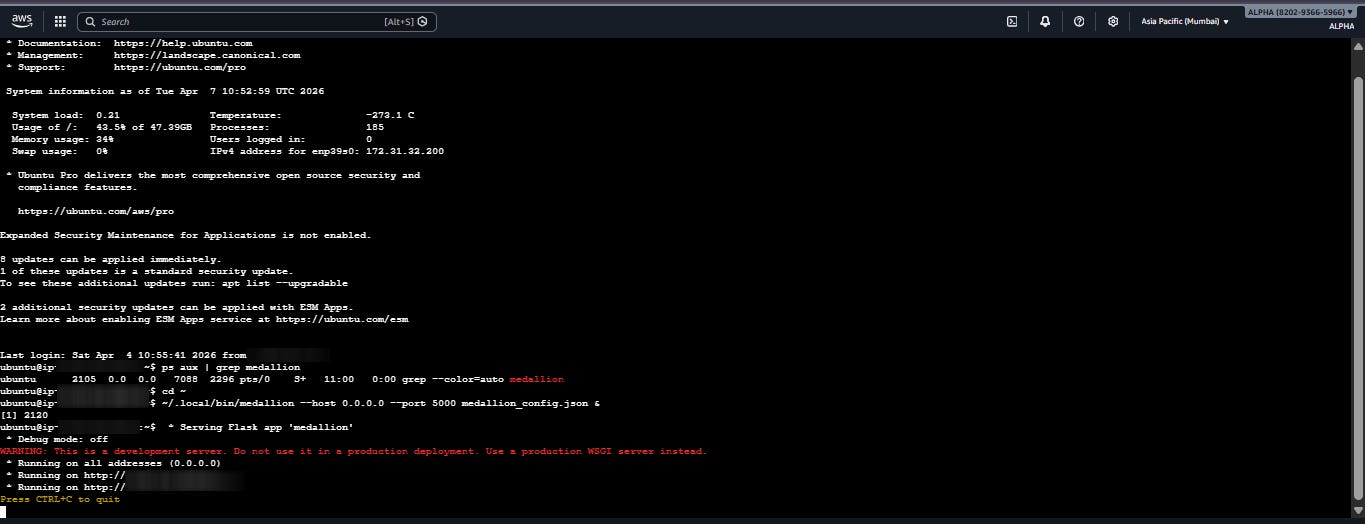
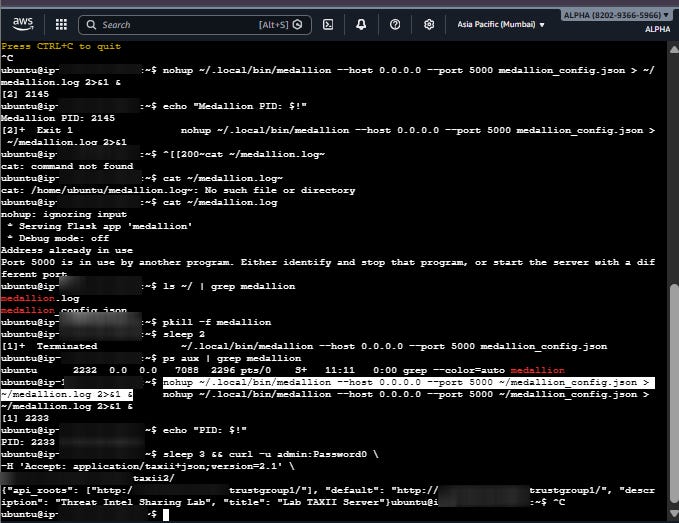
Medallion must be started manually every session — it is NOT a systemd service.
pkill -f medallion 2>/dev/null; sleep 2
nohup ~/.local/bin/medallion — host 0.0.0.0 — port 5000 ~/medallion_config.json > ~/medallion.log 2>&1 &
curl -u admin:Password0 -H ‘Accept: application/taxii+json;version=2.1’ http://localhost:5000/taxii2/
3.2 Install Pipeline Dependencies
3.2.1 Python Libraries
Install the three Python libraries the forward and reverse pipelines rely on: pymisp to talk to the MISP REST API, elasticsearch for bulk indexing, and requests for raw HTTP calls.
pip3 install pymisp elasticsearch requests
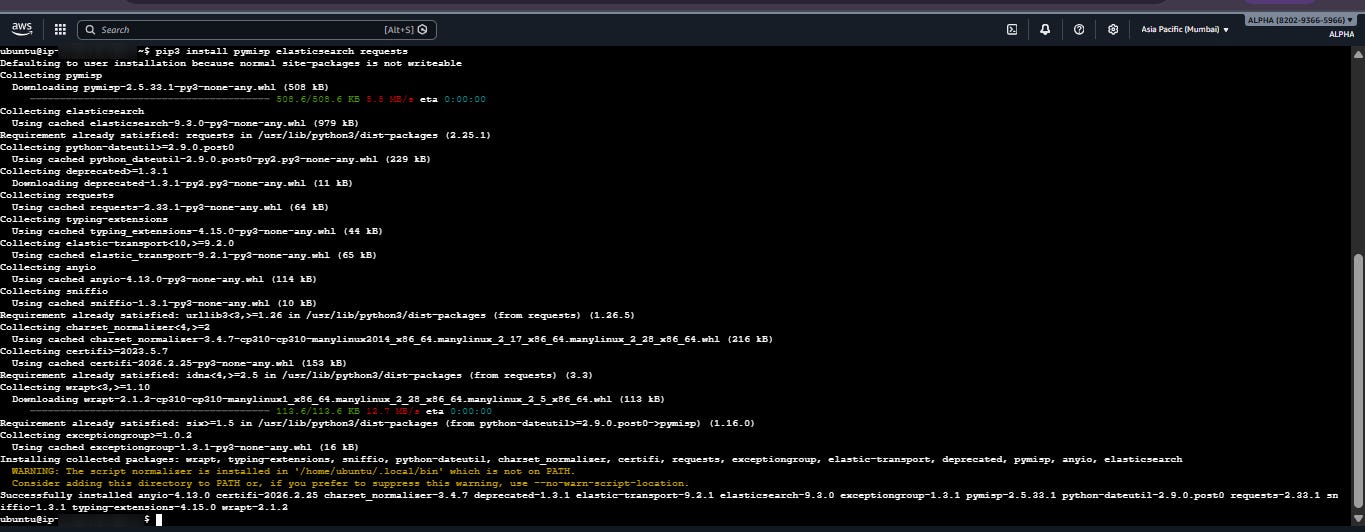
If you see a media_type_header_exception (HTTP 400) when the pipeline first runs, it means the elasticsearch-py library version is too new. Fix by downgrading to match the server version:
pip install elasticsearch==8.17.0
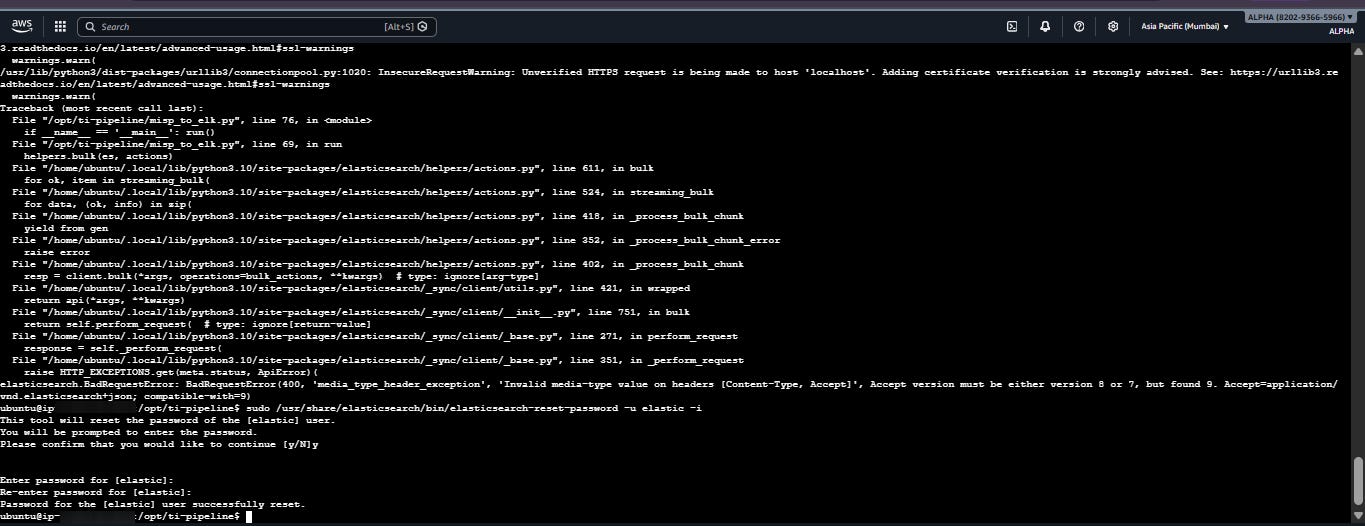
3.2.2 Fix — elasticsearch Library Version Mismatch
If the pipeline produces a BadRequestError HTTP 400 ‘media_type_header_exception’, the elasticsearch-py client version is incompatible with the server. Fix by pinning to the matching version:
pip install elasticsearch==8.17.0
⚠️ This version mismatch happens because pip installs the latest elasticsearch library (9.x) which sends a different Accept header than Elasticsearch 8.x expects. Always pin to elasticsearch==8.17.0 for ES 8.x servers.
3.2.3 Credentials File (.env)
sudo mkdir -p /opt/ti-pipeline && sudo chown ubuntu:ubuntu /opt/ti-pipeline
sudo tee /opt/ti-pipeline/.env << ‘EOF’
MISP_URL=https://3.111.190.100
MISP_KEY=<your-misp-api-key>
TAXII_URL=http://3.111.190.100:5000
TAXII_USER=admin
TAXII_PASS=Password0
ES_URL=https://localhost:9200
ES_USER=elastic
ES_PASS=Elastic123
EOF
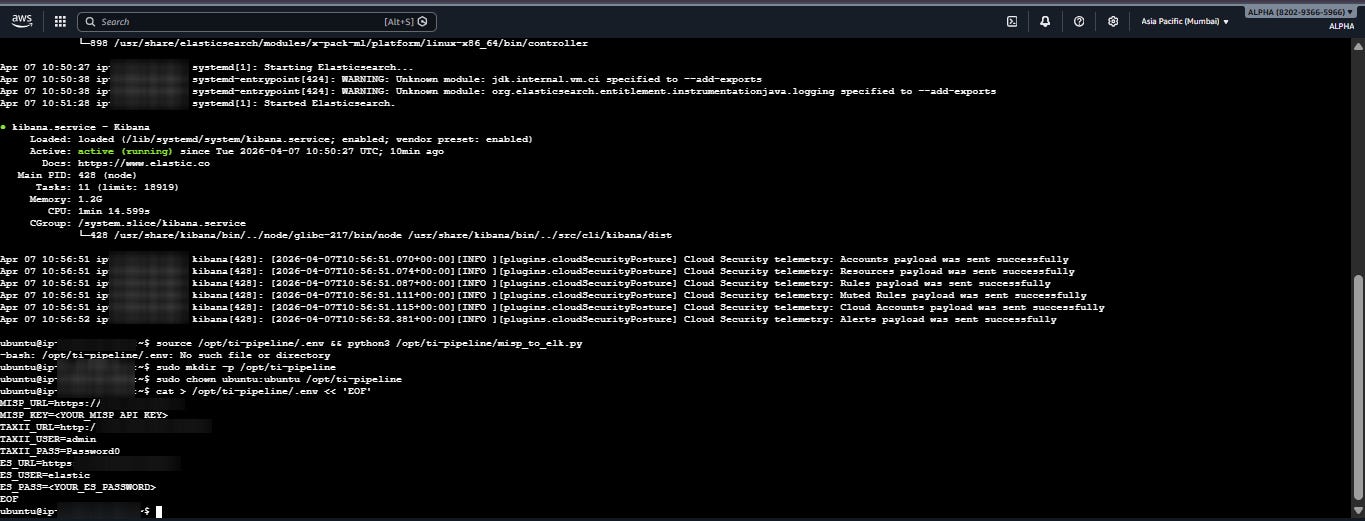
3.3 Forward Pipeline — MISP to Elasticsearch
3.3.1 Script: misp_to_elk.py
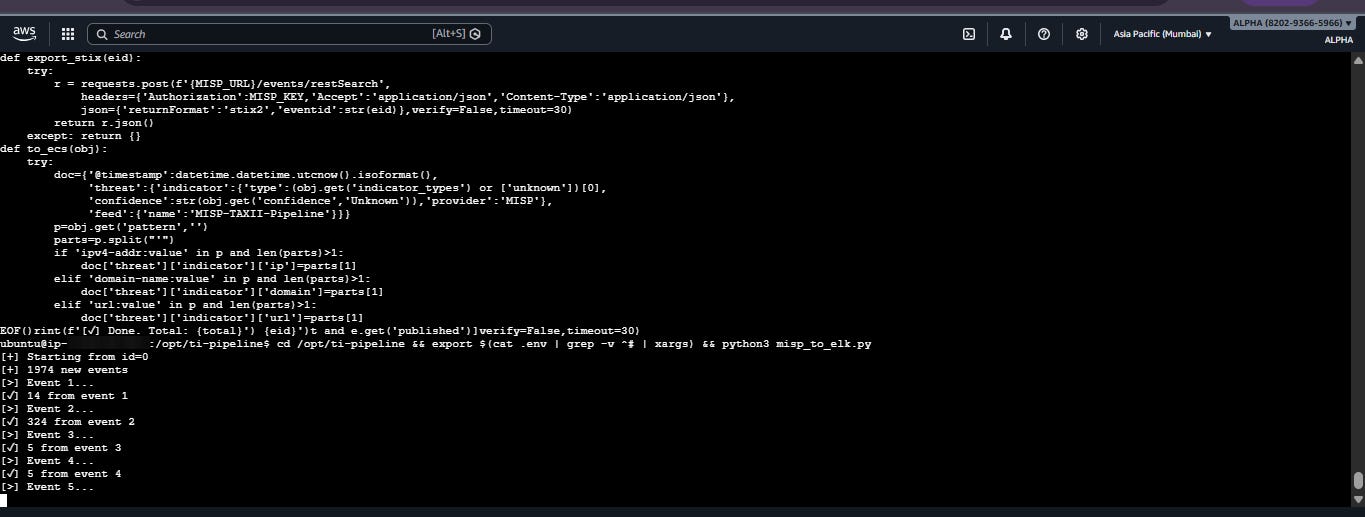
The script reads last_id.txt, queries MISP for new published events, exports each as STIX 2.1 via restSearch, maps to ECS fields, and bulk-indexes into Elasticsearch.
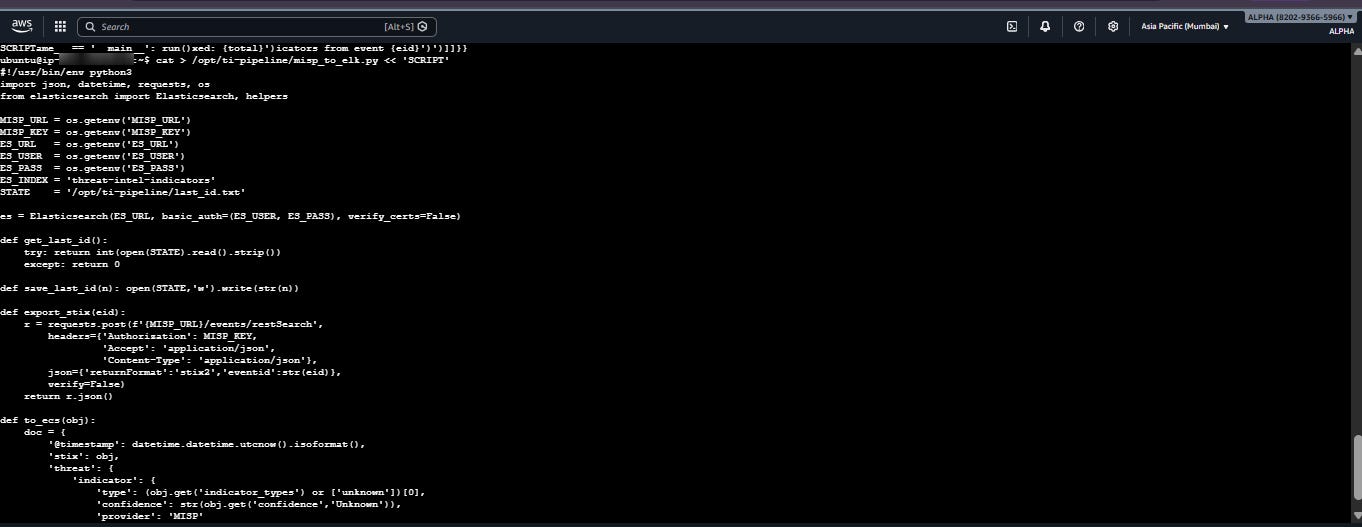
First run of misp_to_elk.py hit a BadRequestError elasticsearch library version 9.3.0 was incompatible with ES 8.x. Fix: downgrade to elasticsearch==8.17.0, then reset ES password.
⚠️ Critical bug in timer context: MISP API returns a dict when called by systemd but a list during manual runs. Fix: raw = r.json(); events = raw if isinstance(raw,list) else raw.get(‘response’,[])
3.3.2 First Run — 1,974 Events Processed
echo ‘0’ > /opt/ti-pipeline/last_id.txt
cd /opt/ti-pipeline && export $(cat .env | grep -v ^# | xargs) && python3 misp_to_elk.py
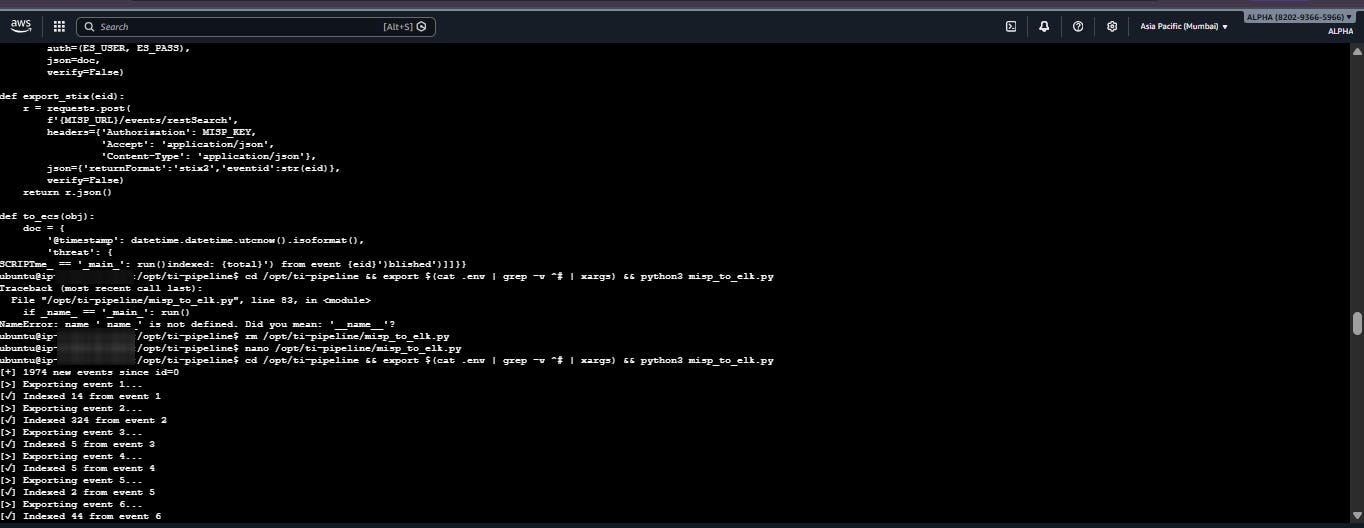
3.3.3 Final Count — 37,442 Documents Indexed
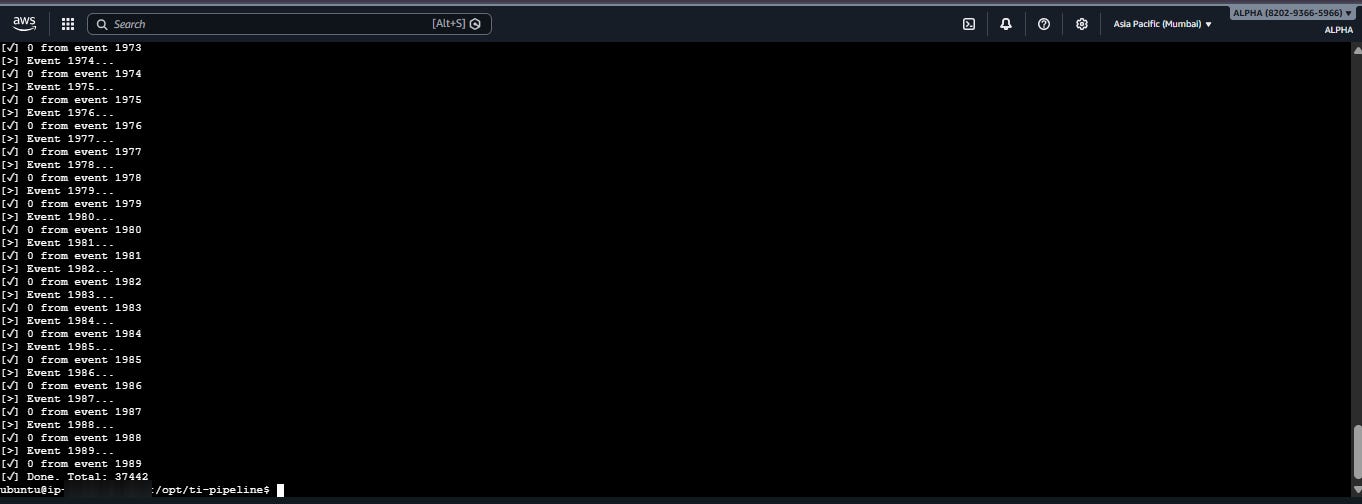
The pipeline processed 1,974 MISP events in a single run iterating through each one, calling the restSearch STIX 2.1 export endpoint, parsing the response, mapping each indicator to ECS fields, and bulk-indexing them. The state file (last_id.txt) means subsequent runs only process new events, not all 1,974 again.
curl -k -u elastic:Elastic123 https://localhost:9200/threat-intel-indicators/_count
3.4 Kibana Dashboard with MISP Data
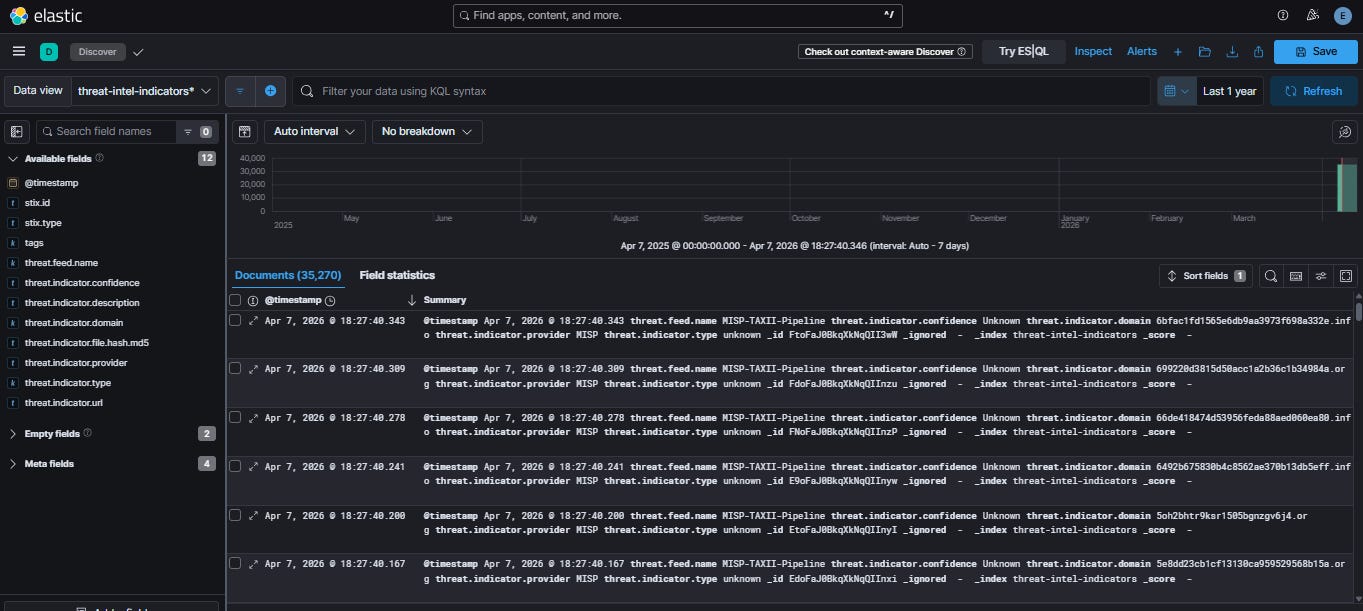
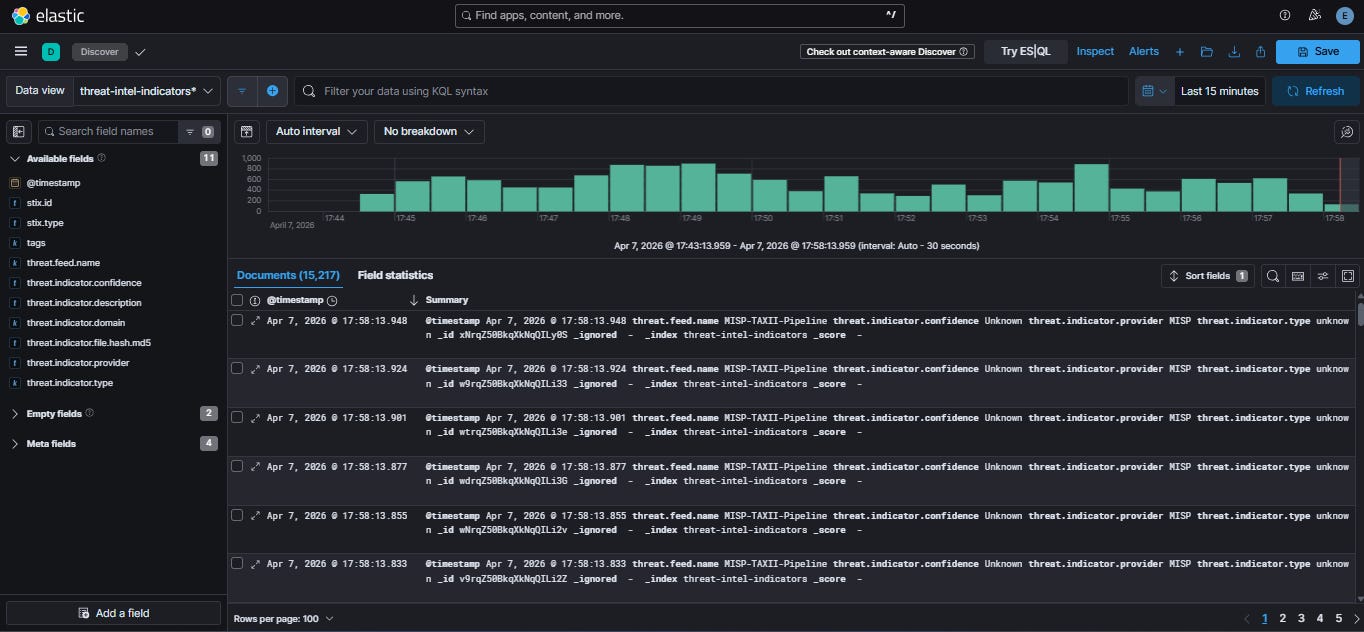
3.4.1 Discover — Live Indicator Feed
Open Kibana → Discover. Set time range to Last 1 year to see all historical data. Set to Last 15 minutes during active pipeline runs to see live ingestion.
3.4.2 Dashboard — 347,479 Indicators
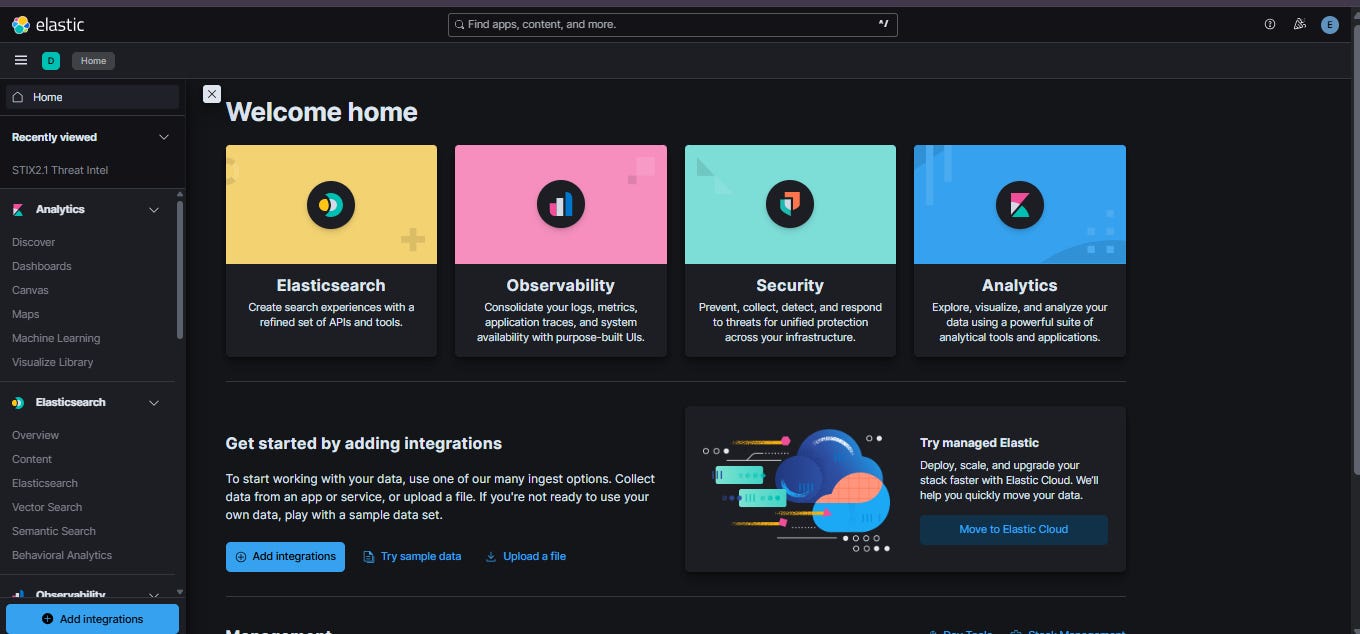
3.5 Reverse Pipeline — ELK to MISP
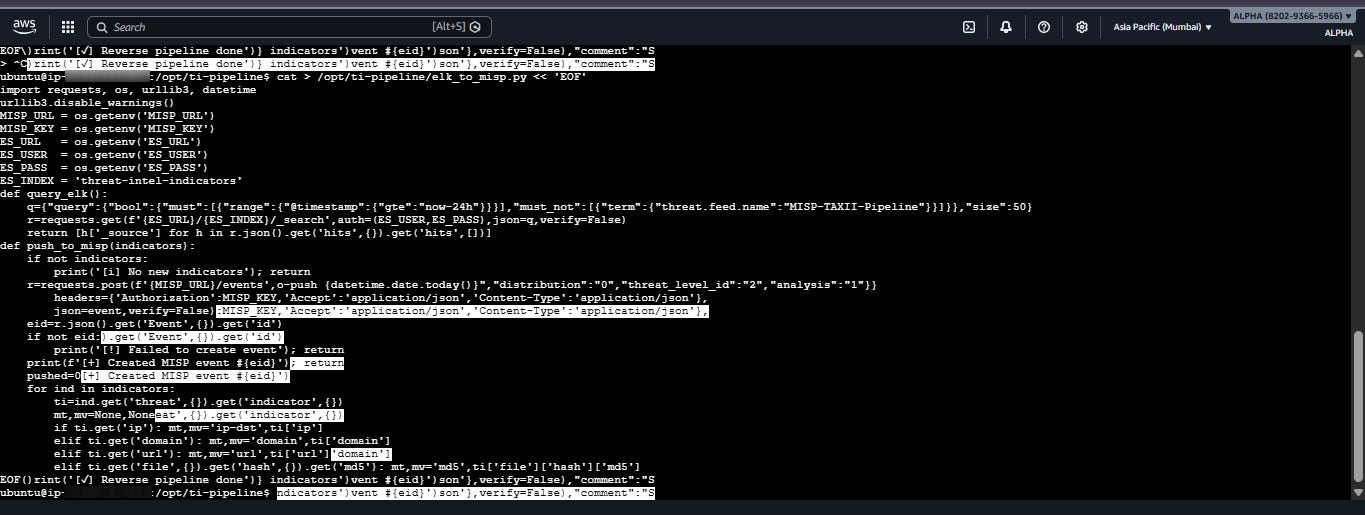
3.5.1 Script: elk_to_misp.py
Queries Elasticsearch for recent indicators and pushes them back to MISP as new events tagged tlp:green. Closes the bidirectional intelligence loop.
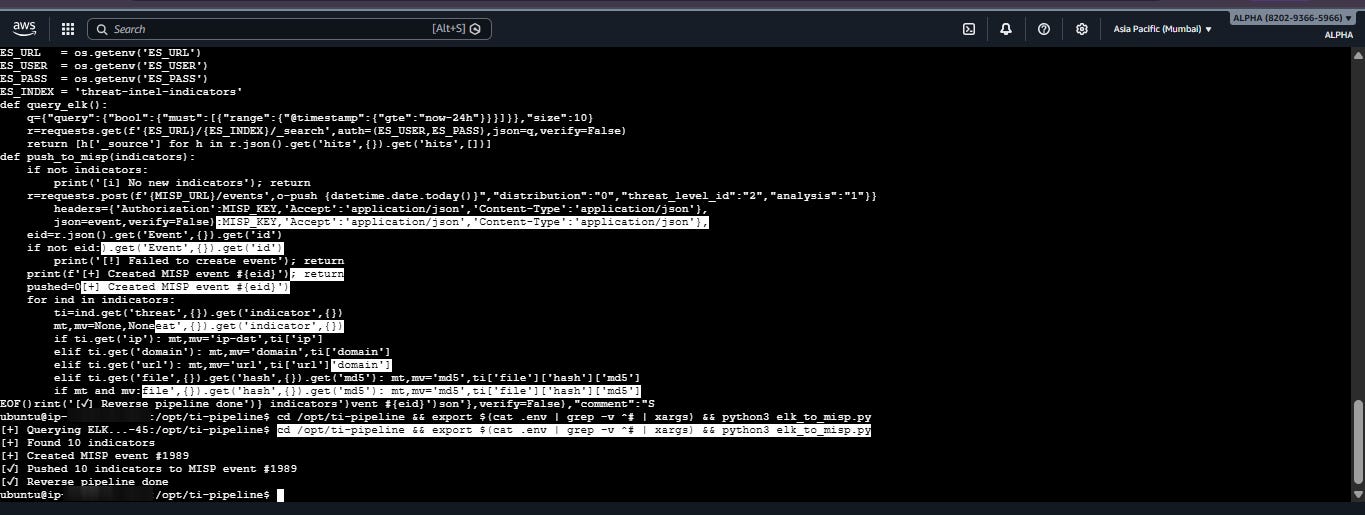
cd /opt/ti-pipeline && export $(cat .env | grep -v ^# | xargs) && python3 elk_to_misp.py
3.5.2 Auto-Created MISP Events #1989-#1991
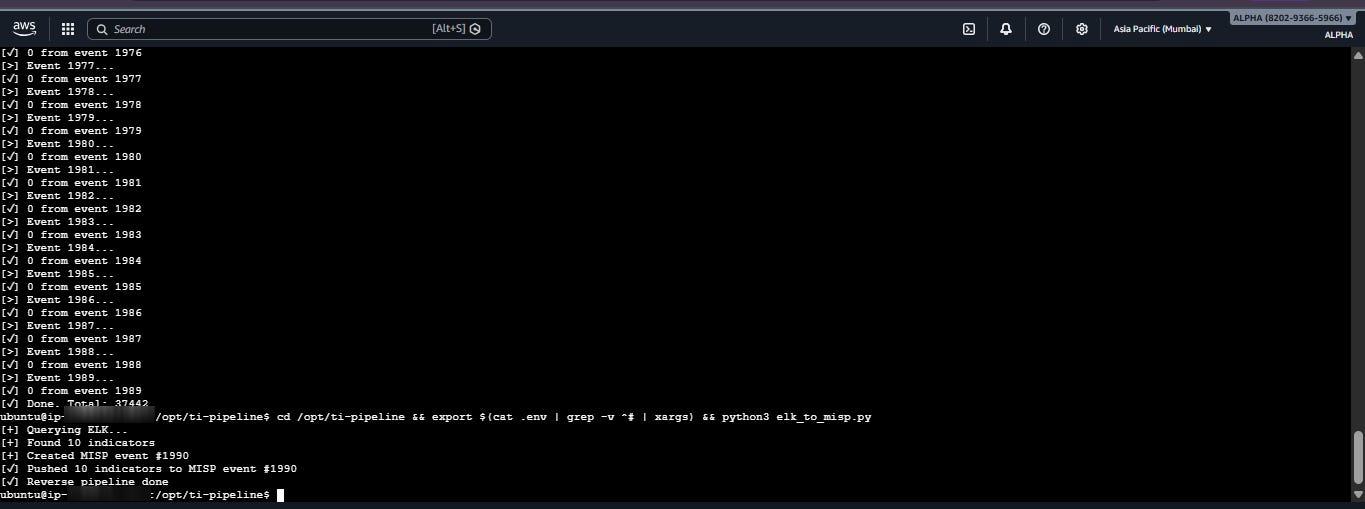
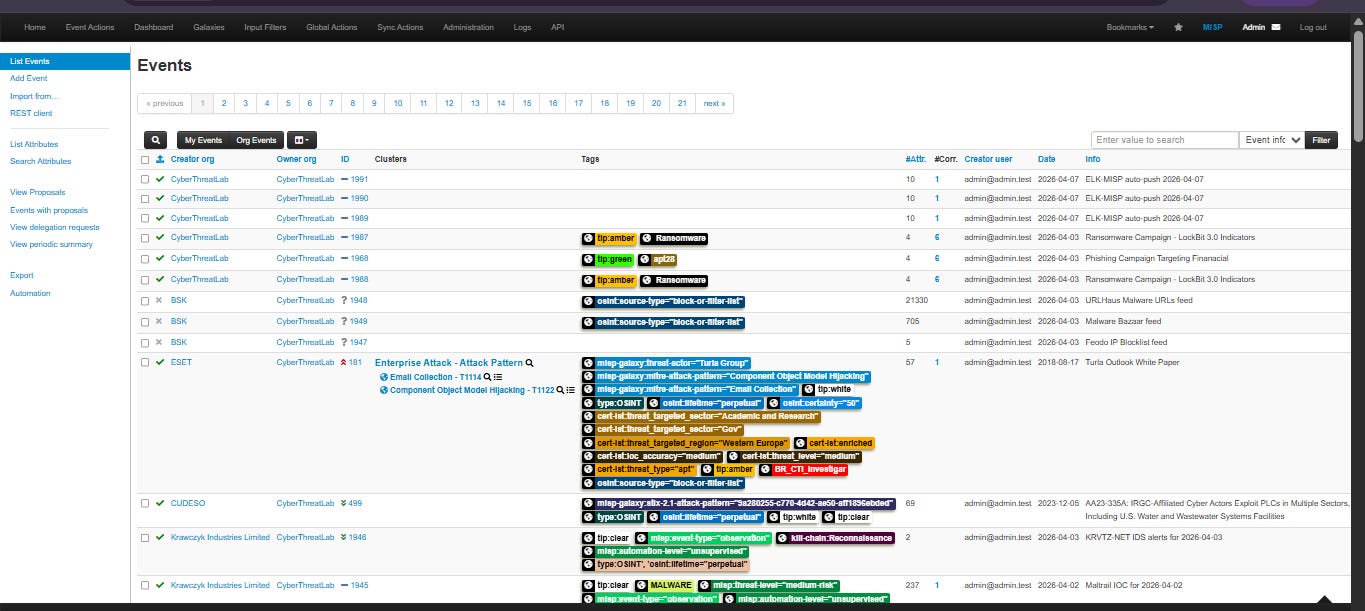
This is the moment the loop closes. Events that started in MISP got indexed in Elasticsearch then Elasticsearch pushed indicators back into MISP as new events. A threat analyst working in MISP would see #1989, #1990, and #1991 as fresh intelligence without knowing they came from their own platform via ELK.
⚠️ Circular loop prevention: In production, add a must_not filter to exclude indicators that originated from MISP-TAXII-Pipeline. Remove the filter for initial testing otherwise 0 indicators are found.
3.6 Full Automation with systemd Timer
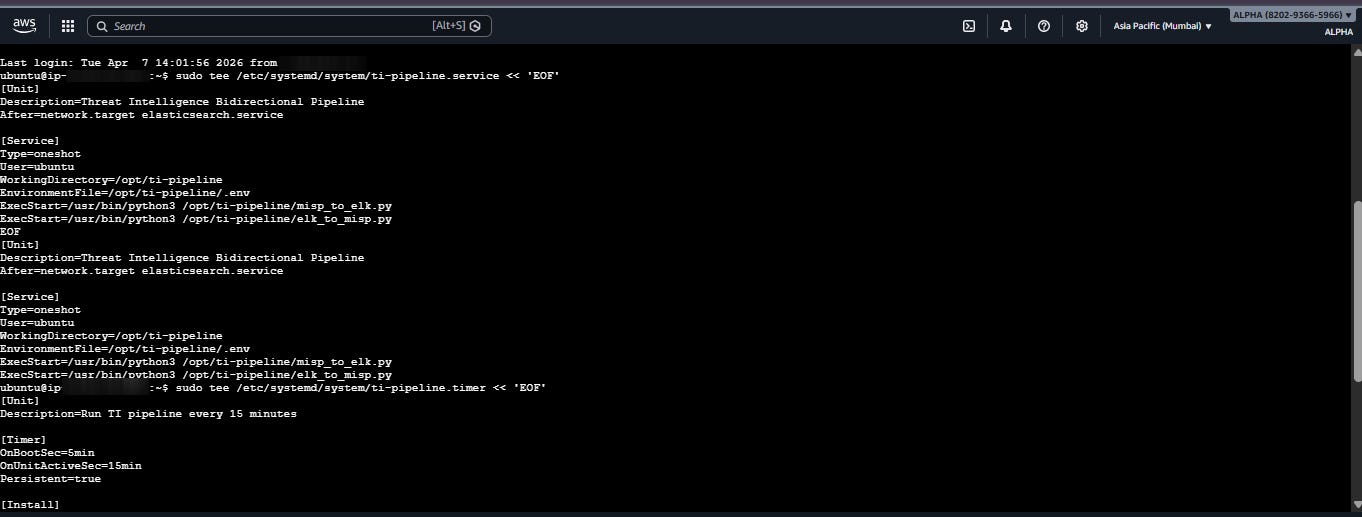
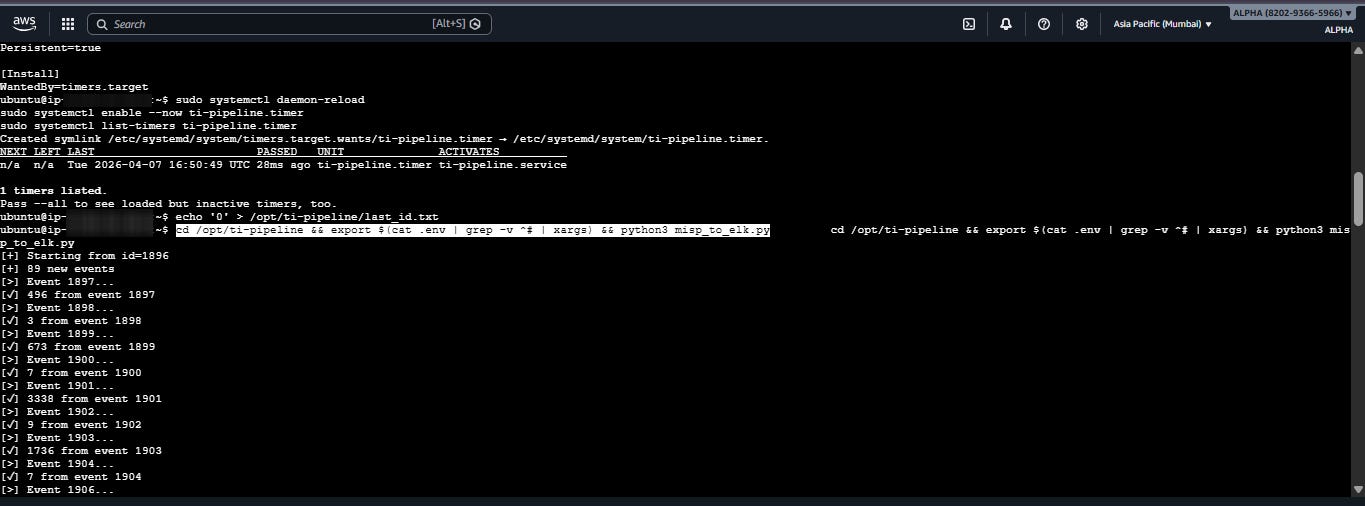
3.6.1 ti-pipeline.service
The systemd service unit defines what runs on each invocation: both misp_to_elk.py and elk_to_misp.py execute inside the Python venv, with credentials loaded from the .env file.
3.6.2 ti-pipeline.timer
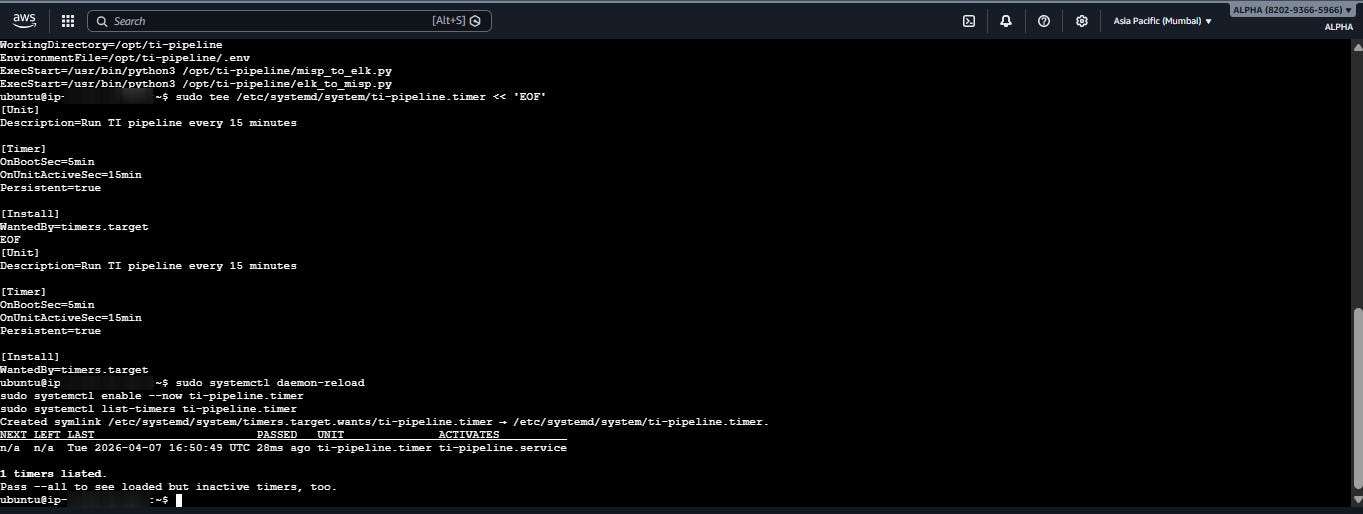
sudo systemctl daemon-reload
sudo systemctl enable — now ti-pipeline.timer
sudo systemctl list-timers ti-pipeline.timer # Verify schedule
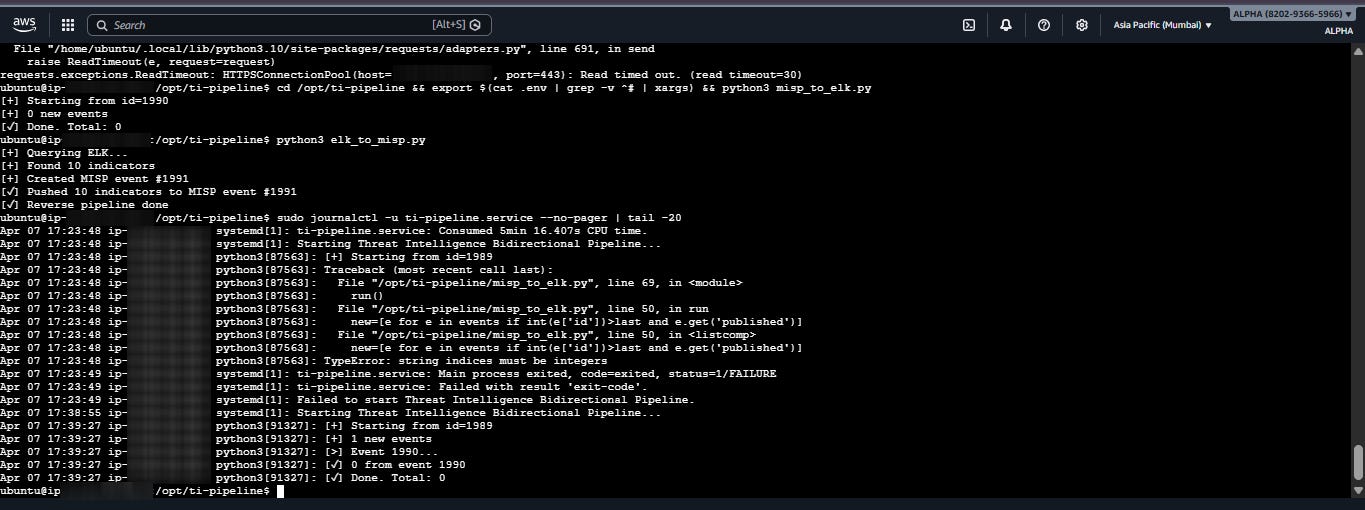
3.6.3 Bug Found and Fixed During Automation
First automated timer run produced TypeError: string indices must be integers. Root cause: MISP API wraps response in a dict when called from systemd context, but returns a list during manual runs.
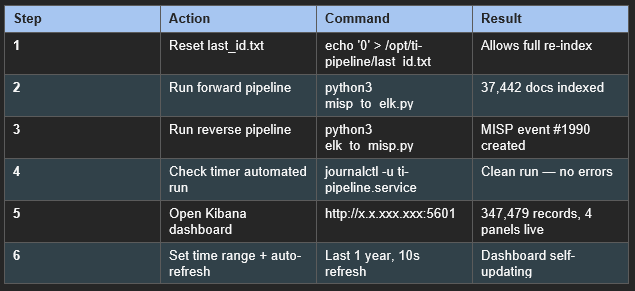
3.6.4 End-to-End Verification
After all automation is confirmed, run a full round-trip verification. Reset last_id to 0 to re-process all MISP events, then confirm both directions work cleanly.
3.7 Hardening, Gotchas, and Troubleshooting
3.7.1 Five Critical Gotchas
• geo_point must be mapped BEFORE indexing. Auto-mapping creates an object type delete and recreate the index if this happens.
• The elastic superuser password is shown exactly once at install. If lost: elasticsearch-reset-password -u elastic -i
• Kibana enrollment tokens expire in 30 minutes. Generate immediately before first Kibana start.
• Medallion is NOT a systemd service must be manually restarted every session. Wrap in a service for production.
• stix2-elevator conversion (STIX 1.x to 2.x) is lossy review all conversion warnings carefully.
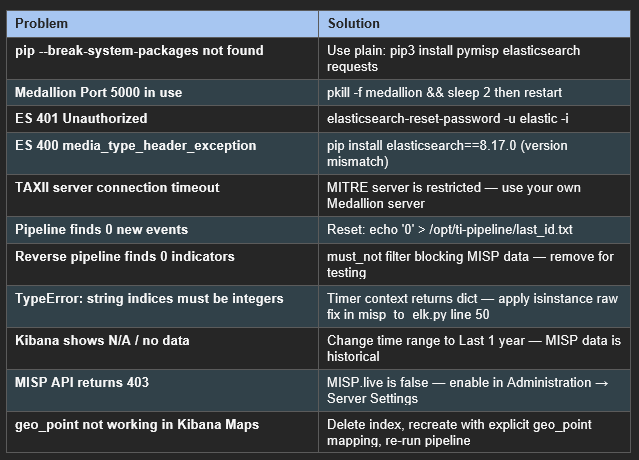
3.7.2 Troubleshooting Reference Table
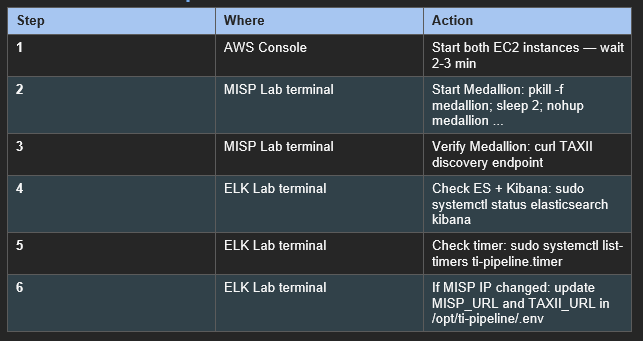
3.7.3 Session Startup Checklist
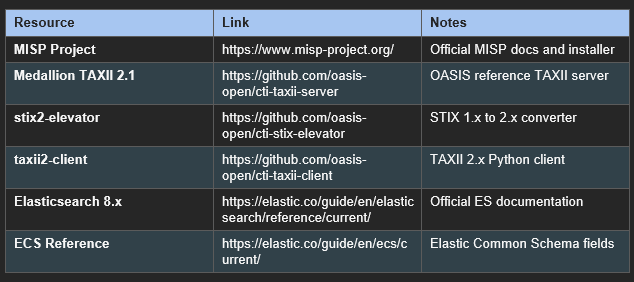
3.8 Key Takeaways and Resources
Architecture lessons · Final pipeline metrics · Documentation links
If you followed this blog end-to-end, you now have a fully operational, automated, bidirectional threat intelligence pipeline running on AWS which is something that in a production SOC would involve a team of engineers and commercial tools costing tens of thousands of dollars per year.
The most important lesson from this build is not any individual command, but rather it is the architecture decision that every component should speak STIX 2.1 JSON. Once that is the standard, MISP, Elasticsearch, Kibana, and any future tool all fit together naturally. TAXII 2.x is just the delivery protocol for that JSON.
• 1. STIX 1.x cannot be served over TAXII 2.x. Convert via stix2-elevator and treat all data as STIX 2.x JSON-native.
• 2. A single t3.xlarge on Ubuntu 22.04 with ES 8.x gives security-by-default, bundled JDK, and enrollment-token Kibana setup out of the box.
• 3. ECS-aligned mappings (threat.indicator.*) unlock Elastic Security’s indicator match rules the bridge between passive intelligence and active detection.
• 4. systemd timers beat cron: built-in journald logging, Persistent=true catch-up, and proper dependency management.
• 5. 347,479 indicators indexed, self-updating dashboard, MISP auto-push every 15 minutes this is a real SOC threat intelligence loop at lab scale.
• 6. Next steps: Elastic Security indicator match rules for live alert generation, and OpenCTI as middleware for enrichment.
PROJECT COMPLETE
MISP 2.5 — STIX 2.1 — TAXII 2.1 — Elasticsearch 8.x — Kibana
347,479 indicators · Fully automated · Bidirectional · Self-updating dashboard
MISP #STIX #TAXII #ELK #ThreatIntelligence #AWS #BlueTeam #SOC
메타데이터
- post_id
- a5c7a56bec60
- slug
- complete-threat-intelligence-pipeline-from-stix-feeds-to-living-dashboards-a5c7a56bec60
- url
- https://medium.com/@adevani20045/complete-threat-intelligence-pipeline-from-stix-feeds-to-living-dashboards-a5c7a56bec60
- canonical_url
- https://medium.com/@adevani20045/complete-threat-intelligence-pipeline-from-stix-feeds-to-living-dashboards-a5c7a56bec60
- author_url
- https://medium.com/@adevani20045
- status
- ok
- fetched_at
- 2026-06-11 17:55:54