Simplifying Kubernetes Energy Monitoring with Kepler
PART 1: FOUNDATIONAL CONCEPTS (Understanding the Basics) • Chapter 1: Cloud Native And Kubernetes Basics • Chapter 2: Understanding…
Simplifying Kubernetes Energy Monitoring with Kepler

PART 1: FOUNDATIONAL CONCEPTS (Understanding the Basics) • Chapter 1: Cloud Native And Kubernetes Basics • Chapter 2: Understanding Observability • Chapter 3: eBPF — The Magic Behind Kepler • Chapter 4: Prometheus and Metrics • Chapter 5: Grafana Visualisation
PART 2: KEPLER DEEP DIVE (Understanding the Technology) • Chapter 6: What is Kepler? • Chapter 7: How Kepler Works (Architecture) • Chapter 8: RAPL and Power Measurement • Chapter 9: Power Models and Attribution
PART 3: HANDS-ON DEMO (Building Everything from Scratch) • Chapter 10: Mac Setup Prerequisites • Chapter 11: Creating Your Kubernetes Cluster • Chapter 12: Installing Prometheus and Grafana • Chapter 13: Deploying Kepler • Chapter 14: Building Powerful Dashboards • Chapter 15: Running Power Experiments
Introduction
As a developer, I’ve always been curious about the environmental impact of the software I build. Data centers consume approximately 1–2% of global electricity, and that number is growing rapidly. But here’s the problem: most of us have no idea how much energy our applications actually consume.
When I discovered Kepler (Kubernetes-based Efficient Power Level Exporter), a CNCF Sandbox project, I knew I had to learn more. This blog post documents my journey from knowing nothing about power monitoring to building a complete demo from scratch.
The Problem: Flying Blind on Energy
Before Kepler, if you wanted to know how much power your Kubernetes workloads consumed, you had limited options:
- Server-level power meters — Tells the total server consumption, but not which applications use how much
- CPU percentage estimates — 50% CPU usage doesn’t mean 50% of power consumption
- Guesswork — Not exactly scientific
This is like trying to reduce your household electricity bill without knowing which appliances use the most power. You need visibility before you can optimize.
PART 1: FOUNDATIONAL CONCEPTS
Chapter 1: Cloud Native and Kubernetes Basics
Before we can understand Kepler, we need to understand where its runs. Let’s build your foundation step by step.
What is “Cloud Native”?
- Simple Definition Cloud Native means building and running applications that fully exploit the advantages of cloud computing. Instead of running one big application on one server, you break it into small pieces (microservices) that can run anywhere, scale automatically, and recover from failures.
The Cloud Native Computing Foundation (CNCF) is the organization that manages open-source cloud native projects. Kubernetes, Prometheus, Kepler — they’re all CNCF projects.
What Problem Does Kubernetes Solve?
Imagine you’re running a food delivery app like Swiggy or Zomato(for international readers: think DoorDash or Uber Eats):
- During lunch rush (12–2 PM): You need 500 CPU cores and 1TB of memory to handle thousands of simultaneous orders
- At 3 AM: You only need 20 CPU cores, paying for 500 is wasting money
- If one instance crashes: Customer orders shouldn’t fail, traffic should automatically route to healthy instances
- Deploying updates: Should happen without downtime
Doing this manually is impossible. Kubernetes automates all of this.
But wait, can’t cloud auto-scaling handle this?
Yes! AWS EC2 Auto Scaling, Azure VMSS, and serverless platforms like AWS Lambda all solve parts of this problem. So why do companies still choose Kubernetes?
- No vendor lock-in: Your application runs identically on AWS, Azure, GCP, or your own data center. Switch providers without rewriting everything.
- Better resource efficiency: Kubernetes bin-packs containers tightly. You might run 50 microservices on resources that would otherwise need 50 separate VMs or Lambda functions.
- Unified ecosystem: Tools like Prometheus (monitoring), Istio (networking), and Kepler (power monitoring) work across any Kubernetes cluster, regardless of where it runs.
- Complex workload support: Stateful applications, batch jobs, ML training pipelines — Kubernetes handles workloads that don’t fit neatly into serverless models.
Kubernetes isn’t always the right choice, serverless is simpler for event-driven, stateless workloads. But for complex, multi-service applications that need portability and fine-grained control, Kubernetes remains the industry standard.
Kubernetes Definition
Kubernetes (K8s) is a system that automatically runs, scales, and heals your containerized applications across many machines. Think of it as an autopilot for your applications — you tell it what you want, and it figures out how to make it happen.
Essential Kubernetes Concepts
- Containers
A container is your application packaged with everything it needs to run — code, libraries, settings, dependencies. It’s like a shipping container: standardized, portable, and isolated.
Real-world analogy: A container is like a lunchbox. It has everything you need for your meal, it’s portable, and what’s inside doesn’t mix with other lunchboxes.
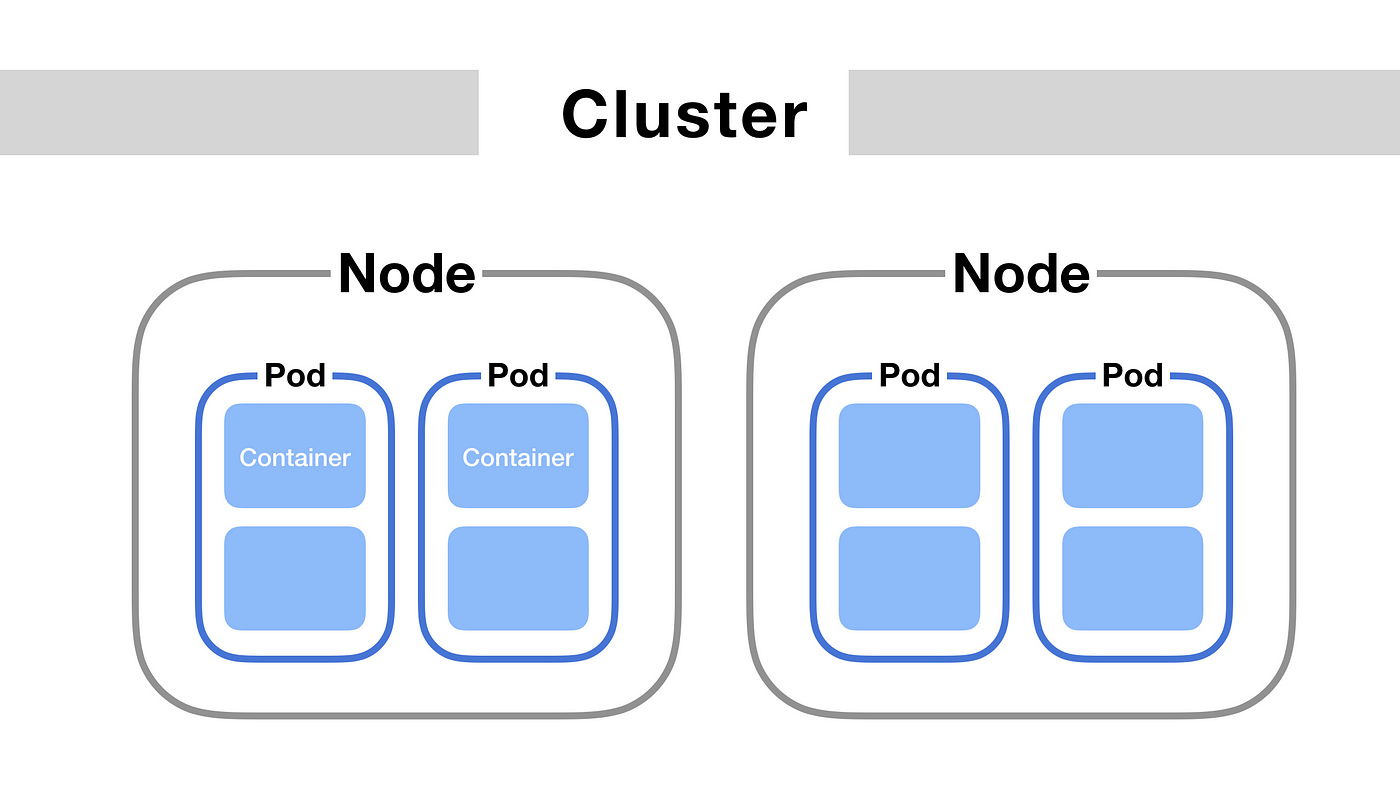
- Pods
A Pod is the smallest deployable unit in Kubernetes. It wraps one or more containers that share storage and network. Usually, one pod = one container, but sometimes related containers live together.
Real-world analogy: A pod is like an apartment. Containers are the rooms. They share the same address (IP), plumbing (storage), and live together.
- Nodes
A Node is a physical or virtual machine that runs pods. It has CPU, memory, and an operating system. Kubernetes manages a pool of nodes.
Real-world analogy: A node is like an apartment building. It can host many apartments (pods).
- Cluster
A Cluster is a group of nodes managed by Kubernetes. You interact with the cluster, and Kubernetes decides which node runs which pod.
Real-world analogy: A cluster is like a neighborhood of apartment buildings, all managed by one property management company (Kubernetes).
- Namespace
A Namespace is a virtual separation within a cluster. It lets you organize resources and set boundaries between teams or environments.
Real-world analogy: Namespaces are like different companies renting space in the same office building. They share the building but have their own separate areas.
Visual: How Everything Fits Together
Why This Matters for Kepler
Kepler measures power consumption at the Pod level. This is revolutionary because before Kepler, you could only measure power at the Node (server) level. You had no idea which application was consuming how much energy. Kepler gives you that granularity.
💡 Key Insight
In a Kubernetes cluster, hundreds of pods from different applications share the same nodes. Without Kepler, you see: ‘Node 1 uses 200 watts.’ With Kepler, you see: ‘Pod frontend-api’ uses 45W, pod database uses 80W, pod cache uses 25W…’ This granularity changes everything for optimization.
Chapter 2: Understanding Observability
Observability is about understanding what’s happening inside your systems. In cloud-native world, it has three pillars.
The Three Pillars of Observability
- Metrics — Numbers Over Time
Metrics are numerical measurements collected at regular intervals. They tell you the state of your system.
- CPU usage: 75%
- Memory used: 2.3 GB
- Requests per second: 1,500
- Power consumption: 45 watts ← This is what Kepler adds!
- Logs — Events That Happened
Logs are text records of events in your system.
- “2026–01–15 14:32:05 — User John logged in”
- “2026–01–15 14:32:10 — Payment failed: insufficient funds”
- “2026–01–15 14:32:15 — Database connection established”
- Traces — Following a Request
Traces follow a single request as it travels through multiple services. Like tracking a package through the postal system.
Where Kepler Fits
🔌 Kepler’s Unique Contribution
Kepler adds a FOURTH dimension to observability: ENERGY METRICS. Before Kepler, we could see CPU/memory usage but had no idea about actual power consumption. Kepler exposes metrics like
**kepler_container_joules_total**so you can see exactly how much energy each container uses in Joules.
Why Traditional Monitoring Falls Short
Traditional monitoring tools tell you:
This pod is using 50% CPU.
But they can’t tell you:
This pod consumed 25 watt-hours today, costing ₹2.10 and producing 15g of CO2
Why does CPU percentage not equal power? Because different types of CPU operations consume different amounts of energy. A CPU doing complex math burns more power than one waiting for network data, even at the same ‘usage’ percentage.
What Kepler Enables
- Cost allocation: Charge teams for their actual energy usage, not just CPU time
- Carbon tracking: Calculate CO2 emissions per application using regional carbon intensity
- Optimization: Identify power-hungry applications and fix inefficient code
- Sustainability reporting: Provide data for ESG (Environmental, Social, Governance) reports
Chapter 3: eBPF — The Magic Behind Kepler
This is the most important foundational concept. eBPF is the technology that makes Kepler possible. Let’s understand it step by step.
First: What is the Linux Kernel? The Linux kernel is the core of the operating system. It’s the software that talks directly to your hardware (CPU, memory, network cards, disk) and manages everything. It’s like the foundation of a building — everything else sits on top of it.

The Problem eBPF Solves
Traditionally, if you wanted to add custom functionality to the kernel (like measuring power per process), you had two bad options:
- Modify the kernel source code: Takes days/months to get approved by Linux maintainers. Very risky — one bug can crash the entire system.
- Write a kernel module: Complex, can crash your system, and breaks every time the kernel updates. Requires deep expertise.
💡 eBPF: The Game Changer
eBPF (extended Berkeley Packet Filter) lets you run small, safe programs INSIDE the Linux kernel without modifying the kernel or loading risky modules. It’s like having a superpower to observe and modify how the kernel works, but in a completely safe sandbox that can’t crash your system.
How eBPF Works (Simple Explanation)
- Write a small program: Usually in C or using high-level tools
- Kernel verifies it: The kernel checks it won’t crash, won’t loop forever, won’t access forbidden memory
- Attach to a “hook”: Hooks are points in the kernel where events happen (like “when a process runs” or “when network packet arrives”)
- Program runs when triggered: It collects data or modifies behaviour, then sends results to user space
Real-World Analogy
Imagine an airport (the kernel). Normally, only airport staff (kernel code) can access restricted areas like the control tower or baggage systems.
eBPF is like giving security-cleared inspectors (your programs) special access badges. They can:
- Observe everything happening in secure areas
- Take measurements and report back
- Can’t damage anything or access prohibited areas
- If they try anything suspicious, they’re immediately ejected
How Kepler Uses eBPF

This data, combined with actual power readings from hardware (RAPL — we’ll cover this next), lets Kepler calculate how much power each container is using. All with minimal overhead (<1% CPU impact)!
Chapter 4: Prometheus & Metrics
Prometheus is the standard tool for collecting and storing metrics in the cloud-native world. Kepler exports its power data as Prometheus metrics, so understanding Prometheus is essential.
📊 What is Prometheus?
Prometheus is an open-source monitoring system that collects numeric metrics from your applications, stores them in a time-series database, and lets you query them. It’s a CNCF graduated project (the highest maturity level) — the gold standard for Kubernetes monitoring.
How Prometheus Works
Prometheus uses a “pull” model. Instead of applications pushing data to Prometheus, Prometheus actively scrapes (fetches) data from applications at regular intervals.

What is a Prometheus Exporter?
An exporter is a piece of software that collects metrics from somewhere and exposes them in Prometheus format. Kepler is an exporter! It collects power metrics and exposes them for Prometheus to scrape.
Kepler’s Prometheus Metrics
When you install Kepler, it exposes these metrics:

PromQL: The Query Language
Prometheus has its own query language called PromQL. Here are useful queries for Kepler:
- Power consumption in Watts (rate of Joules):
sum(rate(kepler_container_joules_total[5m])) by (namespace)
- Top 5 power-consuming pods:
topk(5, sum(rate(kepler_container_joules_total[5m])) by (pod))
- Node-level power:
sum(rate(kepler_node_package_joules_total[5m]))
Chapter 5: Grafana Visualization
📈 What is Grafana?
Grafana is an open-source visualization platform that creates beautiful dashboards from data sources like Prometheus. It turns raw numbers into charts, graphs, and alerts that humans can understand. Think of Prometheus as the database and Grafana as the reporting tool.
Why Grafana + Kepler is Powerful
While Prometheus stores the data, Grafana makes it visual and actionable. With Kepler + Grafana, you can create dashboards showing:
- Real-time power consumption per pod/namespace
- Historical trends (power usage over days/weeks)
- Comparison between applications
- Alerts when power exceeds thresholds
- Carbon footprint estimates based on regional grid data
PART 2: KEPLER DEEP DIVE
Understanding how Kepler actually works
Chapter 6: What is Kepler?
🛰️ Official Definition
Kepler is a Prometheus exporter that measures energy consumption at the container, pod, VM, and process level by reading hardware sensors (like Intel RAPL) and attributing power based on resource utilization. When hardware sensors aren’t available (like in VMs), it uses machine learning models to estimate power.
The Problem Kepler Solves
Before Kepler, measuring power in Kubernetes was nearly impossible:

Chapter 7: How Kepler Works (Architecture)
Let’s understand Kepler’s architecture and how it calculates power.
The Architecture Diagram

Step-by-Step: How Kepler Calculates Power
Step 1: Collect Resource Usage via eBPF Kepler’s eBPF program hooks into the kernel and tracks every process’s CPU cycles, instructions, cache usage. It maps each process ID (PID) to its Kubernetes container.
Step 2: Read Actual Power from Hardware Simultaneously, Kepler reads real power consumption from hardware sensors like Intel RAPL (for CPU/DRAM), NVML (for NVIDIA GPUs), or uses ML models when sensors aren’t available.
Step 3: Apply the Ratio Model This is the key insight: Kepler uses a ratio-based attribution model.
Container Power = (Container CPU Usage / Total CPU Usage) × Total
                                                            Hardware Power
Example: If total CPU power is 100W and container A used 30% of CPU cycles, container A is attributed 30W of CPU power.
Step 4: Handle Idle Power
Power splits into dynamic power (varies with load) and idle power (constant baseline). Kepler distributes idle power among all containers based on their ‘size’ (resource requests), following the Greenhouse Gas Protocol guidelines.
Step 5: Export as Prometheus Metrics
Finally, Kepler exposes all data as Prometheus metrics on port 9102. Prometheus scrapes these every 15–30 seconds, storing the time-series data.
Chapter 8: RAPL & Power Measurement
RAPL is the primary power source for Kepler on Intel systems. Let’s understand it deeply.
⚡ What is RAPL?
RAPL (Running Average Power Limit) is a feature in Intel processors (since 2011) that provides energy consumption data for different power domains. It’s accessed via special CPU registers or the Linux powercap interface at
/sys/class/powercap/intel-rapl/
RAPL Power Domains

When RAPL Isn’t Available RAPL is not available in:
- Cloud VMs: AWS, GCP, Azure don’t expose RAPL to guest VMs
- ARM processors: Apple M1/M2/M3, AWS Graviton don’t have RAPL
- Docker Desktop on Mac: Runs in a VM, no direct hardware access
In these cases, Kepler uses pre-trained ML models to estimate power based on resource usage patterns. These models were trained on real hardware and can estimate within ~10–15% accuracy.
💻 For Our Demo on Mac
Since Mac doesn’t expose RAPL (especially on M1/M2/M3), Kepler will use its ‘estimator’ mode with ML models. This is perfect for learning and demos! You’ll still see power metrics, they’re just estimated rather than measured. For production deployments with real measurements, you’d use bare-metal Linux servers
Chapter 9: Power Models & Attribution
Understanding how Kepler attributes power to containers is crucial for interpreting the metrics.
The Ratio Power Model
Kepler’s primary model is the Ratio Power Model. It’s simple but effective:
- Measure total hardware power (from RAPL or estimates)
- Collect resource usage per process (from eBPF)
- Calculate each container’s share: usage_ratio = container_usage / total_usage
- Attribute power: container_power = usage_ratio × total_power
Dynamic vs Idle Power

Following the Greenhouse Gas Protocol, Kepler distributes idle power among all processes proportionally to their ‘size’ (requested resources). This ensures fair allocation of the always-on infrastructure cost.
Converting Power to Carbon
To calculate carbon emissions from power:
**Carbon (gCO2) = Energy (kWh) × Grid Carbon Intensity (gCO2/kWh)
India’s grid carbon intensity: **~700–800 gCO2/kWh (varies by region and time). Data available from electricitymaps.com or India’s Central Electricity Authority
PART 3: HANDS-ON DEMO
Building your complete Kepler demo from scratch on Mac
Chapter 10: Mac Setup Prerequisites
Starting with a fresh MacBook? Let’s install everything you need step by step.
🖥️ What You’ll Install
- Homebrew (Mac package manager) 2. Docker Desktop (container runtime) 3. kubectl (Kubernetes CLI) 4. Kind (Kubernetes in Docker) 5. Helm (Kubernetes package manager)
Step 1: Install Homebrew
Homebrew is the package manager for macOS. Open Terminal (Cmd + Space, type ‘Terminal’) and run:
/bin/bash -c "$(curl -fsSL https://raw.githubusercontent.com/Homebrew/install/HEAD/install.sh)"Follow the prompts. After installation, you may need to add Homebrew to your PATH (the installer will tell you the exact commands).
Step 2: Install Docker Desktop
brew install --cask dockerAfter installation, open Docker Desktop from Applications. Wait until the whale icon in the menu bar stops animating. This may take a minute on first launch. Also go to Settings > Resources and allocate at least 4GB RAM and 2 CPUs.
Step 3: Install kubectl
brew install kubectlkubectl is the Kubernetes command-line tool. You’ll use it to interact with your cluster.
Step 4: Install Kind
brew install kindKind (Kubernetes in Docker) creates a Kubernetes cluster inside Docker containers. Perfect for local development.
Step 5: Install Helm
brew install helmHelm is the Kubernetes package manager. We’ll use it to install Prometheus, Grafana, and Kepler.
Step 6: Verify All Installations
# Run each command - all should show version numbers
docker --version
kubectl version --client
kind version
helm version
Chapter 11: Creating Your Kubernetes Cluster
Now let’s create a local Kubernetes cluster using Kind.
Step 1: Create Cluster Configuration First, create a configuration file. This enables port forwarding so we can access services:
# Create the config file
cat > kind-config.yaml << 'EOF'
kind: Cluster
apiVersion: kind.x-k8s.io/v1alpha4
nodes:
- role: control-plane
  extraPortMappings:
  - containerPort: 30000
    hostPort: 30000
  - containerPort: 30001
    hostPort: 30001
EOF
Step 2: Create the cluster
kind create cluster --name kepler-demo --config kind-config.yamlThis takes 2–3 minutes. You’ll see progress messages as Kind downloads images and creates the cluster.
Step 3: Verify Cluster
# Check cluster info
kubectl cluster-info

# List nodes
kubectl get nodes

# List all pods (system pods)
kubectl get pods -A
You should see your node with status ‘Ready’ and several system pods running.
Chapter 12: Installing Prometheus & Grafana
Now we install the monitoring stack that will collect and visualize Kepler’s metrics
Step 1: Add Helm Repository
# Add the Prometheus community charts
helm repo add prometheus-community https://prometheus-community.github.io/helm-charts
helm repo update
Step 2: Install kube-prometheus-stack
This installs Prometheus, Grafana, and node-exporter together:
helm install prometheus prometheus-community/kube-prometheus-stack \
  --namespace monitoring \
  --create-namespace \
  --set prometheus.prometheusSpec.serviceMonitorSelectorNilUsesHelmValues=false
Step 3: Wait for Pods
# Watch pods come up (press Ctrl+C when all show Running)
kubectl get pods -n monitoring -w
Chapter 13: Deploying Kepler
Finally, we install Kepler itself!
Step 1: Add Kepler Helm Repo
helm repo add kepler https://sustainable-computing-io.github.io/kepler-helm-chart
helm repo update
You can see the latest version by using the following command:
helm search repo keplerStep 2: Install Kepler
For Prometheus to be able to discover the metrics exported by Kepler, the serviceMonitor needs to be enabled and labeled with the release name of your Prometheus install. In our installation we called our kube-prometheus-stack install prometheus:
helm install kepler kepler/kepler \
    --namespace kepler \
    --create-namespace \
    --set serviceMonitor.enabled=true \
    --set serviceMonitor.labels.release=prometheus \
Step 3: Test Kepler Metrics
# Port-forward to access Kepler metrics
kubectl port-forward -n kepler svc/kepler 9102:9102 &

# Wait a moment, then test
sleep 3
curl -s http://localhost:9102/metrics | grep kepler | head -20
🎉 Success!
If you see metrics starting with ‘kepler_’ in the output, congratulations — Kepler is working! You’re now collecting power metrics from your Kubernetes cluster.
Chapter 14: Building Power Dashboards with Kepler
This chapter shows how to visualize Kubernetes power and energy metrics using Kepler + Prometheus + Grafana.
Step 1: Access Grafana
Port-forward Grafana from the monitoring namespace:
kubectl port-forward -n monitoring svc/prometheus-grafana 3000:80Open in browser:
http://localhost:3000Login: Get the admin password using:
kubectl --namespace monitoring get secrets prometheus-grafana \
  -o jsonpath="{.data.admin-password}" | base64 -d ; echo
Login with:
- Username:
admin - Password: (output from command above)
Step 2: Verify / Add Prometheus Data Source
When using kube-prometheus-stack, Grafana already provisions Prometheus.
Go to:
Connections → Data sources → PrometheusEnsure:
- Name:
Prometheus - Default: enabled
- Prometheus server URL:
http://prometheus-kube-prometheus-prometheus.monitoring:9090Step 3: Import Kepler Dashboard (JSON)
Instead of using Grafana dashboard IDs (which caused datasource issues), import via JSON.
Import steps:
- Grafana → Dashboards → Import
- Click Upload JSON file
- Paste the dashboard JSON(below)
- Click Import
Kepler Power & Energy Dashboard (JSON)
This dashboard is aligned with:
- ML-based estimation (kind / macOS)
- Pod-level and namespace-level attribution
- CPU & memory stress experiments
Important: This dashboard automatically uses the default Prometheus datasource (no manual panel edits needed).
Dashboard JSON
{
  "uid": "kepler-power-energy",
  "title": "Kubernetes Power & Energy Monitoring (Kepler)",
  "timezone": "browser",
  "schemaVersion": 38,
  "version": 1,
  "refresh": "10s",
  "panels": [
    {
      "type": "stat",
      "title": "Total Cluster Power (Watts)",
      "datasource": { "type": "prometheus" },
      "targets": [
        {
          "expr": "sum(rate(kepler_node_package_joules_total[1m]))",
          "refId": "A"
        }
      ],
      "fieldConfig": {
        "defaults": {
          "unit": "watt",
          "color": { "mode": "thresholds" },
          "thresholds": {
            "steps": [
              { "color": "green", "value": null },
              { "color": "red", "value": 150 }
            ]
          }
        }
      },
      "gridPos": { "x": 0, "y": 0, "w": 12, "h": 6 }
    },
    {
      "type": "timeseries",
      "title": "Cluster Power Over Time (Watts)",
      "datasource": { "type": "prometheus" },
      "targets": [
        {
          "expr": "sum(rate(kepler_node_package_joules_total[1m]))",
          "refId": "A"
        }
      ],
      "fieldConfig": { "defaults": { "unit": "watt" } },
      "gridPos": { "x": 12, "y": 0, "w": 12, "h": 6 }
    },
    {
      "type": "timeseries",
      "title": "Node Power Baseline vs Spike (Watts)",
      "datasource": { "type": "prometheus" },
      "targets": [
        {
          "expr": "rate(kepler_node_package_joules_total[1m])",
          "refId": "A"
        }
      ],
      "fieldConfig": { "defaults": { "unit": "watt" } },
      "gridPos": { "x": 0, "y": 6, "w": 24, "h": 6 }
    },
    {
      "type": "barchart",
      "title": "Power by Namespace (Watts)",
      "datasource": { "type": "prometheus" },
      "targets": [
        {
          "expr": "sum(rate(kepler_container_joules_total[5m])) by (container_namespace)",
          "refId": "A"
        }
      ],
      "fieldConfig": { "defaults": { "unit": "watt" } },
      "gridPos": { "x": 0, "y": 12, "w": 12, "h": 7 }
    },
    {
      "type": "barchart",
      "title": "Power by Pod (Watts)",
      "datasource": { "type": "prometheus" },
      "targets": [
        {
          "expr": "sum(rate(kepler_container_joules_total[5m])) by (pod)",
          "refId": "A"
        }
      ],
      "fieldConfig": { "defaults": { "unit": "watt" } },
      "gridPos": { "x": 12, "y": 12, "w": 12, "h": 7 }
    },
    {
      "type": "table",
      "title": "Top 10 Power-Hungry Pods",
      "datasource": { "type": "prometheus" },
      "targets": [
        {
          "expr": "topk(10, sum(rate(kepler_container_joules_total[5m])) by (pod, container_namespace))",
          "refId": "A"
        }
      ],
      "gridPos": { "x": 0, "y": 19, "w": 24, "h": 6 }
    },
    {
      "type": "timeseries",
      "title": "Energy Consumed per Pod (Joules)",
      "datasource": { "type": "prometheus" },
      "targets": [
        {
          "expr": "sum(kepler_container_joules_total) by (container, pod)",
          "refId": "A"
        }
      ],
      "fieldConfig": { "defaults": { "unit": "joule" } },
      "gridPos": { "x": 0, "y": 25, "w": 24, "h": 7 }
    }
  ]
}
Chapter 15: Running Power Experiments
Now we generate workloads and observe real-time power changes.
Experiment 1: CPU-Intensive Workload
kubectl run cpu-stress \
  --image=polinux/stress \
  --restart=Never \
  -- stress --cpu 4 --timeout 300s
Experiment 2: Memory-Intensive Workload
kubectl run mem-stress \
  --image=polinux/stress \
  --restart=Never \
  -- stress --vm 2 --vm-bytes 512M --timeout 300s
What to observe in Grafana
- Total Cluster Power increases (~10–15 W)
- cpu-stress appears in:
- Power by Pod
- Top Power-Hungry Pods
- Energy curve slope increases for
cpu-stress - Power by Namespace shows spike in
default - Energy consumed per pod increases steadily
Experiment 3: Watch in Grafana (Key Observations)
While stress tests are running, you should clearly see:
cpu-stresspod consuming higher CPU-related powermem-stresspod contributing additional memory energy- Total cluster power increasing and staying elevated
- Energy (Joules) accumulating over time
Even on kind + macOS, Kepler’s ML-based power models accurately reflect workload-driven energy changes.
Cleanup
Delete stress test pods:
kubectl delete pod cpu-stress mem-stress --ignore-not-found(Optional) Delete cluster when completely done:
kind delete cluster --name kepler-demoFinal Notes (Important for Readers)
- On laptops, VMs, and cloud environments, Kepler uses ML-based power estimation
- Absolute watt values may vary
- Relative changes and attribution are accurate and meaningful
Resources
If you want to start your own Kepler journey, here are the resources I found most helpful:
- Kepler Documentation: https://sustainable-computing.io/
- Kepler GitHub: https://github.com/sustainable-computing-io/kepler
- CNCF TAG Environmental Sustainability: https://tag-env-sustainability.cncf.io/
- eBPF Introduction: https://ebpf.io/what-is-ebpf/
Conclusion
The cloud-native community has an opportunity — and I’d argue a responsibility — to make computing more sustainable. Kepler is a crucial tool in that effort. It brings visibility to a problem that’s been invisible for too long.
If you’re interested in green computing, sustainability, or just curious about where your CPU cycles go, I encourage you to try Kepler. The setup takes less than an hour, and the insights are eye-opening.
Let’s make our Kubernetes clusters greener, one pod at a time. 🌱
메타데이터
- post_id
- a6ece01b15d3
- slug
- simplifying-kubernetes-energy-monitoring-with-kepler-a6ece01b15d3
- url
- https://medium.com/@yash4421/simplifying-kubernetes-energy-monitoring-with-kepler-a6ece01b15d3
- canonical_url
- https://medium.com/@yash4421/simplifying-kubernetes-energy-monitoring-with-kepler-a6ece01b15d3
- author_url
- https://medium.com/@yash4421
- status
- ok
- fetched_at
- 2026-07-13 06:23:13




