Solving AWS Batch Monitoring Blind Spots: EventBridge + Lambda + CloudWatch Custom Metrics
Recently, we had an incident where a script unintentionally triggered 1,000 AWS Batch jobs at once. The jobs piled up in the job queue and…
Solving AWS Batch Monitoring Blind Spots: EventBridge + Lambda + CloudWatch Custom Metrics
Recently, we had an incident where a script unintentionally triggered 1,000 AWS Batch jobs at once. The jobs piled up in the job queue and became stuck in the RUNNABLE state for long hours due to insufficient CPU capacity. Scaling didn’t activate because of a low maxvCpus setting.
The worst part? This went unnoticed for hours.
When I went looking for native CloudWatch (CW) metrics for job queue health (like how many jobs are stuck in RUNNABLE, how long they’ve been waiting, etc.), I realized there aren’t any out-of-the-box.
So, I built a simple event-driven monitoring pipeline which uses EventBridge, AWS Lambda, and CloudWatch custom metrics to provide comprehensive, real-time monitoring of AWS Batch job queues, addressing gaps that native monitoring cannot fill.
The Problem: Missing Critical Visibility
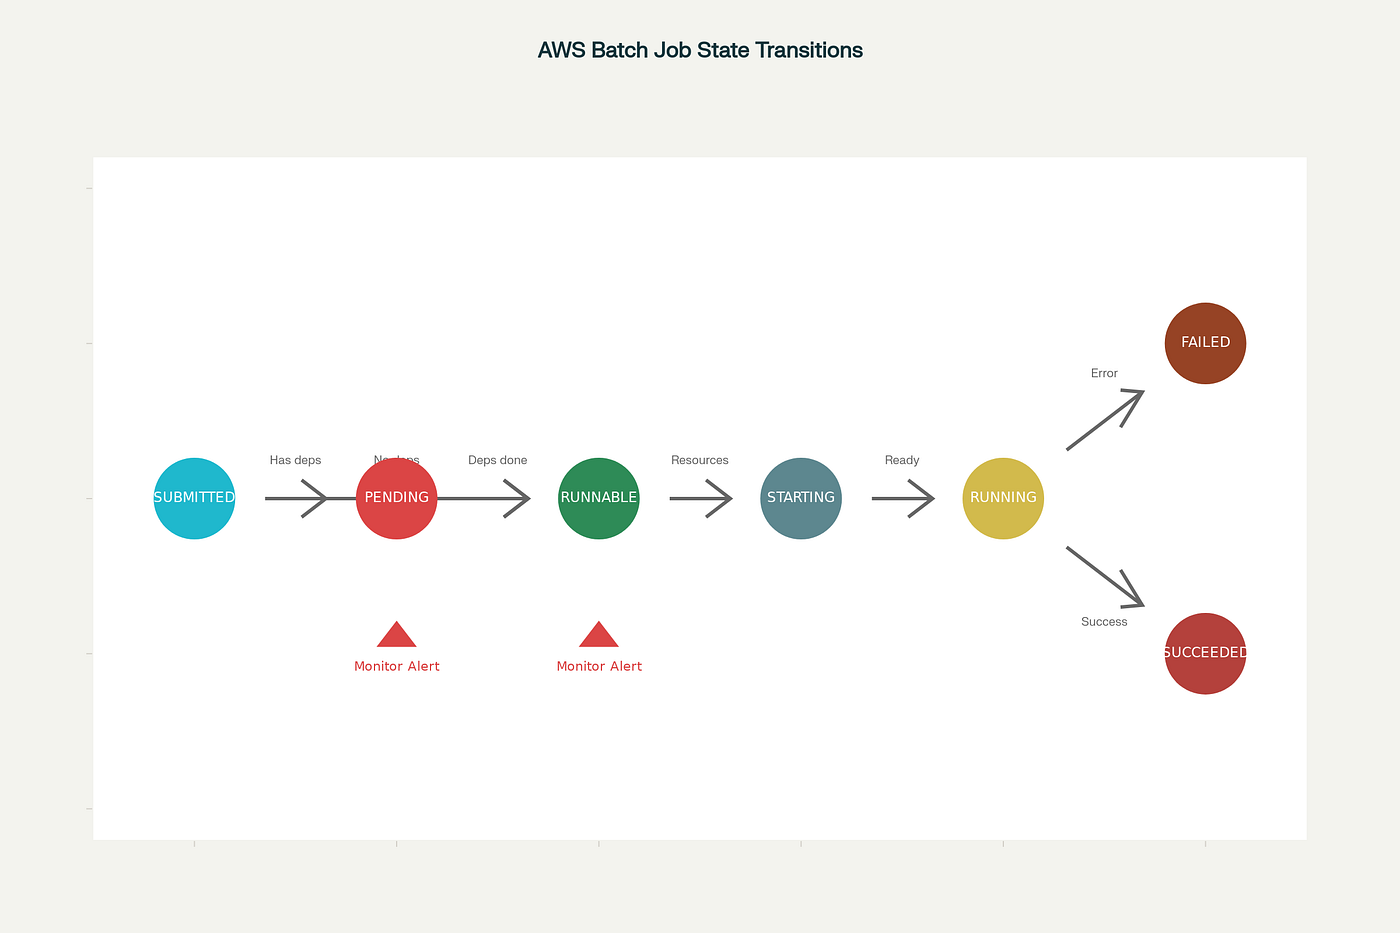
AWS Batch Job State Flow
AWS Batch jobs progress through several states: SUBMITTED → PENDING → RUNNABLE → STARTING → RUNNING → SUCCEEDED/FAILED.
Jobs commonly get stuck in the RUNNABLE state when:
- Compute environments are configured with low maxvCpus
- AWS service limits are reached
- Insufficient spot capacity is available
- Network or IAM permission issues prevent scaling
Native Monitoring Limitations
AWS Batch’s native CloudWatch integration provides basic metrics like Jobcount and ContainerInstanceCount for compute environments, but lacks:
- Queue-level job distribution across all states
- Job age tracking (how long jobs remain in each state)
- Real-time queue depth monitoring for capacity planning
- Historical analysis of job processing patterns
This monitoring gap leads to undetected job backlogs, wasted resources, missed SLAs, and challenges in capacity planning.
The Solution: EventBridge + Lambda + CloudWatch Architecture
The solution leverages AWS Batch’s EventBridge integration to capture job state changes in real-time, then uses Lambda to enrich the data and publish comprehensive metrics to CloudWatch.

How It Works
- AWS Batch generates Batch Job State Change events for every job transition.
- An EventBridge rule filters events using the pattern:
{"source": ["aws.batch"], "detail-type": ["Batch Job State Change"]}. - A Lambda function processes these events, querying additional job details via the list_jobs() and describe_jobs() APIs.
- CloudWatch receives custom metrics including JobStatusChange, QueueDepth, JobAge, and JobDuration.
Implementation Details
EventBridge Rule Configuration: Create an EventBridge rule with the following pattern to capture all AWS Batch job state changes:
{
  "source": ["aws.batch"],
  "detail-type": ["Batch Job State Change"]
}
Lambda Function Core Logic
The Lambda function performs several key operations:
- Event Processing: Extracts job details from EventBridge events
- Accurate Counting: Uses paginated
list_jobs()calls to get precise queue depths - Metric Calculation: Computes job age, duration, and state transitions
- Batch Publishing: Sends metrics to CloudWatch in batches (max 20 per request)
#!/usr/bin/env python3
"""
AWS Batch Event Handler Lambda
Processes EventBridge events for real-time job status tracking
"""

import json
import logging
import boto3
from datetime import datetime
from typing import Dict, Any
import os

# Configure logging
logger = logging.getLogger()
logger.setLevel(logging.INFO)

# Initialize AWS clients
cloudwatch_client = boto3.client('cloudwatch')
batch_client = boto3.client('batch')

def convert_timestamp(timestamp_ms: int) -> datetime:
    """Convert Unix milliseconds timestamp to datetime object"""
    try:
        if isinstance(timestamp_ms, int):
            return datetime.fromtimestamp(timestamp_ms / 1000.0)
        elif isinstance(timestamp_ms, str):
            # Handle ISO string format
            return datetime.fromisoformat(timestamp_ms.replace('Z', '+00:00'))
        else:
            return datetime.utcnow()
    except Exception as e:
        logger.warning(f"Failed to convert timestamp {timestamp_ms}: {e}")
        return datetime.utcnow()

def get_accurate_job_count(job_queue: str, status: str) -> int:
    """Get accurate count of jobs in a specific status using pagination"""
    try:
        total_count = 0
        next_token = None

        while True:
            params = {
                'jobQueue': job_queue,
                'jobStatus': status,
                'maxResults': 100  # Get more jobs per request
            }

            if next_token:
                params['nextToken'] = next_token

            response = batch_client.list_jobs(**params)
            jobs = response.get('jobSummaryList', [])
            total_count += len(jobs)

            next_token = response.get('nextToken')
            if not next_token:
                break

        logger.info(f"Accurate count for {status}: {total_count}")
        return total_count

    except Exception as e:
        logger.error(f"Failed to get accurate count for {status}: {e}")
        return 0

def process_batch_event(event: Dict[str, Any]):
    """Process EventBridge batch job state change event"""
    try:
        detail = event.get('detail', {})
        job_id = detail.get('jobId')
        job_name = detail.get('jobName')
        job_queue = detail.get('jobQueue')
        status = detail.get('status')
        timestamp = event.get('time')

        logger.info(f"Processing job {job_id} ({job_name}) status change to {status}")

        # Get additional job details
        try:
            job_details = batch_client.describe_jobs(jobs=[job_id])
            if job_details.get('jobs'):
                job = job_details['jobs'][0]

                # Convert timestamps from milliseconds to datetime objects
                created_at = convert_timestamp(job.get('createdAt'))
                started_at = convert_timestamp(job.get('startedAt')) if job.get('startedAt') else None
                stopped_at = convert_timestamp(job.get('stoppedAt')) if job.get('stoppedAt') else None

                # Calculate durations
                duration = None
                if started_at and stopped_at:
                    duration = (stopped_at - started_at).total_seconds()
                elif started_at:
                    duration = (datetime.utcnow() - started_at).total_seconds()

                # Publish detailed metrics
                publish_job_event_metrics(
                    job_id, job_name, job_queue, status,
                    duration, created_at, started_at, stopped_at
                )

        except Exception as e:
            logger.warning(f"Failed to get job details for {job_id}: {e}")
            # Still publish basic status metric
            publish_job_event_metrics(job_id, job_name, job_queue, status)

    except Exception as e:
        logger.error(f"Failed to process batch event: {e}")

def publish_job_event_metrics(job_id: str, job_name: str, job_queue: str, status: str,
                             duration: float = None, created_at = None, started_at = None, stopped_at = None):
    """Publish job event metrics to CloudWatch"""
    try:
        timestamp = datetime.utcnow()
        metrics_data = []

        # Status change metric
        metrics_data.append({
            'MetricName': 'JobStatusChange',
            'Dimensions': [
                {'Name': 'JobQueue', 'Value': job_queue},
                {'Name': 'Status', 'Value': status}
            ],
            'Value': 1,
            'Unit': 'Count',
            'Timestamp': timestamp
        })

        # Duration metric (if available)
        if duration is not None:
            metrics_data.append({
                'MetricName': 'JobDuration',
                'Dimensions': [
                    {'Name': 'JobQueue', 'Value': job_queue},
                    {'Name': 'Status', 'Value': status}
                ],
                'Value': duration,
                'Unit': 'Seconds',
                'Timestamp': timestamp
            })

        # Job age metric (time since creation)
        if created_at:
            age_seconds = (datetime.utcnow() - created_at).total_seconds()
            metrics_data.append({
                'MetricName': 'JobAge',
                'Dimensions': [
                    {'Name': 'JobQueue', 'Value': job_queue},
                    {'Name': 'Status', 'Value': status}
                ],
                'Value': age_seconds,
                'Unit': 'Seconds',
                'Timestamp': timestamp
            })

        # Queue depth metric (how many jobs in each status) - Only for active statuses
        if status in ['RUNNABLE', 'PENDING', 'RUNNING']:
            try:
                # Use accurate counting function
                queue_count = get_accurate_job_count(job_queue, status)

                metrics_data.append({
                    'MetricName': 'QueueDepth',
                    'Dimensions': [
                        {'Name': 'JobQueue', 'Value': job_queue},
                        {'Name': 'Status', 'Value': status}
                    ],
                    'Value': queue_count,
                    'Unit': 'Count',
                    'Timestamp': timestamp
                })
            except Exception as e:
                logger.warning(f"Failed to get queue depth for {status}: {e}")

        # Publish metrics in batches (CloudWatch allows max 20 per request)
        batch_size = 20
        for i in range(0, len(metrics_data), batch_size):
            batch = metrics_data[i:i + batch_size]
            cloudwatch_client.put_metric_data(
                Namespace='PCA/BatchEvents',
                MetricData=batch
            )

        logger.info(f"Published {len(metrics_data)} event metrics for job {job_id}")

    except Exception as e:
        logger.error(f"Failed to publish event metrics: {e}")

def publish_batch_summary_metrics(job_queue: str):
    """Publish summary metrics for the entire queue"""
    try:
        timestamp = datetime.utcnow()
        metrics_data = []

        # Get counts for VALID statuses only
        statuses = ['SUBMITTED', 'PENDING', 'RUNNABLE', 'STARTING', 'RUNNING', 'SUCCEEDED', 'FAILED']

        for status in statuses:
            try:
                # Use accurate counting function
                count = get_accurate_job_count(job_queue, status)

                metrics_data.append({
                    'MetricName': 'QueueSummary',
                    'Dimensions': [
                        {'Name': 'JobQueue', 'Value': job_queue},
                        {'Name': 'Status', 'Value': status}
                    ],
                    'Value': count,
                    'Unit': 'Count',
                    'Timestamp': timestamp
                })

            except Exception as e:
                logger.warning(f"Failed to get count for {status}: {e}")
                # Add zero count for failed statuses
                metrics_data.append({
                    'MetricName': 'QueueSummary',
                    'Dimensions': [
                        {'Name': 'JobQueue', 'Value': job_queue},
                        {'Name': 'Status', 'Value': status}
                    ],
                    'Value': 0,
                    'Unit': 'Count',
                    'Timestamp': timestamp
                })

        # Publish summary metrics
        batch_size = 20
        for i in range(0, len(metrics_data), batch_size):
            batch = metrics_data[i:i + batch_size]
            cloudwatch_client.put_metric_data(
                Namespace='PCA/BatchEvents',
                MetricData=batch
            )

        logger.info(f"Published {len(metrics_data)} summary metrics for queue {job_queue}")

    except Exception as e:
        logger.error(f"Failed to publish summary metrics: {e}")

def lambda_handler(event, context):
    """Main Lambda handler for EventBridge events"""
    try:
        logger.info(f"Received EventBridge event: {json.dumps(event)}")

        # Check if this is a batch event
        if event.get('source') == 'aws.batch' and event.get('detail-type') == 'Batch Job State Change':
            # Process the batch event
            process_batch_event(event)
        else:
            logger.info(f"Ignoring non-batch event: {event.get('source')} - {event.get('detail-type')}")

        # Also publish summary metrics for the queue (useful for monitoring overall health)
        try:
            detail = event.get('detail', {})
            job_queue = detail.get('jobQueue')
            if job_queue:
                publish_batch_summary_metrics(job_queue)
        except Exception as e:
            logger.warning(f"Failed to publish summary metrics: {e}")

        return {
            'statusCode': 200,
            'body': json.dumps({
                'status': 'processed',
                'event_type': event.get('detail-type'),
                'job_id': event.get('detail', {}).get('jobId'),
                'job_status': event.get('detail', {}).get('status')
            })
        }

    except Exception as e:
        logger.error(f"Lambda execution failed: {e}")
        return {
            'statusCode': 500,
            'body': json.dumps({
                'error': str(e),
                'event': event
            })
        }


    # Set environment variables for testing
    os.environ['AWS_DEFAULT_REGION'] = 'us-east-1'

    # Test the handler
    result = lambda_handler(test_event, None)
    print(f"Test result: {json.dumps(result, indent=2)}")
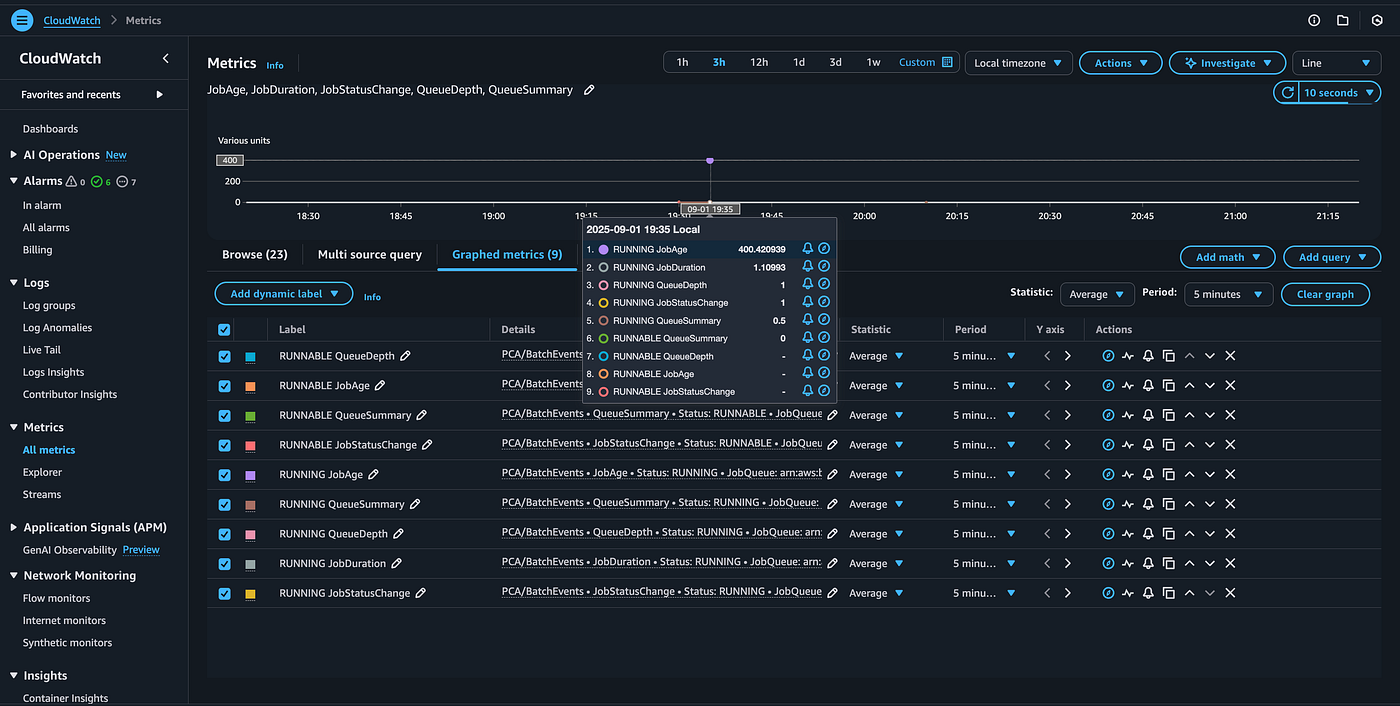
Custom Metrics Generated
The solution publishes metrics to the PCA/BatchEvents namespace:
- JobStatusChange: Count of jobs transitioning to each status
- QueueDepth: Real-time count of jobs in RUNNABLE, PENDING, RUNNING states
- JobAge: Time elapsed since job creation
- JobDuration: Execution time for completed jobs
All metrics include dimensions for JobQueue and Status to enable granular monitoring
Benefits
- Real-time visibility into job queue health
- Proactive alerting on stuck or aging jobs
- Prevention of resource waste from idle compute capacity
- Reduced Mean Time to Recovery (MTTR) for batch job issues
This approach provides fully integrated monitoring and operational insight that AWS Batch’s native integration currently lacks, helping prevent incidents and optimize batch processing environments.
Thanks for reading — Happy Building ! ✨
메타데이터
- post_id
- a73ebab4e7fa
- slug
- solving-aws-batch-monitoring-blind-spots-eventbridge-lambda-cloudwatch-custom-metrics-a73ebab4e7fa
- url
- https://medium.com/@aadhith/solving-aws-batch-monitoring-blind-spots-eventbridge-lambda-cloudwatch-custom-metrics-a73ebab4e7fa
- canonical_url
- https://medium.com/@aadhith/solving-aws-batch-monitoring-blind-spots-eventbridge-lambda-cloudwatch-custom-metrics-a73ebab4e7fa
- author_url
- https://medium.com/@aadhith
- status
- ok
- fetched_at
- 2026-07-17 20:17:52