Why Analysts Love SQL Window Functions (and Why You Should Too)
For a long time, I avoided window functions. They looked intimidating — too abstract. Every time I saw OVER(PARTITION BY…), I ‘d scroll…
Why Analysts Love SQL Window Functions (and Why You Should Too)
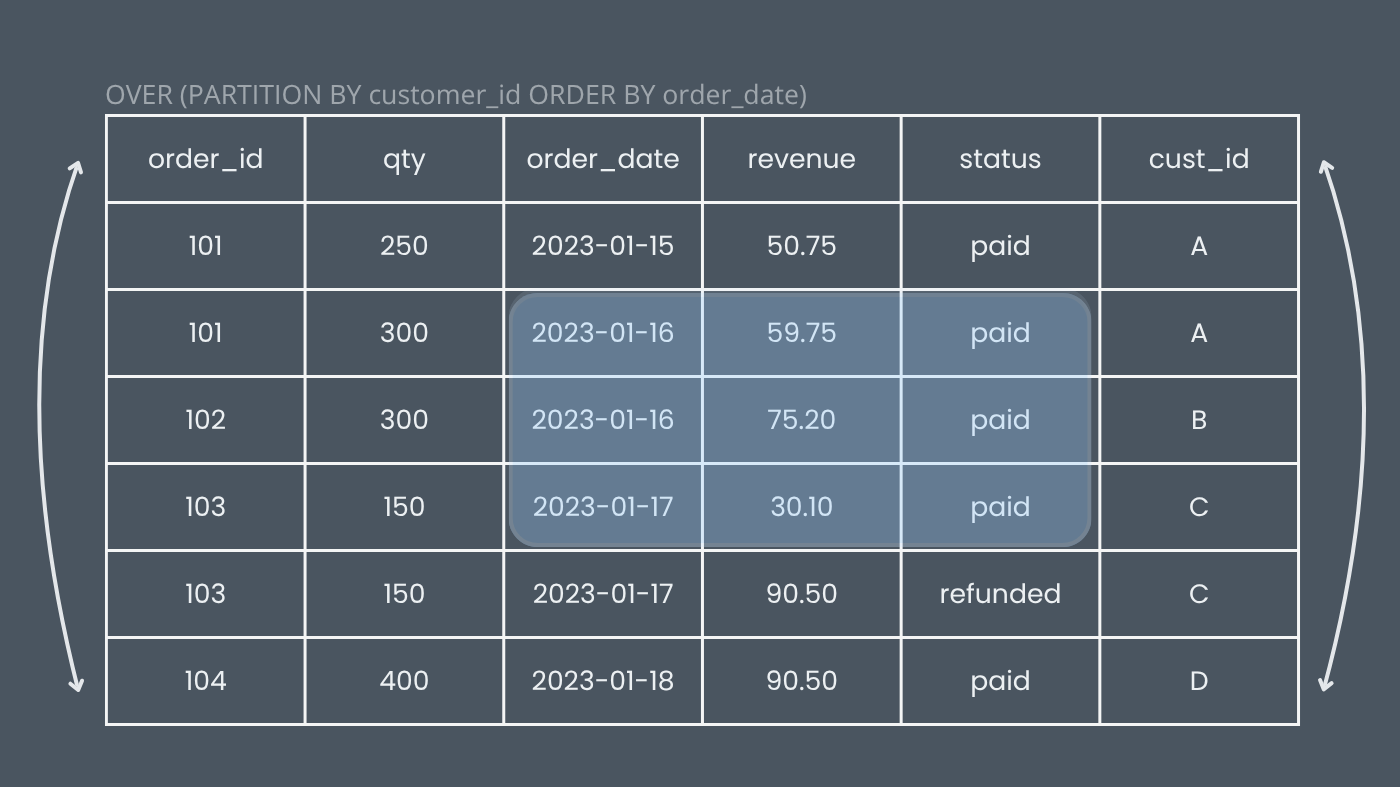
For a long time, I avoided window functions. They looked intimidating — too abstract. Every time I saw OVER(PARTITION BY…), I ‘d scroll down the tutorial and tell myself I’d learn it “later.”
That “later” came when I had to calculate the month-over-month revenue change in a single query — no joins, no subqueries — just one elegant function that did it all.
In this article, I’ll share how I finally understood window functions: what they are, how they differ from GROUP BY, and how to use them to make the queries cleaner, faster, and smarter.
What are Window functions?
Window functions (also called analytical functions) allow you to perform calculations across sets of rows that are related to the current row. They’re incredibly useful for:
- running totals
- rankings
- comparisons
- moving averages
- time-series analysis
In essence, window functions let you look across rows without collapsing them (unlike GROUP BY).
The syntax looks like this:
<function>(<field>) OVER (
    PARTITION BY <partition>
    ORDER BY <sorting>
    <frame>
)Where:
- Function — the analytical function you apply (SUM, AVG, LAG, etc.)
- Partition — defines how the dataset is divided into groups
- Order — specifies the order of rows within each partition
- Frame — the range of rows the function operates on
Let’s Warm Up with a Tiny Dataset
Imagine a simple orders table with just a few pizza orders:
-- 1️⃣ Create the table
CREATE TABLE orders (
    order_id INT PRIMARY KEY,
    customer_id VARCHAR(10),
    order_date DATE,
    revenue DECIMAL(10, 2)
);

-- 2️⃣ Insert sample data
INSERT INTO orders (order_id, customer_id, order_date, revenue)
VALUES
    (1, 'A', '2024-05-01', 18.00),
    (2, 'B', '2024-05-01', 22.50),
    (3, 'A', '2024-05-02', 35.00),
    (4, 'C', '2024-05-02', 15.00),
    (5, 'A', '2024-05-03', 25.00);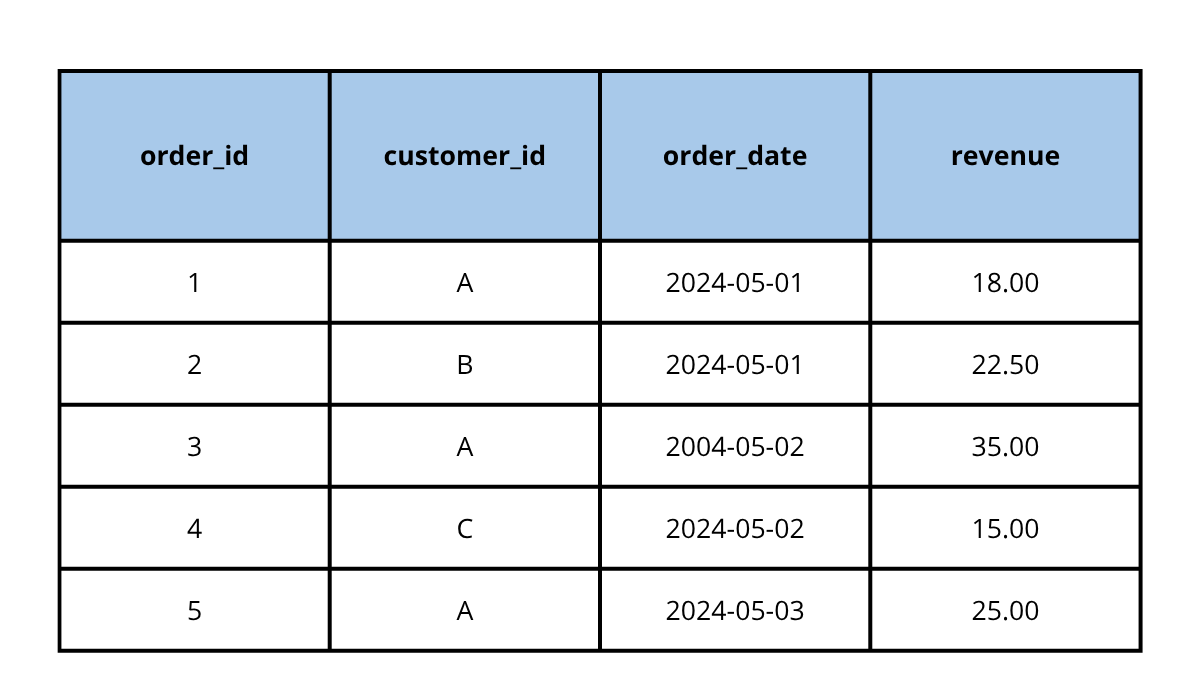
We’ll use this small dataset to explore four powerful window functions.
1. ROW_NUMBER(): Giving Each Row Its Place
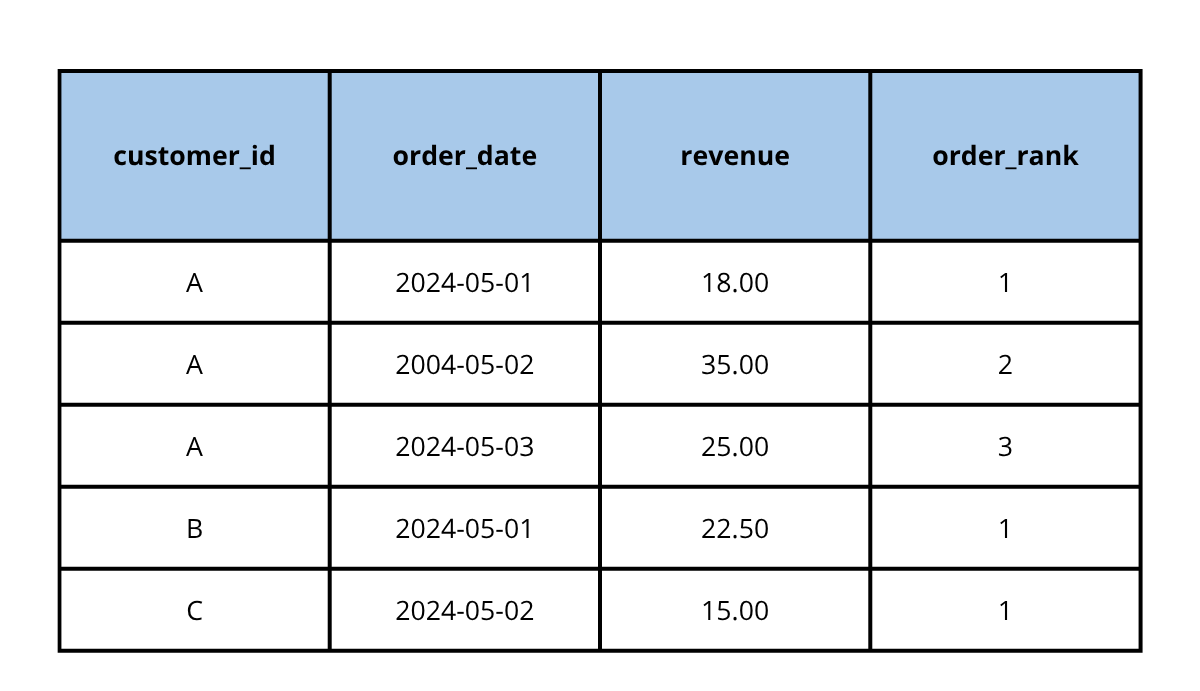
If you want to number rows within each customer group (for example, to find the first, second, or third purchase):
SELECT
  customer_id,
  order_date,
  revenue,
  ROW_NUMBER() OVER (PARTITION BY customer_id ORDER BY order_date) AS order_rank
FROM orders;Result:
Why it matters:
You can easily find a customer’s first purchase or analyze their order sequence.
2. LAG(): Looking Back in Time
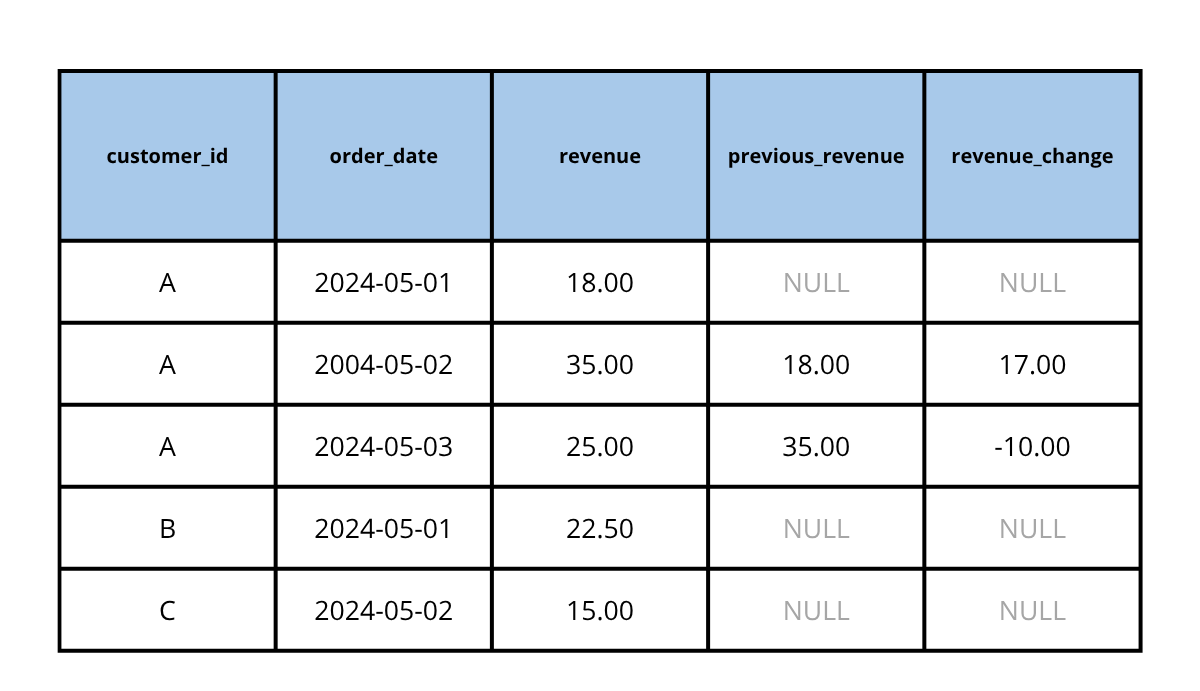
Now, suppose you want to compare each order to the previous one from the same customer:
SELECT
  customer_id,
  order_date,
  revenue,
  LAG(revenue) OVER (PARTITION BY customer_id ORDER BY order_date) AS previous_revenue,
  revenue - LAG(revenue) OVER (PARTITION BY customer_id ORDER BY order_date) AS revenue_change
FROM orders;Result:
Why it matters:
LAG() lets you measure growth, decline, or change over time — perfect for time-series or customer-behavior analysis.
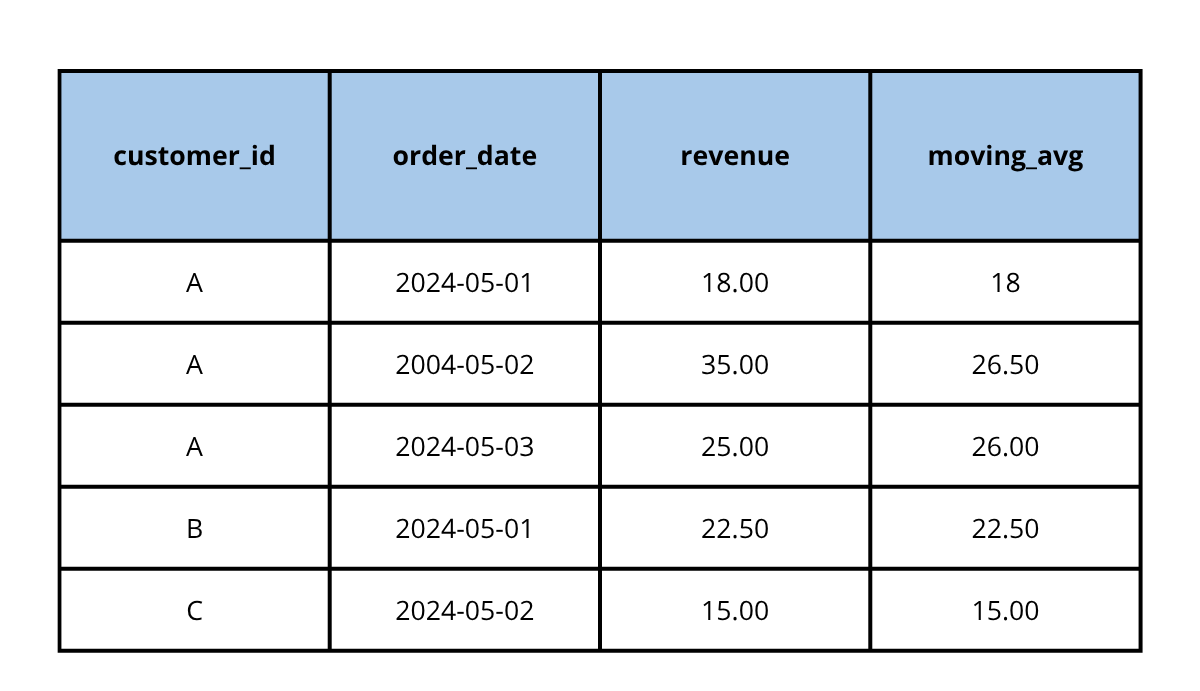
3. AVG() OVER(): Finding Moving Averages
If you want to smooth your data and see the average revenue per customer over time:
SELECT
  customer_id,
  order_date,
  revenue,
  AVG(revenue) OVER (PARTITION BY customer_id ORDER BY order_date ROWS BETWEEN 2 PRECEDING AND CURRENT ROW) AS moving_avg
FROM orders;Result:
Why it matters:
Moving averages reveal patterns that raw data hides — a must-have in sales or performance analytics.
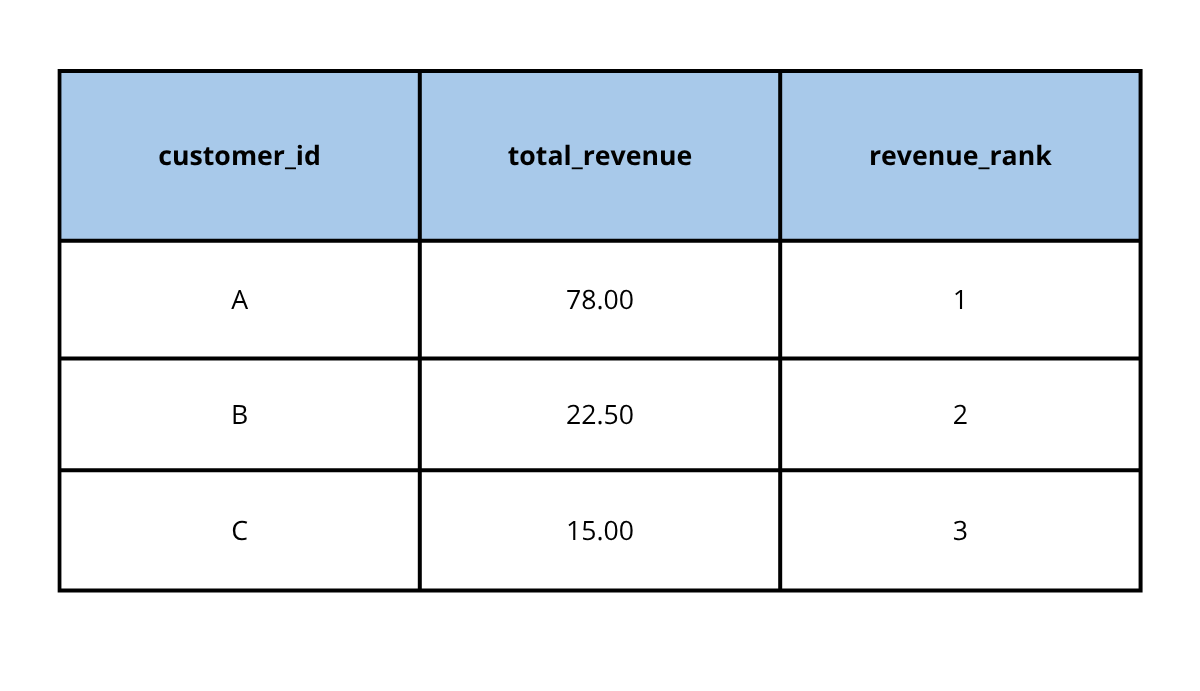
4. RANK(): Identifying Top Performers
Finally, to find which customers generated the highest total revenue:
SELECT
  customer_id,
  SUM(revenue) AS total_revenue,
  RANK() OVER (ORDER BY SUM(revenue) DESC) AS revenue_rank
FROM orders
GROUP BY customer_id;Result:
Why it matters:
Ranking instantly highlights your top customers, products, or regions.
Traditional SQL vs. Window Functions
Simple summary:
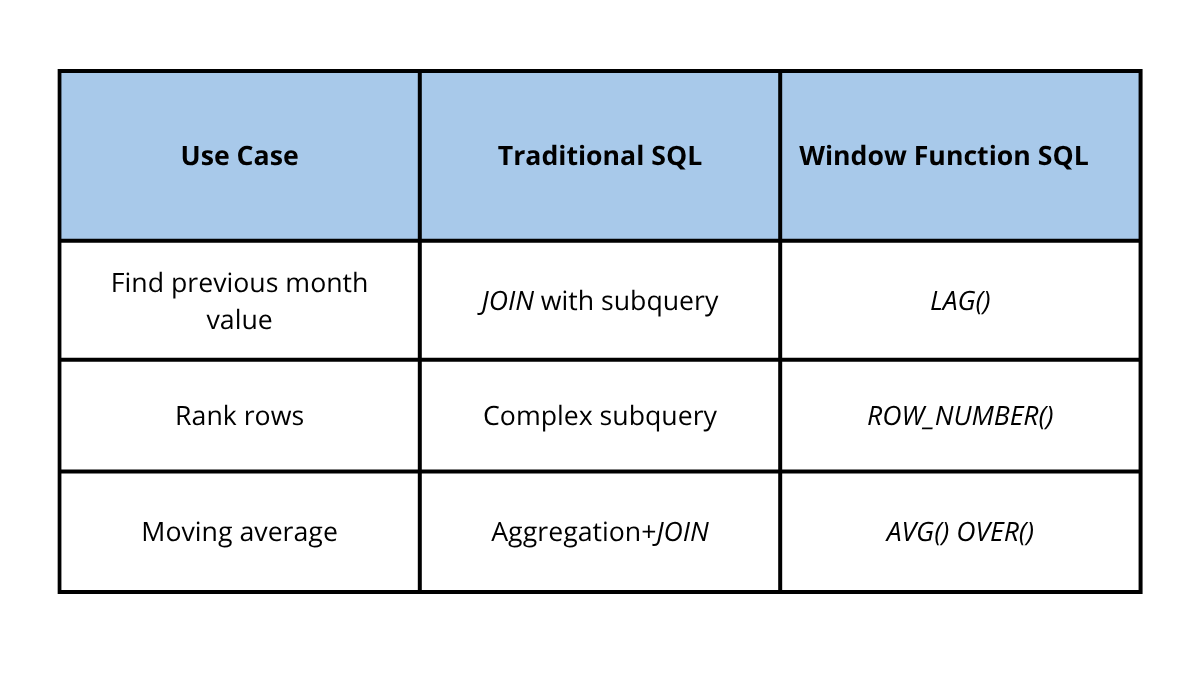
Window functions make SQL both simpler and more expressive — especially when working with time-based data.
Real-Life Example: Tracking Table Occupancy in a Pizzeria
When I was analyzing data from my pizzeria project (you can find the dataset at Maven Analytics Data Playground), I faced a real-world challenge:
How can I track, minute by minute, how many people are currently in the restaurant and how many tables are occupied?
Each order had a timestamp and the number of pizzas (roughly matching the number of people). Assuming each visit lasted one hour, I needed to track both check-ins and check-outs.
First, I unioned arrivals and departures:
SELECT  order_id,
        people_in AS no_people,
        date,
        time_in AS time,
        tables_in AS tables
FROM test.orders_time_in

UNION ALL

SELECT  order_id,
        people_out AS no_people,
        date_out AS date,
        time_out AS time,
        tables_out AS tables
FROM test.orders_time
ORDER BY date, time;
This gave me a chronological list of all “entries” and “exits.”
Then came the key part:
Calculate the number of people in the restaurant at each moment:
SELECT *,
    SUM(no_people) OVER (ROWS BETWEEN UNBOUNDED PRECEDING AND CURRENT ROW) AS people_accumulated,
    SUM(tables) OVER (ROWS BETWEEN UNBOUNDED PRECEDING AND CURRENT ROW) AS tables_occupied
FROM (
    -- combined in/out data
) data;
💡 The SUM() OVER() window function allowed me to calculate running totals — in other words, a live count of how many customers were in the pizzeria at each time point.
The result was almost like a live dashboard in SQL:
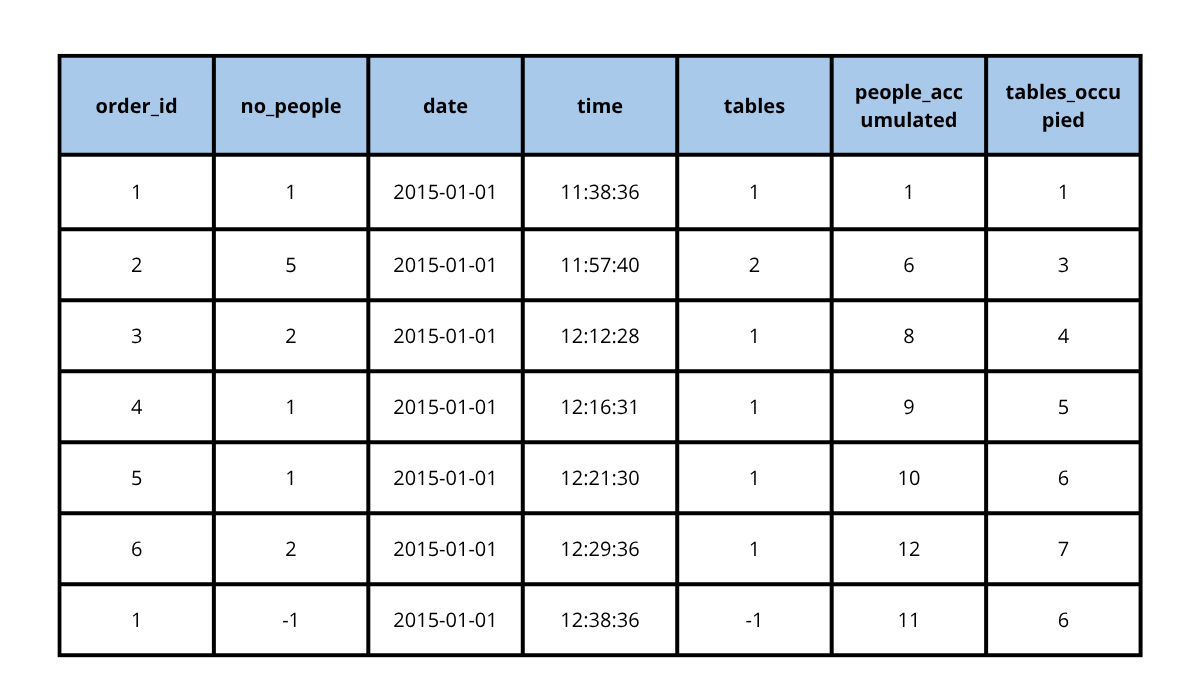
A sample from the resulting table
Once I had that, I could detect overload moments:
WHERE people_accumulated > 60
or
WHERE tables_occupied > 15
to identify when the restaurant exceeded its seating capacity.
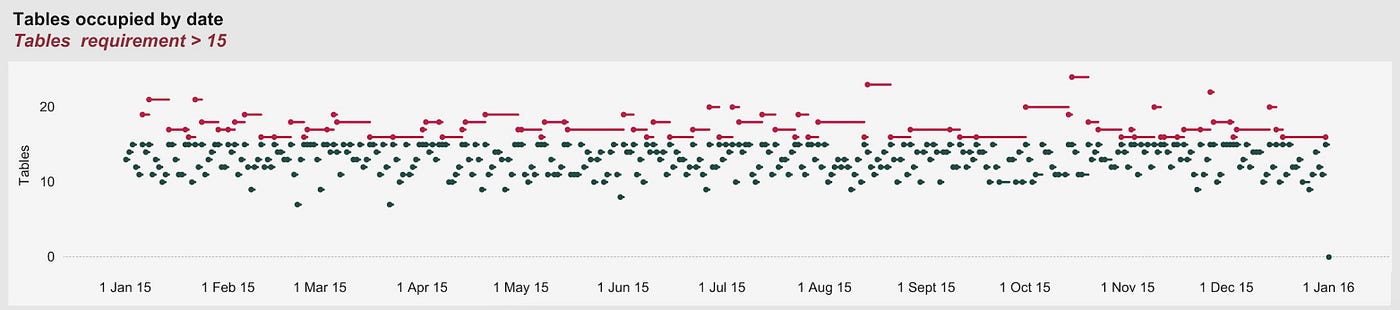
The analysis showed that during lunch hours, two-person tables were often full while larger ones sat empty. A simple operational change — adding smaller tables — could improve turnover and comfort without expanding the space.
Key Takeaway
Window functions aren’t just “advanced SQL’’. They’re a way to understand how values evolve over time — something ordinary SQL can’t do.
Once you realize that window functions don’t group data but let each row “look around itself,” everything clicks. It’s one of those SQL concepts that feels like magic once it sinks in — and once it does, you’ll never go back.
The contents of external submissions are not necessarily reflective of the opinions or work of Maven Analytics or any of its team members.
We believe in fostering lifelong learning and our intent is to provide a platform for the data community to share their work and seek feedback from the Maven Analytics data fam.
*Submit your own writing here if you’d like to become a contributor.*
Happy learning!
-Team Maven
메타데이터
- post_id
- a7a8a91d2b4d
- slug
- why-analysts-love-sql-window-functions-and-why-you-should-too-a7a8a91d2b4d
- url
- https://medium.com/learning-data/why-analysts-love-sql-window-functions-and-why-you-should-too-a7a8a91d2b4d
- canonical_url
- https://medium.com/learning-data/why-analysts-love-sql-window-functions-and-why-you-should-too-a7a8a91d2b4d
- author_url
- https://medium.com/@moon2512
- status
- ok
- fetched_at
- 2026-07-14 22:28:10