From 5 fps to 30 fps: What the TFLite Defaults Are Hiding
A detection pipeline I worked on ran at about 5 fps on a rugged Snapdragon device. Not because the model was wrong. Because every default…
From 5 fps to 30 fps: What the TFLite Defaults Are Hiding
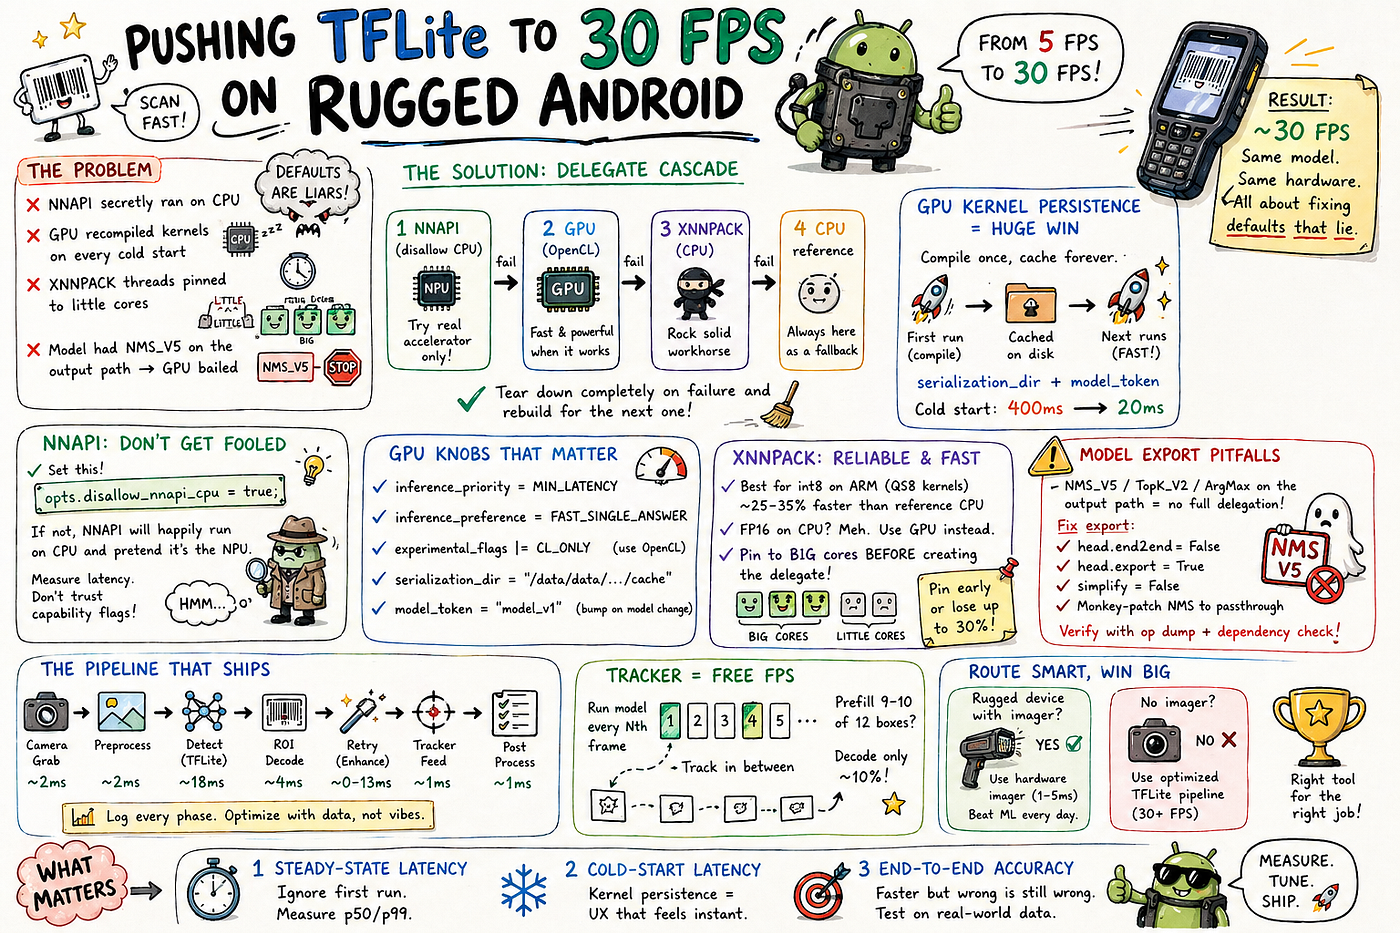
generated using chatgpt
A detection pipeline I worked on ran at about 5 fps on a rugged Snapdragon device. Not because the model was wrong. Because every default we’d accepted was lying. NNAPI was secretly running on the CPU. The GPU delegate was recompiling kernels from scratch on every cold start. The XNNPACK threads were pinned to whatever core the Android scheduler felt like that morning, including the little ones. And the model, despite an nms=False flag in the export script, had a fully traced NMS_V5 op sitting on the output dependency path, which guaranteed the GPU delegate would silently bail at delegation time.
You know the contractor who shows up in a branded van, quotes you for the speciality work, then quietly hands the actual labour to whoever was free that morning? The whole TFLite-on-Android stack is that, top to bottom. Every layer claims a job. Most of them subcontract it back down to whatever’s cheapest, and you only find out when you measure.
After two weeks of measuring instead of guessing, that same pipeline ran at ~30 fps on the same hardware. None of the wins came from changing the model architecture. All of them came from finding which “specialist” was actually a guy with a screwdriver.
This is what nobody actually tells you before you ship on-device ML on Android.
The delegate cascade is not optional
The most common mistake in TFLite production code is picking one delegate and praying. That works for demos, but it doesn’t survive contact with five OEMs and twenty SoCs.
The right architecture is a cascade with explicit, audited fallback:
NNAPI (with strict CPU disallow) → GPU → XNNPACK → CPU referenceEach step has to be torn down on failure fully. Interpreter, options, delegate handle, all of it. If you leave a half-initialised delegate alive when you fall through to the next one, you get the worst kind of bug: an interpreter that looks fine until invoke() returns garbage.
Here’s the shape of it in C++. The delegate options structs are layout-fragile across TFLite versions, so I lean on hand-written extern “C” forward declarations instead of pulling in the headers. It sidesteps a whole class of .so/header version mismatches at the cost of locking you to a specific runtime build.
// Pragmatic shape: include nnapi_delegate_c_api.h for the struct + Default(),
// keep the rest header-free with extern "C" forward decls.
#include "tensorflow/lite/delegates/nnapi/nnapi_delegate_c_api.h"
extern "C" {
TfLiteDelegate* TfLiteNnapiDelegateCreate(const void* options);
void TfLiteNnapiDelegateDelete(TfLiteDelegate*);
}
bool tryNnapi(Interpreter* interp) {
TfLiteNnapiDelegateOptions opts = TfLiteNnapiDelegateOptionsDefault();
opts.disallow_nnapi_cpu = true; // critical, see next section
TfLiteDelegate* d = TfLiteNnapiDelegateCreate(&opts);
if (!d) return false;
if (interp->ModifyGraphWithDelegate(d) != kTfLiteOk) {
TfLiteNnapiDelegateDelete(d);
return false;
}
return true;
}
You can go fully header-free by also forward-declaring the options struct and Default(), but the struct layout is the most version-fragile thing in this file, so I concede the one include and keep the create/delete entry points as plain symbols.
The cascade itself is just a chain of these, where each try* function rebuilds the interpreter from scratch on failure. Don’t try to reuse the interpreter after a failed delegate attempt, even though the API technically allows it. The internal kernel state is left in an unexpected shape, and you’ll spend an afternoon debugging it.
NNAPI is a mirage on most enterprise devices
This one cost me three days.
TfLiteNnapiDelegateOptionsDefault() returns a struct where disallow_nnapi_cpu is set to false. That sounds harmless. It isn’t. What it actually means: if the vendor’s NN-HAL reports that it can’t run an op (which happens for many ops on a lot of devices), NNAPI silently routes the model to its own CPU reference kernels. Initialisation succeeds. Inference works. Latency is horrible, but no error fires. You think you’re on the DSP or NPU. You’re not. The branded van pulled up. The actual work is being done by the same generic CPU you could have hired directly, at three times the cost.
Hence, always set this:
opts.disallow_nnapi_cpu = true;Now, if NNAPI can’t run on real hardware, init fails loudly, and your cascade falls through to the GPU as it should.
A second trap: on enterprise/rugged ROMs, NNAPI is often a thin wrapper around the same CPU reference implementation regardless of what the device’s HAL claims. The HAL says, “I support FP16 quantised convs.” The actual binary running underneath is generic ARM CPU code. Measure latency. Don’t trust capability flags.
accelerator_name pinning helps a little. You can force a specific HAL by name, e.g. “google-edgetpu” or a vendor-specific string, and skip the discovery dance. Still, those names are device-specific and not stable across firmware versions. If you ship an allowlist, expect to maintain it.
One knob to ignore in this neighbourhood: allow_fp16. It only controls FP32-to-FP16 promotion on float graphs and is meaningless for int8-quantised models. Toggling it on an int8 model is cargo-cult, copied from Stack Overflow answers written for a different model class.

The GPU delegate is fast, finicky, and version-fragile
The GPU delegate ships as a separate shared library: libtensorflowlite_gpu_jni.so. It must match the version of your main TFLite .so exactly. Not “close enough”. Exactly. If they’re off by a point release, you get a SIGSEGV at create time with a stack trace that points into ABI-mangled symbols and leaves you with no useful information.
The way I ship it, pull tensorflow-lite-gpu from Maven as an AAR, have a Gradle task extract the .so for the relevant ABI into a known location, and have CMake link against it as an IMPORTED library. The same pattern works for onnxruntime-android if you’re shipping both.
// build.gradle.kts excerpt
val extractGpuSo by tasks.registering(Copy::class) {
from(zipTree(tfliteGpuAar)) {
include("jni/arm64-v8a/libtensorflowlite_gpu_jni.so")
eachFile { path = name }
}
into(layout.buildDirectory.dir("native/arm64-v8a"))
}
Now the CMake side:
add_library(tflite_gpu SHARED IMPORTED)
set_target_properties(tflite_gpu PROPERTIES IMPORTED_LOCATION
${CMAKE_CURRENT_SOURCE_DIR}/../../../build/native/${ANDROID_ABI}/libtensorflowlite_gpu_jni.so)
Do not wrap that set_target_properties in an if(EXISTS …) check. AGP runs preBuild, and the CMake configure step in an order that lets the EXISTS check evaluate to false on the first build, because Gradle hasn’t extracted the file yet at the moment CMake configures. The library reference goes missing, your feature #define never gets set, and the GPU code path silently compiles out. I lost most of an afternoon to this. Just trust the file will be there at link time.
One more piece of plumbing if you ship this as a library AAR. The .so you extracted is for linking only. The consumer module already runtime-depends on tensorflow-lite-gpu, and AGP will throw a duplicate-jniLibs error trying to merge two copies. Exclude it from packaging:
android {
packaging { jniLibs.excludes += "**/libtensorflowlite_gpu_jni.so" }
}
Same for onnxruntime-android. Skip this, and your library compiles fine in isolation and breaks every consumer app on first integration.
Knobs that actually matter:
The TfLiteGpuDelegateOptionsV2 struct is layout-fragile (same forward-declaration trick applies), but a handful of fields move the needle hard:
inference_priority1 = TFLITE_GPU_INFERENCE_PRIORITY_MIN_LATENCY. The default is MAX_PRECISION, which biases everything toward fp32-equivalent math. For real-time camera work, you want latency, not precision.
inference_preference = TFLITE_GPU_INFERENCE_PREFERENCE_FAST_SINGLE_ANSWER. Tells the runtime not to optimise for sustained throughput, just for one shot.
experimental_flags |= TFLITE_GPU_EXPERIMENTAL_FLAGS_CL_ONLY. On Adreno especially, force OpenCL. The GL backend is slower and has weirder edge cases.
Kernel persistence is the difference between a 400 ms first frame and a 30 ms first frame
This is the single biggest underused feature in the GPU delegate. Set serialization_dir and model_token, and OpenCL kernels will be compiled once, cached on disk, and reused on every subsequent app launch.
// Both pointers must outlive the delegate. strdup is intentional:
// it detaches the C-string lifetime from any local std::string. Free
// when you tear down the delegate, not before.
opts.serialization_dir = strdup(cacheDirPath.c_str());
opts.model_token = strdup("model_v1"); // bump on model swap
Without it, the OpenCL driver has to recompile every kernel from source on every cold start. In one investigation, there was 150–400 ms of compile time on the first inference of every app launch. With persistence enabled, that drops to 10–30 ms after the first run. The cost: a few MB of disk per cached model. Worth it ten times over.
The token has to change when the model changes. Otherwise, you load stale kernels against a graph they don’t fit, which gives you another silent garbage-output bug.
XNNPACK is the workhorse you take for granted
When NNAPI bails and the GPU isn’t available (or the model has an op that the GPU can’t handle), XNNPACK is what you fall through to. It’s the most reliable thing in the runtime.
- What XNNPACK is good at: int8 inference on ARM CPUs with proper QS8 kernels. In one test, the same model went from ~32 ms to ~21 ms by switching from TFLite’s reference CPU kernels to XNNPACK. That’s roughly 25–35% faster, repeatable across A78-class cores.
- What XNNPACK is mediocre at: FP16. The FP16 path on ARM CPU is barely faster than the FP32 reference, because the relevant SIMD intrinsics aren’t quite the win you’d think. If your model is FP16, the GPU delegate is where the win lives, not XNNPACK. FP16 is GPU-only territory in practice.
The XNNPACK delegate symbols are bundled in the main TFLite .so, so no separate library shenanigans. Same extern “C” forward declaration trick. Pass nullptr for options if you want it to inherit the interpreter’s SetNumThreads setting, which is the right default 90% of the time.
One nasty failure mode. XNNPACK can SIGSEGV at Interpreter::Create on post-NMS exports containing TFLite_Detection_PostProcess. The same model at a smaller input size sometimes “works”, which is the worst trap: XNNPACK partially delegates with no measurable speedup, logs look healthy, and the only hint is its contribution to wall-clock time is zero. The cascade falling through to the plain CPU is what keeps the app alive.
Pin to big cores. Pin BEFORE delegate creation.
big.LITTLE and DynamIQ are silent perf killers for parallel CPU inference. If you spread XNNPACK’s worker threads across A78S and A55S, every barrier in the kernel waits on the slowest A55. You can lose 30% of your throughput to a single thread on a little core that the OS scheduler decided was a great place for your workload.
The fix is to pin to big cores. Detection logic, in rough form:
int maxFreq = 0;
std::vector<int> bigCores;
for (int cpu = 0; cpu < cpuCount; cpu++) {
int f = readMaxFreq(cpu); // /sys/devices/system/cpu/cpuN/cpufreq/cpuinfo_max_freq
if (f > maxFreq) { maxFreq = f; bigCores = {cpu}; }
else if (f == maxFreq) { bigCores.push_back(cpu); }
}
Some enterprise ROMs lock down sysfs, and that read returns -1. Fall back to a “cores 4–7” heuristic for known SoC families and call it a day.
- Now the part nobody mentions in the docs: XNNPACK’s pthreadpool spawns its workers at delegate create time, and they inherit the calling thread’s affinity at that moment. If you set affinity at invoke time, you’ve pinned the calling thread, but the workers were spawned hours ago against a different mask. They’ll happily keep migrating onto little cores. Pin first, create the delegate after, never the other way around.

One thing to verify with measurement: on some devices, the kernel’s interactive scheduler already biases hot threads to big cores hard enough that explicit pinning is a wash. Don’t assume the win exists. Confirm.
Hexagon DSP: high ceiling, high integration cost
Snapdragon-only. Requires the Hexagon SDK and a model quantised into a specific schema. Not all int8 models qualify; the per-tensor symmetric quant scheme that the Hexagon delegate expects is narrower than what TFLite int8 generally accepts.
When it works, it’s outstanding. On certain Snapdragon SKUs, it can outperform the GPU on integer workloads, because the DSP is hand-tuned for exactly that math and isn’t competing with display rendering for shader cycles.
It has the same partition-around-unsupported-ops behaviour as the GPU delegate. If your graph has NMS, TopK, ArgMax, or control flow on the output dependency path, the delegate hands the offending subgraph back to the CPU and runs everything past it there, too. You’re paying full DSP integration cost for partial DSP execution, with the slowest part of the graph back on the chip you were trying to avoid. The shape of the integration is the same as everything else: feature-detect at runtime, attempt as a high-priority option in the cascade, fall through cleanly.
Worth it only when you’re targeting a specific Snapdragon family. If you ship to Mediatek, Samsung Exynos, and Snapdragon, the engineering investment-to-payoff ratio probably isn’t there.
Model export quirks will eat your delegation rate
I exported a YOLO model from the export framework with nms=False, expecting the graph to come out clean. It didn’t. The architecture’s detection head was calling the framework’s NMS op from inside its forward(), which got traced into the ONNX graph regardless of the export flag. The flag was on the invoice. The work wasn’t actually done. The op survived all the way to TFLite as an NMS_V5 builtin, sitting squarely on the output dependency path.
Every GPU delegate refused to delegate. Every Hexagon delegate refused to delegate. The model partitioned around the NMS op and ran the entire post-detection chunk on CPU, which on this model was about 60% of the wall-clock cost.
The full fix took four layers:
-
head.end2end = False -
head.export = True -
simplify=Falsein the export call (the onnx-simplify pass can re-fold post-process subgraphs back in even after they’ve been stripped) -
Monkey-patchThe framework’s NMS op to a passthrough, so the trace doesn’t capture it at all
Worth knowing: some recent architectures (yolov10 and similar) have NMS-aware score modification baked into the head’s forward pass. Even if NMS doesn’t reduce dimensions in the output, those ops are on the dependency chain to the output. They can’t be stripped without modifying the head’s source. This is a real ceiling on what export-flag tweaking can give you.
Verify with an op dump, not by hoping
pip install tflite
import tflite
model = tflite.Model.GetRootAsModel(open("model.tflite","rb").read(), 0)
sg = model.Subgraphs(0)
for i in range(sg.OperatorsLength()):
op = sg.Operators(i)
code = model.OperatorCodes(op.OpcodeIndex()).BuiltinCode()
if code in (126, 107, 69): # NMS_V5, TopK_V2, ArgMax
print("blocker:", code, "at op", i)
If any of those land on the output dependency path, the GPU delegate isn’t going to fully delegate, and you need to fix the export.
The honest caveat: that snippet counts the presence of opcodes, not their reachability. An NMS op in a dead branch won’t block delegation, and the snippet flags it anyway. To determine whether a NMS_V5 / TopK_V2 / ArgMaxactually blocks GPU delegation, walk operator outputs back from the model’s output tensors and confirm the suspect op sits on the dependency chain. Build a producer map (tensor index → op index that writes it), then reverse-BFS from the output tensors:
producer = {}
for i in range(sg.OperatorsLength()):
op = sg.Operators(i)
for j in range(op.OutputsLength()):
producer[op.Outputs(j)] = i
reachable = set()
queue = [sg.Outputs(i) for i in range(sg.OutputsLength())]
visited = set(queue)
while queue:
t = queue.pop()
if t not in producer:
continue
op_idx = producer[t]
if op_idx in reachable:
continue
reachable.add(op_idx)
op = sg.Operators(op_idx)
for j in range(op.InputsLength()):
inp = op.Inputs(j)
if inp not in visited:
visited.add(inp)
queue.append(inp)
# Now check: are the blocker ops in `reachable`?
blockers = {126: 'NMS_V5', 107: 'TopK_V2', 69: 'ArgMax'}
for i in range(sg.OperatorsLength()):
op = sg.Operators(i)
bc = model.OperatorCodes(op.OpcodeIndex()).BuiltinCode()
if bc in blockers and i in reachable:
print(f'op#{i} {blockers[bc]} reaches model output, will block GPU delegation')
If that loop prints nothing, your blocker ops are dead code, and the GPU delegate will accept the graph. If it prints anything, the export is still leaking into the graph during post-processing, and you need to go back to the head’s forward() to find the leak.
Probe inference with a real image
Op-dump tells you what’s in the graph, not whether the graph behaves the way you think. Once the dump is clean, run a single inference in Python (tflite-runtime or ai-edge-litert) on a real image, not zeros, not noise, and confirm output scores land in [0, 1]. If they’re raw logits in some weird range like [-12, 8], your sigmoid never got baked into the export, and your Android decoder will threshold against the wrong distribution. You’ll see “no detections” on a perfectly working model. The contractor said the cache was wired; you still check the breaker.
The TFLite-vs-ONNX coordinate divergence
The export framework’s TF wrapper replaces the box-decode op for the TFLite export with a TF-specific implementation that divides box coordinates by imgsz. So the same model emits [0..1]-normalised coords from TFLite and pixel-space coords from ONNX. A native parser that doesn’t handle both will silently misplace every box from either build.
Auto-detect by sampling max(w, h) on the first frame. If it’s > 1.5, you’re in pixel space; otherwise, normalised. Don’t hardcode.
Concretely, for the most common case: 1-class AABB at 640 is [1, 5, 8400] (4 box + 1 score),1-class OBB is [1, 6, 8400] (4 box + 1 score + 1 angle). If your decoder sees [1, 5, …]and you wrote it for OBB, you’re reading the angle out of the score channel.
A specific gotcha: some legacy code orders OBB output channels as [cx, cy, w, h, angle, scores…]. Stock OBB exports put angle LAST: [cx, cy, w, h, scores…, angle]. Get this wrong, and every rotated box rotates by the wrong scalar. The boxes look almost right. Almost.
Input size dominates everything else
Before you spend a week chasing delegate options, change the input size and measure.
Going from 640 to 416 is roughly 2.4× fewer FLOPs for a typical YOLO-class model. That’s about 2× detect speedup, larger than the win from any single delegate change in this article. Going from 416 to 320 is another ~1.7× on top of that.
The trade-off is recall on small or distant objects. Test on real-world data, not synthetic benchmarks where every target is centred and well-lit. In one investigation, dropping from 640 to 416 cost 3% recall on real footage, and the perf headroom that bought funded a tracker that recovered most of it.
The tracker carry-forward trick
The cheapest perf win I’ve ever shipped: don’t run the model every frame.
Run it every Nth frame. Have a tracker (Kalman filter, ByteTrack, your call) propagate boxes between detections. Most ROIs in frame N+1 are already known good content from frame N, so the post-detection decoder skips them entirely. With a tracker that prefills 9–10 of 12 detections per frame, the decoder runs on ~10% of the boxes it would otherwise see.
Running the model every 2nd or 3rd frame is essentially free on stable scenes. Bumping to every 5th frame is mostly free. Past that, recall on fast-moving targets starts to suffer, but you’ll know because your end-to-end accuracy metric will tell you so. (You do have an end-to-end accuracy metric, right? If you don’t, none of these perf optimisations is safe to ship.)
There’s a related trap once you wire enhancement-retry into the tracker loop. A persistently undecodable box (glare on a curved image, a torn image, a sticker half-covering another) keeps returning to the retry pipeline every frame for as long as the tracker holds the track. That’s a recurring 10–15 ms tax on a track that will never decode. Keep a per-track failure counter, stop attempting enhancement after N consecutive failures (we used 3), and let the tracker keep propagating the box for visualisation until the track drops and re-acquires with a fresh ID.
(The pipeline described here adds image enhancement between the tracker output and the decoder: it is specific to applications that require a secondary decoding step, such as barcode or label reading on top of object detection.)
The retry pipeline:
The retry pipeline catches the ROIs that the unenhanced direct-decode pass gives up on: CLAHE for low-contrast crops, gamma correction for over/under-exposed ones, and decode again. Two small structural choices here moved more wall-clock time than most delegate tuning above.
Parallelise CLAHE and gamma, don’t sequence them
Inside the retry path itself, the naive shape is sequential: enhance A → decode → if-fail → enhance B → decode. Worst case for one ROI is the sum of all four, ~24 ms on the device I was profiling. The two enhancements don’t depend on each other, and either decode is fine to ship. Run them concurrently and take whichever returns first. Wall time drops to the max of the two paths, ~13 ms. Same passes, same decode rate. The CAS flag pattern in the profiling section at the end of this article is what lets the loser bail cleanly.
Skip the unenhanced fast path for low-confidence detections
ML detections with confidence in [0.25, 0.40] are usually slightly imprecise: the box is a few pixels off, the crop misses an edge bar, the symbology corner gets clipped. The fast decode path fails on these and burns ~10 ms per ROI before enhancement-retry kicks in. Route low-conf ROIs straight to retry. Keep the threshold conservative. We used 0.40, not 0.55, because pushing higher costs recall on borderline-but-decodable detections that the fast path handles fine when the crop is tight.
The async myth
TFLite ≥ 2.13 has async kernel infrastructure. Java Interpreter.runSignatureAsync exists. There’s a whole story in the release notes about fence-based scheduling and concurrent invocations.
In practice, the C API for InvokeAsync and fence registration is not exposed in many .so builds shipping today, including the AAR builds I checked from Maven Central. The release notes are the brochure. The shipping binary is whoever showed up. Rewriting your inference path through JNI back to Java to call the async signature is a multi-day refactor that gives you a lot of complexity for marginal latency savings.
The pseudo-async approach (run the interpreter on a dedicated worker, do preprocess on the camera thread) only saves preprocess time, which on a tuned pipeline is 3–5 ms. The GPU delegate itself is single-context, so two parallel inferences serialise at the driver level anyway. Often not worth the complexity. Verify with a profile before committing.
Before wrapping up with what worked, it’s worth recording what looked promising and wasn’t — saving you the same wrong turns.
Things that didn’t work
The “didn’t work” list is the part of this write-up I wish someone had handed me on day one.
Big-core pinning at invoke time: The pthreadpool workers were already spawned with whatever affinity the kernel gave them. Setting affinity on the JNI thread later did nothing for the workers.
Structure tensor for AABB-to-OBB synthesis: Mathematically clean, computationally cheap. The problem: an AABB-trained model can’t detect rotated objects to begin with. It outputs axis-aligned boxes around clearly-rotated targets, with the wrong centre. Synthesising rotation from local gradients gave us the wrong rotation around the wrong centre. Solving the wrong problem.
TFLite library upgrade for true async invoke: The .so was upgraded to 2.16.1. The C API for async invoke still isn’t exposed. The release notes are aspirational.
Speculative parallel decode of every ROI on the fast path: Throwing the GPU at every ROI in parallel costs more in dispatch overhead than it saves on tight scenes. The cleaner fix was the routing rule above (low-conf goes straight to retry), not blanket parallelism on the fast path.
Spin-poll waiting on GPU completion: Burned CPU cycles that the OS needed for other things. Net loss.
Profile per-phase, after every change
A “frame is slow” log is useless. Per-phase timings are everything: preprocess, detect, ROI decode, enhancement retry, tracker feed, post-process. Log them as a single structured line per frame.
[frame 1247] preprocess=2.1 detect=18.4 decode=4.2 retry=0.0 track=0.8 post=1.1 total=26.6
The bottleneck migrates as you optimise. After GPU delegation lands, decoder retry can dominate. After the retry is parallelised, the post-process tail dominates. After the tail is fixed, the preprocess shows up. If you optimise blindly without measuring after every change, you’ll spend a week tuning the thing that stopped being the bottleneck on day two.
The CAS pattern that makes the parallel retry pass clean is small enough to inline: A per-ROIstd::atomic<bool> the first successful decoder flips, with the other strategy checking it at every cancellation point and dropping out the moment it does. No locks, no condition variables. Both write the same payload shape, so the race is correct by construction.
What actually matters when you’re done
Three numbers tell you whether the optimisation worked.
Steady-state latency: not the first inference. The first inference always pays for kernel compile, JIT, weight repack, and whatever the driver decides to do on a cold OpenCL context. Don’t include it in the average. If your p50 is 22 ms and your p99 is 380 ms because the first frame after every app foreground rebuilds the kernel cache, you have a UX problem that the average won’t show you.
Cold-start latency separately: This is what users feel when they tap your scan button. A 12 ms steady-state with a 400 ms cold start feels like a 400 ms scanner. Persistent kernel caches (the GPU serialization_dir story above) move this from “noticeable” to “imperceptible”.
End-to-end accuracy on real footage: A 2× faster model that misses 30% of targets isn’t faster end-to-end. It’s just faster at being wrong. Every perf change I shipped passed an accuracy regression suite before merging. Everyone. The ones that didn’t came back to bite me later.
The first time you measure a working pipeline against a misbehaving NNAPI default, the gap will surprise you. Mine was 5 fps to 30 fps, on the same model, on the same device, in two weeks of nothing but reading runtime source and measuring. The headroom is there. The defaults don’t give it to you, because they assume you’ll never check who’s actually doing the work.
If this saved you some debugging time, I’d love to hear what your numbers looked like. Find me on LinkedIn or Twitter / X always happy to talk on-device ML, rugged hardware war stories, or delegate gotchas I didn’t cover here.
메타데이터
- post_id
- a8fbf0d20ff6
- slug
- from-5-fps-to-30-fps-what-the-tflite-defaults-are-hiding-a8fbf0d20ff6
- url
- https://proandroiddev.com/from-5-fps-to-30-fps-what-the-tflite-defaults-are-hiding-a8fbf0d20ff6
- canonical_url
- https://proandroiddev.com/from-5-fps-to-30-fps-what-the-tflite-defaults-are-hiding-a8fbf0d20ff6
- author_url
- https://medium.com/@kashif-mehmood-km
- status
- ok
- fetched_at
- 2026-06-09 15:37:30