Looker Pro for Beginners
Getting Started with Looker: A Beginner’s Guide to Modern Business Intelligence
Looker Pro for Beginners
Getting Started with Looker: A Beginner’s Guide to Modern Business Intelligence
🔹 Introduction
In today’s data-driven world, making sense of massive amounts of information is no longer optional — it’s essential. Whether you’re a business analyst, a data enthusiast, or a product manager, having the right tools to explore and visualize data can make all the difference.
Looker (now part of Google Cloud) is one of the most powerful Business Intelligence (BI) and data exploration platforms available today. But if you’re just getting started, it can feel overwhelming.
Don’t worry — this guide is designed specifically for beginners. By the end of this article, you’ll have a solid understanding of what Looker is, how it works, and how to start using it confidently.
🔹 What is Looker?
Looker is a cloud-based Business Intelligence (BI) and data analytics platform that helps organizations explore, analyze, and share real-time business insights.
Originally founded in 2012, Looker was acquired by Google Cloud in 2020 and has since become a core part of the Google Cloud ecosystem.
Key Features of Looker:
- 📊 Interactive Dashboards — Build beautiful, real-time dashboards
- 🔍 Data Exploration — Drill down into your data without writing SQL
- 🧱 LookML — A powerful modeling language to define data relationships
- 🔗 Data Integration — Connects to BigQuery, Snowflake, Redshift, and more
- 🤝 Collaboration — Share reports and insights across teams easily
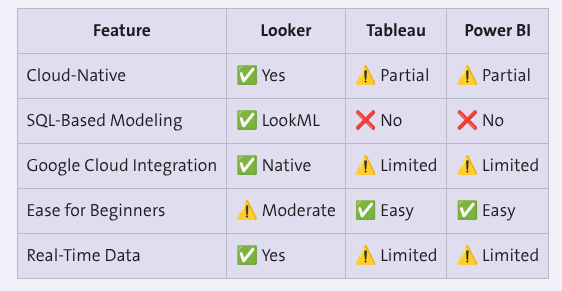
🔹 Looker vs. Other BI Tools
🔹 Core Concepts You Must Know
Before diving in, let’s understand the building blocks of Looker:
1. 📁 Explores
An Explore is where you go to query and analyze your data. Think of it as a smart, visual SQL query builder. You select dimensions and measures to build your report.
2. 📐 Dimensions
Dimensions are descriptive attributes of your data — things like Customer Name, Date, Country, or Product Category. They help you slice and filter your data.
3. 📏 Measures
Measures are calculated values — like Total Revenue, Count of Orders, or Average Session Duration. They answer the “how much” or “how many” questions.
4. 📋 Looks
A Look is a saved report or visualization created from an Explore. You can save, share, and embed Looks across your organization.
5. 📊 Dashboards
A Dashboard is a collection of multiple Looks and visualizations displayed together on one screen for a comprehensive view of your data.
6. 🧱 LookML
LookML (Looker Modeling Language) is the backbone of Looker. It defines how your database tables relate to each other and how metrics are calculated. As a beginner, you don’t need to master it right away, but knowing it exists is important.
🔹 Step-by-Step: How to Get Started with Looker
✅ Step 1: Access Looker
- Sign in to your organization’s Looker instance or
- Start a free trial via Google Cloud
✅ Step 2: Navigate the Interface
Once logged in, you’ll see:
- Home — Your personalized dashboard
- Explore — Where you query data
- Dashboards — Pre-built or custom dashboards
- Looks — Saved reports
✅ Step 3: Run Your First Explore
- Click on Explore in the top navigation
- Select a data model (e.g., Orders, Users)
- Choose Dimensions (e.g., Country, Date)
- Choose Measures (e.g., Total Revenue)
- Click Run ▶️
- View your results as a table or chart!
✅ Step 4: Create a Visualization
- After running a query, click on the Visualization tab
- Choose from Bar, Line, Pie, Map, and more
- Customize colors, labels, and axes
✅ Step 5: Save as a Look or Add to Dashboard
- Click Save → As a Look to save your report
- Or click Save → To Dashboard to add it to an existing or new dashboard
🔹 Tips for Looker Beginners
💡 Start with pre-built dashboards — Most Looker instances come with ready-made dashboards. Explore them first to understand what’s available.
💡 Use filters wisely — Filters help you narrow down data. Always filter by date range to avoid slow queries.
💡 Learn LookML gradually — You don’t need to know LookML to use Looker, but learning the basics will make you a power user.
💡 Leverage the Looker Community — Google’s Looker Community is full of tutorials, tips, and answers.
💡 Take Looker’s free training — Google offers free courses on Looker Studio to help you level up.
🔹 Common Use Cases for Looker
- 📈 Sales Analytics — Track revenue, pipeline, and rep performance
- 🛒 E-commerce Insights — Monitor orders, returns, and customer behavior
- 📣 Marketing Analytics — Measure campaign performance and ROI
- 🏥 Healthcare Reporting — Analyze patient data and operational metrics
- 💰 Finance Dashboards — Monitor budgets, forecasts, and KPIs
🔹 Conclusion
Looker is a game-changer for anyone who wants to make data-driven decisions without being a data scientist. With its intuitive Explore interface, powerful dashboards, and deep integration with Google Cloud, it’s a tool worth mastering.
As a beginner, the key is to start small — explore your data, build a simple dashboard, and gradually learn more advanced features like LookML.
“Data is the new oil — but only if you know how to refine it.”
Start your Looker journey today, and turn raw data into powerful insights! 🚀
메타데이터
- post_id
- a9a76520522e
- slug
- looker-pro-for-beginners-a9a76520522e
- url
- https://medium.com/@abhijeetsugam/looker-pro-for-beginners-a9a76520522e
- canonical_url
- https://medium.com/@abhijeetsugam/looker-pro-for-beginners-a9a76520522e
- author_url
- https://medium.com/@abhijeetsugam
- status
- ok
- fetched_at
- 2026-07-13 06:23:13