Analyzing Paul Pogba skills in the 2018 FIFA World Cup Finals — with Data.
And how to create and visualize a Streamlit app
Analyzing Paul Pogba skills in the 2018 FIFA World Cup Finals — with Data.
And how to create and visualize a Streamlit app
This is my second article on my Soccer Analytics journey. In the course, we’ve been given a project to analyze a player of our choice in a game. A core memory of mine was watching the 2018 FIFA World Cup Finals between France and Croatia at the Brandenburg Tor in Berlin with my roommate.
And so when this challenge came, it took my mind back to one of my most memorable games watched ! Ofcourse I supported France and they won 4–2 against Croatia. In a Finals game, it can only go two ways. One team wins, and the other loses. There needs to be a winner. So even if there’s a draw at half time, penalties will be played to ascertain a winner.
Skkrrrrr, let’s run it back to the knowledge acquisition. How will I be able to do data analysis of Pogba if I didn’t have the skills. So leading up to this moment, I had to learn from the Soccermatics course page on how to plot and visualize player’s actions on the pitch — passes and shots.
The data on footballers, can be found on *Statsbomb and [Wyscout](https://soccermatics.readthedocs.io/en/latest/gallery/plot_UsingWyscout.html)*. At least that’s what’s being used in this course. Especially for this activity, Statsbomb data is used.
I did a lot of iteration. In the end I decided to analyze how quickly Paul Pogba made a shot in the final third when he had the ball in his possession. If you watch the game, you’ll see that just before Pogba scored France’s third goal, he made a first attempt which hit one of Croatia’s players and rebounded. The scoring shot was taken after the rebound. This scenario alone got me thinking.
The hypothesis is, Faster post-recovery decision-making is positively associated with offensive efficiency in the final third.
Now I am moving into tutorial mode and will give you the step-by-step of how one can visualize their analysis. We are not just doing this in a vacuum. As an analyst or data scientist, once you do analysis, you need to be able to communicate your findings to the relevant stakeholders.
I am biased towards jupyter notebook. So that’s the IDE I use in almost all of my programming. I won’t take you through the code I used in this article, but in a subsequent one.
Visualizing with Streamlit
Before using Streamlit, open your terminal / command prompt and install it using pip. Be sure to install it in the directory you are working in (the one where your running python code is stored)
[embed]how to install streamlit using pip
To be able to use streamlit with your code, you need to import it along with the other libraries and packages you will be using to write your code.
[embed]how to import streamlit
Once your code is all done, you need to push to GitHub and store in a repository. If you are a newbie and don’t know how to do this, here’s a **resource for you**.
Next, create a free Streamlit account.
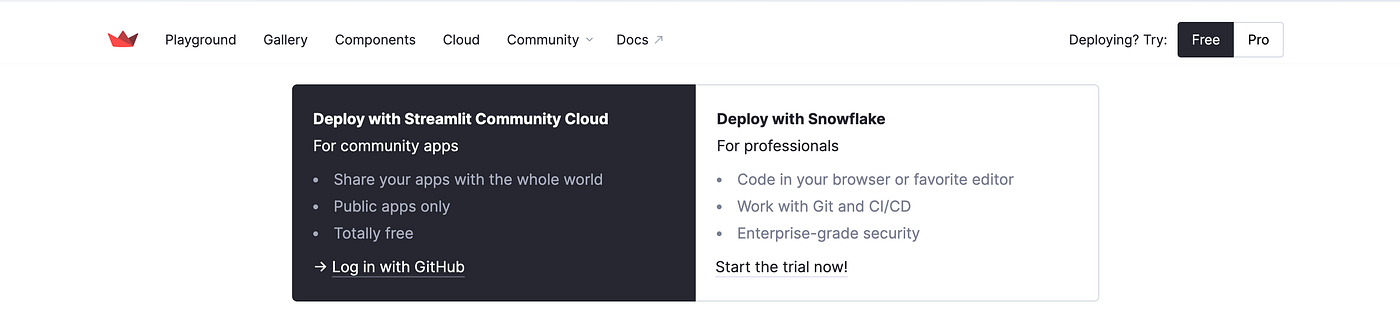
Hover over ‘Free’ button on the top right corner. Click ‘Log In with GitHub’ to connect your GitHub account. I will suggest you sign in with gmail or email, instead of directly to GitHub. At least that’s what I did to finally get connected.
My main GitHub account got flagged for suspicious activity and I have had to create a new one just for the purposes of this project.

Streamlit sign in page
Continue to sign-in and you will be redirected to a new page. However, if you don’t have an account, click sign up. Authorize the connection between both apps. Now, you’re ready.
Navigate to your Workspaces settings like in the picture below.

Streamlit start page
Click on Create app. You will be directed to a new page where you will select the ‘Deploy a public app from GitHub option’ .

Deploy a public app from GitHub option in Streamlit app
Let’s take a look a my wonnnderrrful and first attempt at deploying an application on Streamlit

I’m very open to feedback and suggestions. Contrary to popular opinion, I’m not thatttt perfect.
Helpful resources:
메타데이터
- post_id
- a9a97b0ef3a1
- slug
- analyzing-paul-pogba-skills-in-the-2018-fifa-world-cup-finals-with-data-a9a97b0ef3a1
- url
- https://medium.com/@asantechild/analyzing-paul-pogba-skills-in-the-2018-fifa-world-cup-finals-with-data-a9a97b0ef3a1
- canonical_url
- https://medium.com/@asantechild/analyzing-paul-pogba-skills-in-the-2018-fifa-world-cup-finals-with-data-a9a97b0ef3a1
- author_url
- https://medium.com/@asantechild
- status
- ok
- fetched_at
- 2026-08-01 19:45:52


