Stock Market Pulls Back as Powell Dampens Rate Cut Hopes | Weekly Analysis
Recap the market for the week of Nov 11–15, 2024. Markets retreat as Fed Chair Powell signals higher rates ahead. Analysis of inflation…
Stock Market Pulls Back as Powell Dampens Rate Cut Hopes | Weekly Analysis
Recap the market for the week of Nov 11–15, 2024. Markets retreat as Fed Chair Powell signals higher rates ahead. Analysis of inflation data, sector performance, and key levels to watch.
Economic data sources: investor.com | Edward Jones | MarketWatch

The market is pulling back
Summary: Powell’s Fed Comments Triggered Market Pullback as Inflation Concerns Persisted
Last week’s market pullback materialized as anticipated, following the robust post-election rally that had pushed major indices to elevated levels.
Federal Reserve Chair Jerome Powell’s hawkish comments on interest rates served as the catalyst for the predicted profit-taking.
October’s inflation data presented a mixed picture: headline CPI rose to 2.6% year-over-year from September’s 2.4%, while core inflation remained steady at 3.3%. The persistent inflation in housing, rent prices, and motor vehicle insurance segments overshadowed improvements in energy, gasoline, and new vehicle prices.
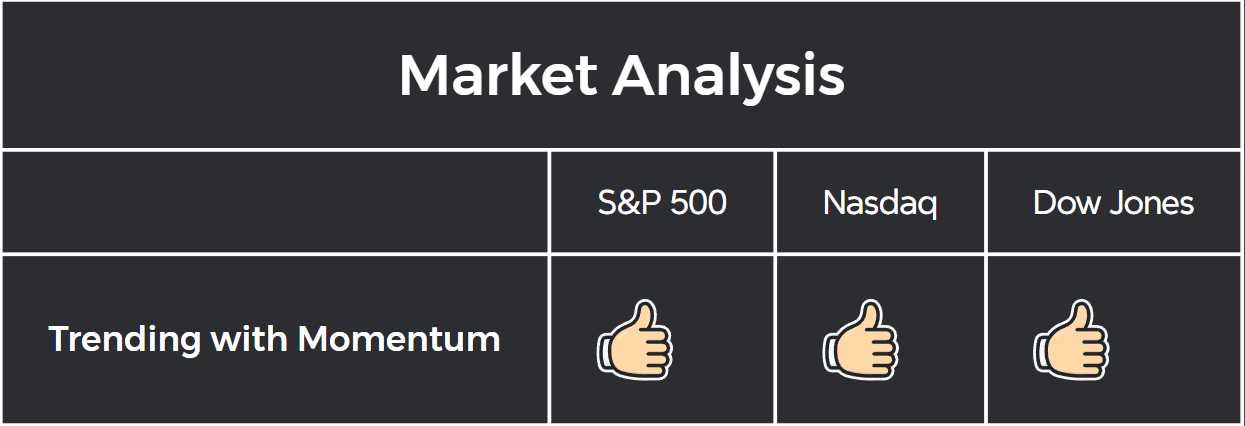
All three indices confirmed the continuation of a bull market
Major indices retreated from their recent post-election peaks as you, the investors, locked in gains and repositioned portfolios amid overbought technical conditions and mounting concerns over potential changes to tariff policies.
Growing uncertainty surrounding future trade policies, particularly regarding potential tariff adjustments, cast another shadow over market sentiment.
Key Market Developments
- All three main indices remain above their 10-week/50-day moving averages, signaling sustained momentum.
- Last week, we experienced notable profit-taking, particularly in the technology sector.
- The majority of stocks are either extended to the upside and pulling back or waiting to bounce from support. — While the market presents buying opportunities, you should wait for more definitive entry signals.
- Bitcoin broke out from a cup and handle pattern, reaching an all-time high of $93,386.56. — The chart indicates an overextended position.
- Trade Idea: None for the week
- Watchlist: TSLA and Bitcoin
Looking Ahead
- Nvidia’s upcoming earnings report on Wednesday will likely set the tone for AI-related stocks
- Key economic indicators include PMI data
- Market participants will closely monitor additional Fed commentary on interest rate trajectory
This pause in the market’s advance emerged as investors processed Powell’s assertion that there was “no rush” to reduce interest rates, even as inflation data displayed mixed signals.
The retreat from recent highs suggests a market recalibrating expectations rather than a fundamental shift in the prevailing bull market narrative.
Market Background: Federal Reserve Policy Impact: Key Events Shape Market Direction
1. Inflation Data Met Expectations Despite Persistent Areas
October’s inflation readings aligned with Wall Street’s forecasts, though certain sectors maintained elevated price levels.
The Consumer Price Index rose to 2.6% year-over-year from September’s 2.4%, matching consensus expectations.
Core inflation held steady at 3.3%, also in line with market projections, while reflecting the ongoing journey toward the Fed’s 2% target.
The report revealed mixed trends: energy, gasoline, and new vehicle prices moderated, while services inflation, particularly in housing costs and insurance prices, remained stubbornly high.
2. Economic Resilience Narrative Gained Strength
The U.S. economy’s exceptional performance relative to other major economies supported the Fed’s patient stance.
Employment data remained robust with the unemployment rate at 4.1%, well below historical averages.
This economic strength, while positive for corporate earnings, complicated the path to monetary policy easing.
The Fed’s current benchmark rate of 4.75% positioned monetary policy firmly in restrictive territory despite easing inflation pressures.
3. Powell’s Comments Reshaped Rate Cut Expectations
Fed Chair Powell’s speech at the Federal Reserve Bank of Dallas delivered a decisive blow to near-term rate cut hopes.
His emphasis on the economy’s resilience and “no rush” stance on rate reductions prompted a significant shift in market expectations.
The probability of a December rate cut dropped below 60%, according to CME’s FedWatch Tool.
Boston Fed President Susan Collins reinforced Powell’s position, explicitly stating that a December rate cut was “not a done deal.”
4. Tariff Policy Uncertainty Emerged as New Market Risk
Market participants began pricing in potential impacts of proposed tariff policy changes.
Historical precedent from the 2018 washing machine tariffs suggested possible supply chain adaptations and price normalization over time.
Analysts noted that while tariffs typically create one-time price increases, their long-term inflationary impact often proves less severe than initially feared.
Market Analysis
Recent S&P 500 Performance
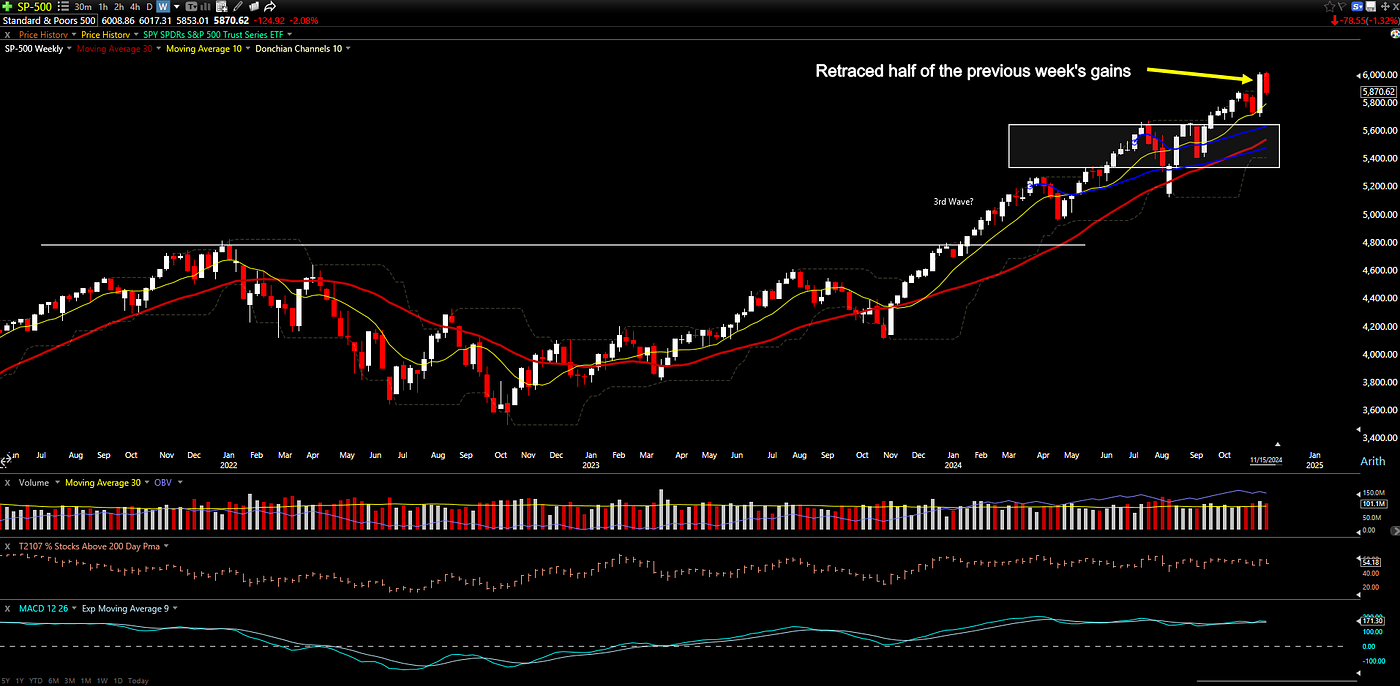
SPX retraced half of the gain from the previous week.
Performance Matrix:
- Weekly Performance: -2.1%
- Year-to-Date Return: +23.08%
Technical Indicators:
- The market price has retreated to the breakout zone, positioning itself just above the 10-week moving average
- The recent decline marks the third weekly loss in four weeks
- The primary uptrend remains intact
Volume:
- Trading volume intensified during the decline, suggesting significant institutional participation in the profit-taking phase
Market Breadth:
- Percentage of companies above 200 SMA: 54.18%
- Despite recent market volatility during the pullback, you’ll note that the majority of companies maintain positions above their long-term moving averages. This technical configuration confirms the persistence of the bull market.
Comparison with Other Major Indices
Nasdaq
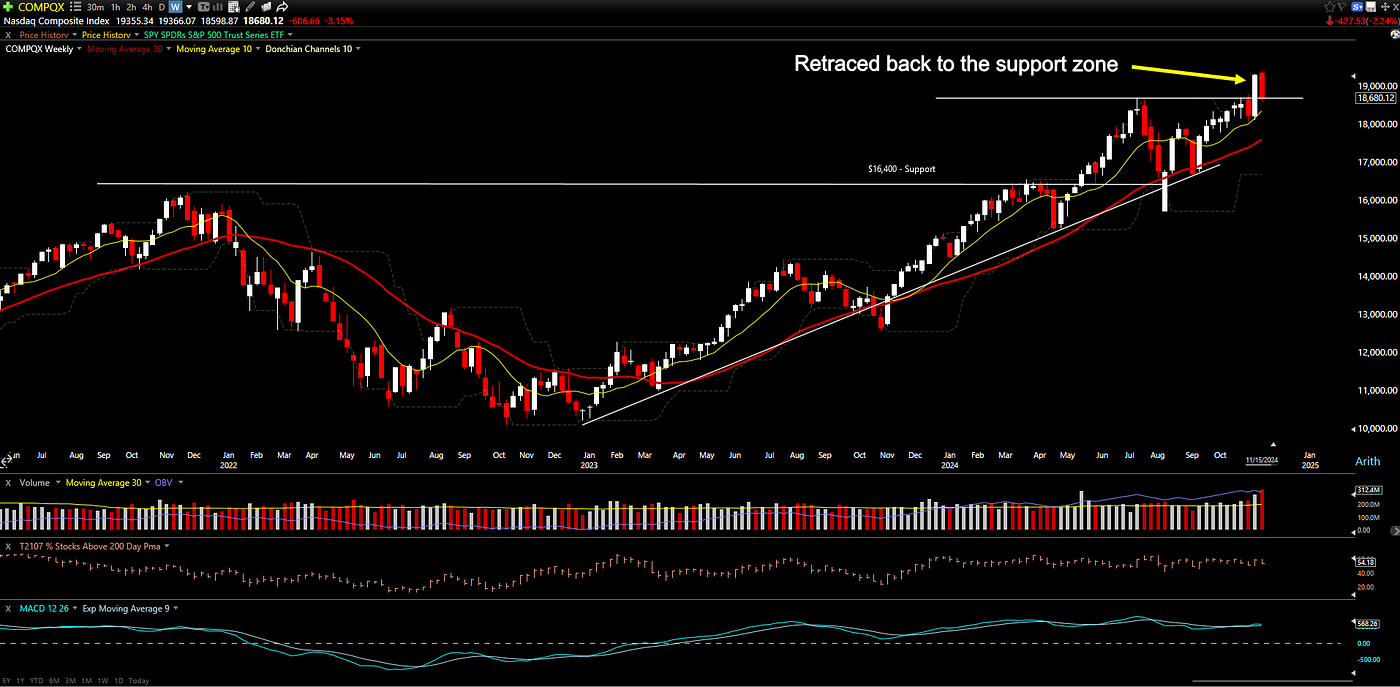
Nasdaq has established position at its critical support level
Performance Matrix:
- Weekly Performance: -3.15%
- Year-to-Date Return: +24.4%
Technical Indicators:
- The stock has pulled back precisely to its support area
- Despite the weekly setback, the Nasdaq maintains its market leadership position with an impressive 24.4% advance in 2024
Dow Jones Industrial Average
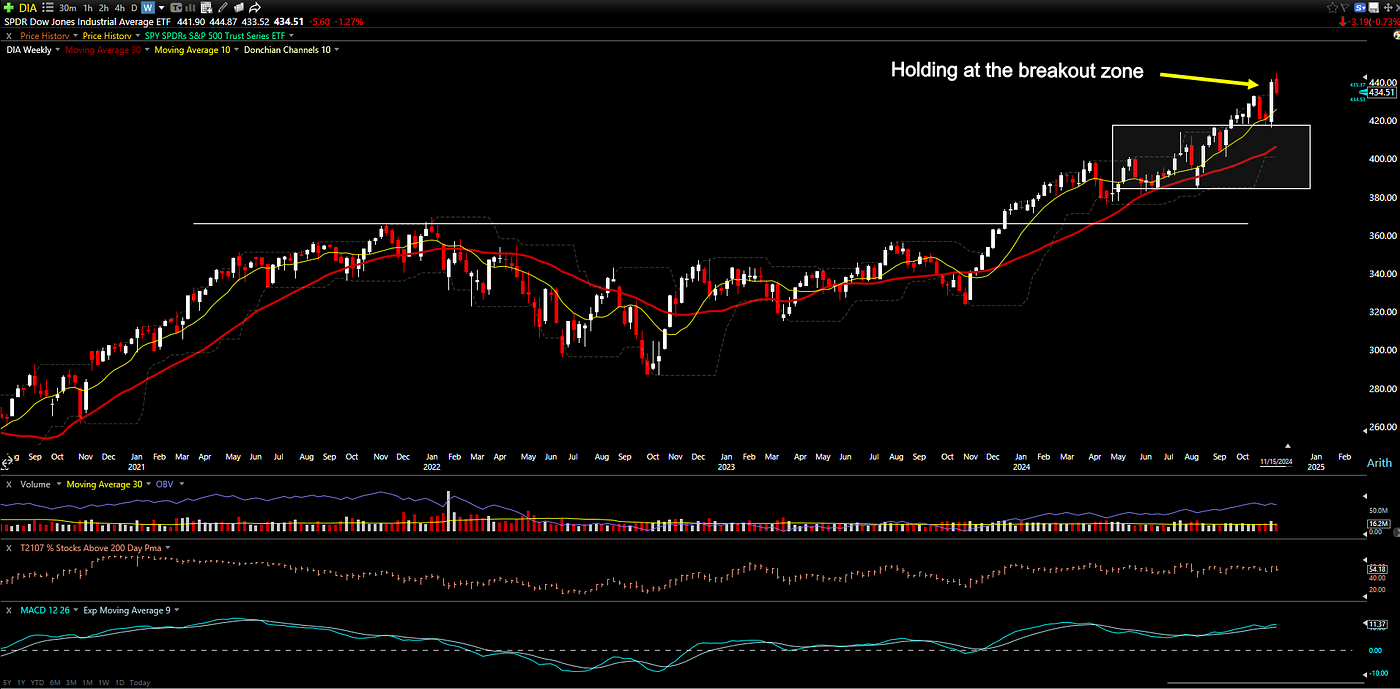
The Dow Jones Industrial Average emerges as this week’s most resilient index
Performance Matrix:
- Weekly Performance: -1.24%
- Year-to-Date Return: +15.27%
Technical Indicators:
- Among the three main indices, the Dow Jones Industrial Average has demonstrated superior stability, containing its weekly decline with remarkable efficiency
- The index maintains its position above both short-term and long-term momentum indicators
Russel 2000
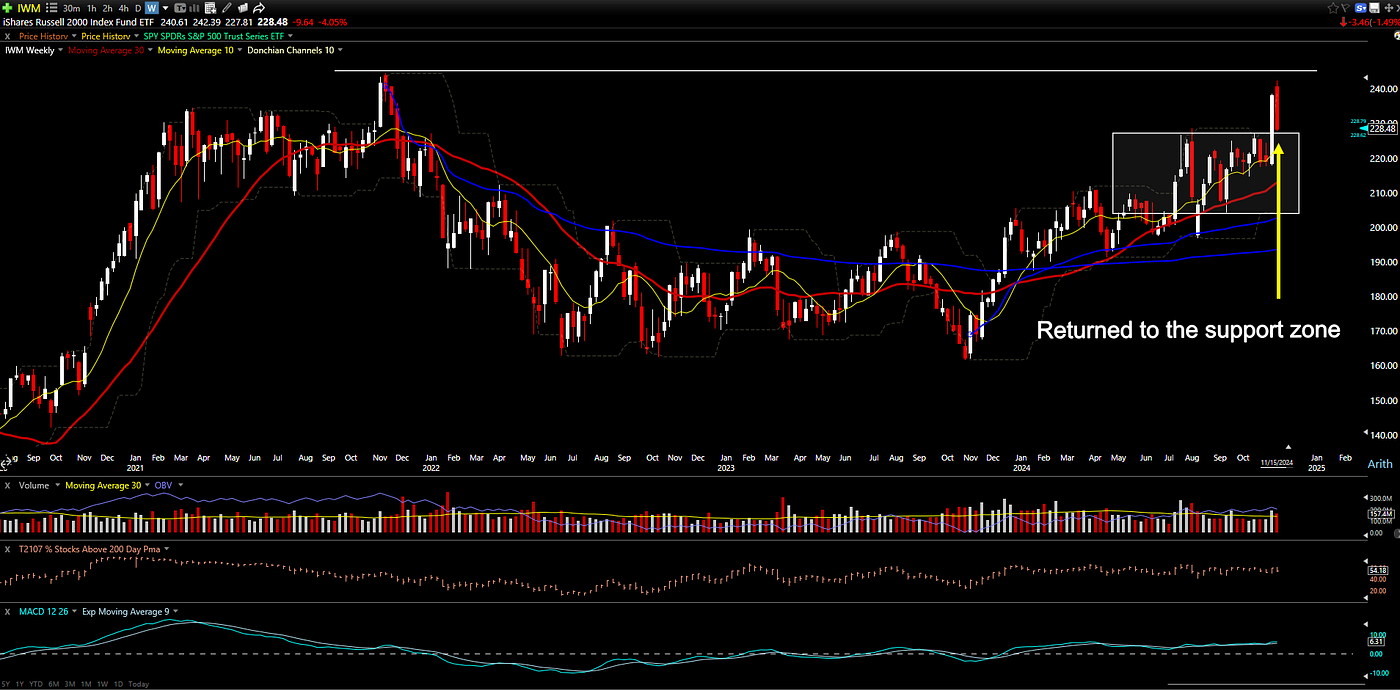
The Russell 2000 has executed a precise retreat to its previous breakout zone
Performance Matrix:
- Weekly Performance: -3.99%
- Year-to-Date Return: +13.65%
Technical Indicators:
- Mirroring the Nasdaq’s movement, small-cap stocks have descended to rest exactly at their support threshold
Market Sector Rotation: Weekly and YTD Return
A Quick Takeaway:
The week’s trading patterns suggested a tactical rotation from growth to value sectors.
Institutional investors appeared to be reducing exposure to sectors sensitive to interest rates.
Defensive sector leadership, typically seen during market uncertainty, aligned with the broader pullback in risk assets.
This rotation reflected growing acceptance of the Federal Reserve’s higher-for-longer rate stance, rather than deteriorating fundamentals.
Trading volumes indicated systematic repositioning rather than panic selling, suggesting a measured response to evolving market conditions.
Outperforming Sectors
- Financial Services (XLF): +1.41% | YTD: +32.63%
- Communication Services (XLC): -1.06% | YTD: +30.95%
- Utilities (XLU): +0.13% | YTD: +25.14%
- Industrial (XLI): -2.11% | YTD: +22.04%
- Consumer Discretionary (XLY): -0.78% | YTD: +19.37%
- Technology (XLK): -3.52% | YTD: +18.82%
Underperforming Sectors
- Energy (XLE): +1.02% | YTD: +12.99%
- Consumer Staple (XLP): -1.04% | YTD: +11.01%
- Real Estate (XLRE): -2.10% | YTD: +7.29%
- Basic Material (XLB): -3.34% | YTD: +6.71%
- Healthcare (XLV): -5.55% | YTD: +4.00%
Economic Events Outlook:
1. Nvidia Earnings Report (Wednesday, November 20)
Tech sector bellwether’s results come at a crucial juncture for AI narrative: Revenue Expectations:
- Consensus forecast: $24.0 billion (±2%)
- Previous quarter: $22.1 billion
- Key focus: Data center segment growth
Key Areas to Watch:
- AI chip demand trends
- Supply chain updates
- Forward guidance
- Gross margin outlook
2. Manufacturing PMI Flash Data (Wednesday, November 20)
November’s preliminary reading offers early signals on manufacturing health: Manufacturing PMI Forecast:
- Consensus estimate: 49.0
- Previous reading: 48.5 in October 2024
- Key threshold: 50.0 marks expansion/contraction boundary
Critical Subcomponents:
- New orders
- Employment readings
- Price pressures
- Supply chain efficiency
3. Weekly Jobless Claims (Thursday, November 21)
Labor market resilience remains central to Fed policy: Initial Claims Expectations:
- Consensus forecast: 224,000
- Previous week: 221,000
- Four-week average trend: 227,250
Watchlist
Though the market maintains its upward trajectory, current conditions suggest a measured approach. We’ll look for a clear bounce from support levels before considering new positions — this will signal better buying opportunities.
While we’re holding back on specific trade recommendations this week, several promising stocks have caught our attention. You may wish to add these candidates to your watchlist for future consideration.
Tesla (TSLA)
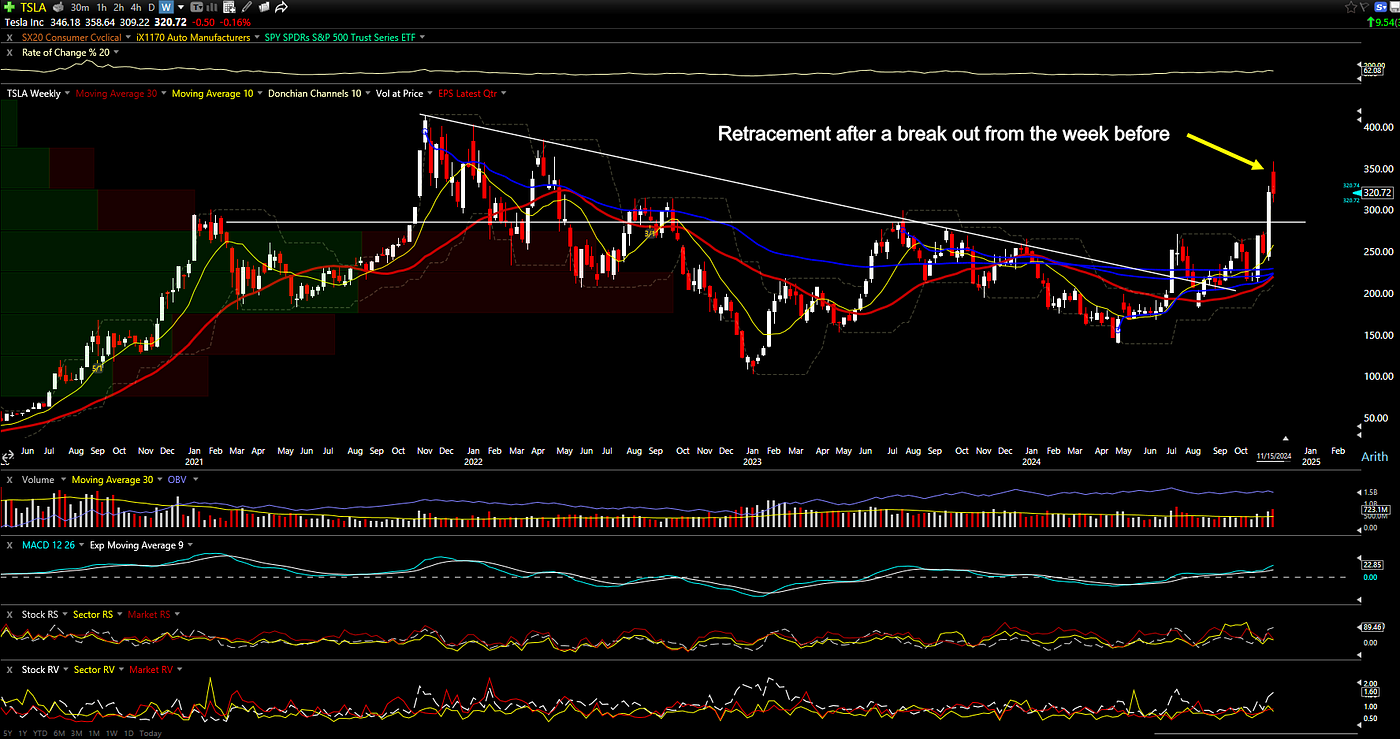
TSLA — pending for a retracement
Who Are They?
- Tesla is an American multinational company focused on sustainable energy and transportation solutions.
Technical Analysis:
- Tesla executed a decisive breakout above the critical resistance threshold of ~$285.00 two weeks ago
- The stock has liberated itself from the downward trend that had dominated since 2022
- Present positioning shows the stock maintaining elevation above all Anchored VWAP levels and both short-term and long-term moving averages
- Last week witnessed a measured retreat from overextended conditions
Strategic Approach:
- You should observe whether the newly established support at $285 demonstrates conviction in holding price action
- A successful test of this level, followed by the formation of a higher low, would constitute an optimal entry configuration
Bitcoin
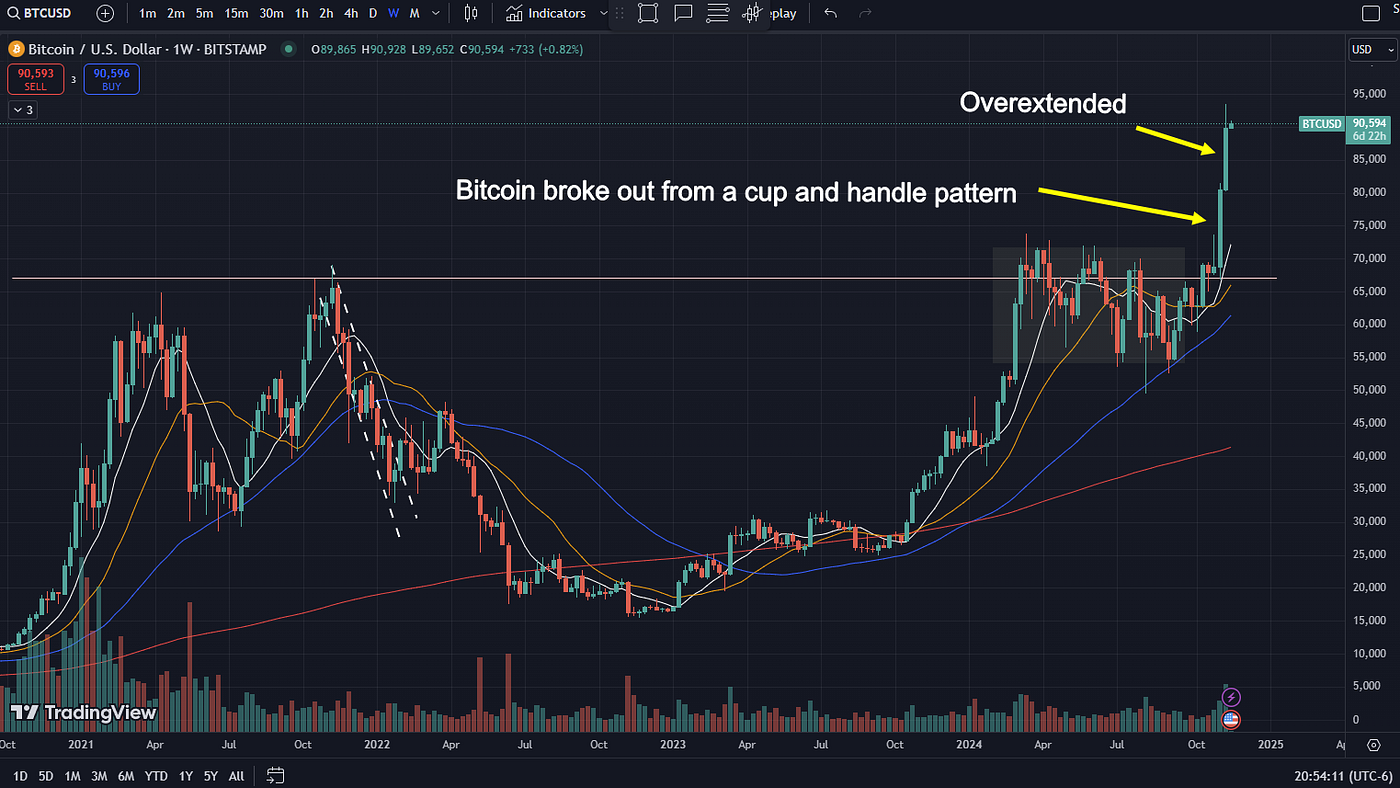
Bitcoin exhibits classic parabolic price behavior
Technical Analysis:
- The price broke free from its nine-month holding pattern on November 4, 2024
- Since then, prices have shot up dramatically
- Like Tesla, we’re looking for a chance to buy at a better price if Bitcoin pulls back to $80,000 — $85,000
- But with everyone so excited about Bitcoin right now, we might not get that chance to buy lower. In terms of managing risk, waiting patiently is your best move
- If you feel you must buy now, I understand. But you should know exactly where prices stand at this moment
Strategic Outlook and Conclusion
Last week’s market action centered on two critical developments: Powell’s hawkish stance on maintaining higher rates and persistent inflation data. The S&P 500’s retreat to 5,871 and increased market caution reflected shifting rate expectations
Key levels to monitor include S&P 500 support at its 50-day moving average and Nasdaq’s defense of the 18,000 threshold.
Growth sectors and duration-sensitive groups require close monitoring as markets adjust to the reality of delayed rate cuts.
Thank you for reading till the end. Best wishes for everything that you do. Have an enjoyable week, ladies and gents.
If you like what present here, do consider my substack: datnguyenwrite.substack.com
Disclaimer
The information provided here is for educational and entertainment purposes only and should not be construed as financial advice. I am not a licensed financial advisor, and the content presented does not constitute professional financial guidance. Any financial decisions you make should be based on your own research, judgment, and consultation with qualified professionals. The material shared here may not be suitable for all individuals or situations. Always consider your personal circumstances and seek personalized advice from a certified financial expert before making any investment or financial choices.
메타데이터
- post_id
- ab23e8131068
- slug
- stock-market-pulls-back-as-powell-dampens-rate-cut-hopes-weekly-analysis-ab23e8131068
- url
- https://medium.com/@datng8/stock-market-pulls-back-as-powell-dampens-rate-cut-hopes-weekly-analysis-ab23e8131068
- canonical_url
- https://medium.com/@datng8/stock-market-pulls-back-as-powell-dampens-rate-cut-hopes-weekly-analysis-ab23e8131068
- author_url
- https://medium.com/@datng8
- status
- ok
- fetched_at
- 2026-07-22 03:04:42