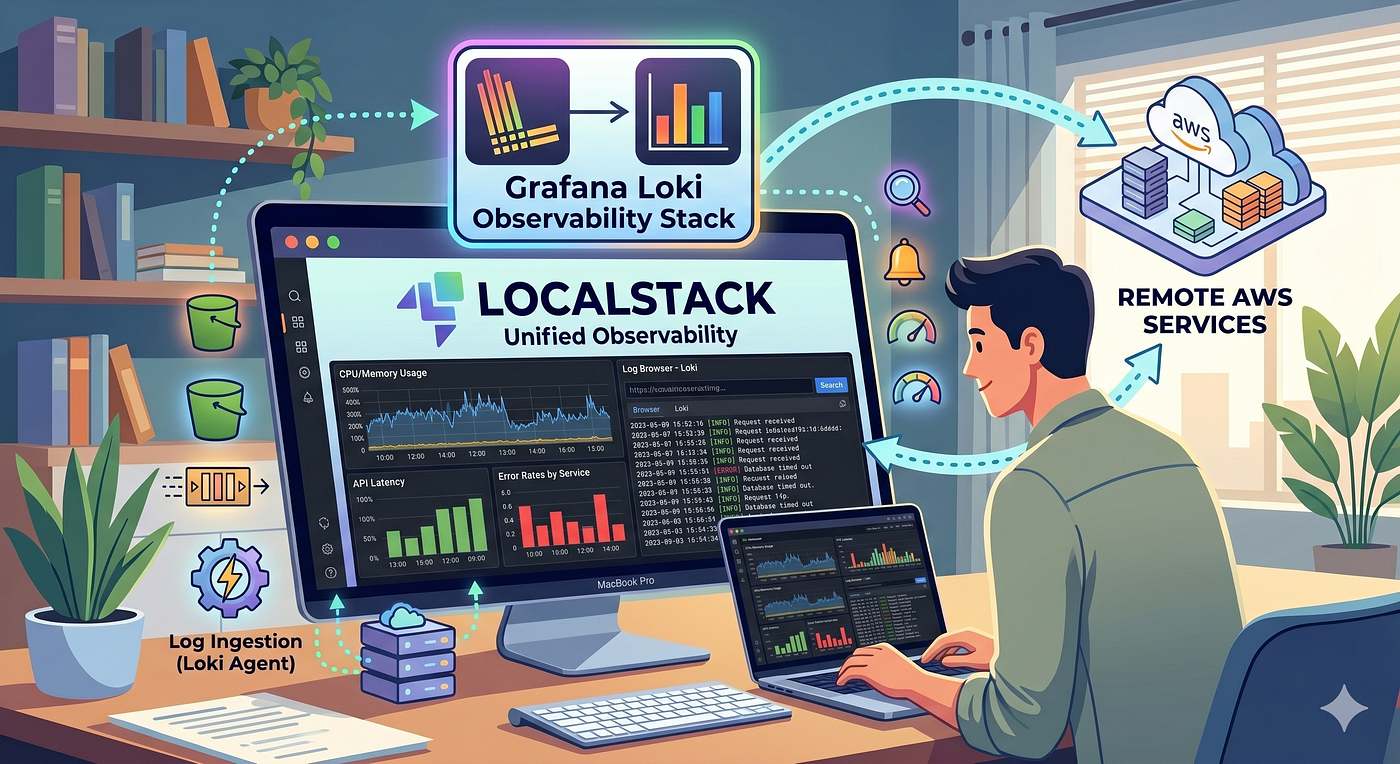
[ Tech Exploration #4 ] — The Observability Rabbit Hole I Didn’t Expect
Just another weekend. Same routine of sleeping late and waking up early just to debug some issue in your project. Typical start of the day.
[ Tech Exploration #4 ] — The Observability Rabbit Hole I Didn’t Expect
Just another weekend. Same routine of sleeping late and waking up early just to debug some issue in your project. Typical start of the day.
As I mentioned before, EventNexus was never meant to be a simple “finish it and move on” kind of project. It’s more of an exploration project. A place where I can experiment, break things, understand systems, and honestly just see how far I can stretch its branches.
Fine morning, no breakfast, just opened the project to quickly check if everything was stable. If no problems showed up, then maybe I could finally move on to something new.
All containers were up and running. Observability stack working. Nginx working. Everything looked happy and stable.
And since I hadn’t touched the project for almost 5–6 days, there shouldn’t have been any behavioral changes.
(How naive I was about this tech world.)
So I started testing everything one by one. Backend working. Worker working (nothing complex there yet, but still working).
Such a great feeling. About to get ruined.
Then I opened Grafana just to verify whether the logging system was still functioning properly.
And boom.
I started seeing logs from some completely different world itself. (Okay, slight exaggeration.)
But basically, Grafana was showing logs from almost every container altogether. Backend logs, infrastructure logs, random service logs — everything mixed into one noisy stream.
The funny part was, I had actually seen this issue once before. But somehow it disappeared on its own after some time, so I ignored it and moved on.
This time, the same issue came back again.
And this time I didn’t want to leave it to luck.
So I started digging deeper into the problem.
And that small debugging session unexpectedly opened an entirely new door for me into the world of Observability.
—
What Went Wrong
The issue, as I mentioned earlier, was that Grafana was showing logs from almost all containers mixed together.
The reason behind this was my Promtail configuration.
For context, Promtail is the tool responsible for scraping Docker logs and pushing them into Loki.
In the config file, I was using static_configs, or in simpler words, a very hardcoded way of scraping logs.
Because of that, Loki was basically creating one generic stream/label for everything, which caused logs from multiple containers to get flooded into the same place.
At first, the obvious solution seemed simple: “Separate logs container by container”
Makes sense, right?
But that approach had its own catch
Containers are temporary by nature. Their IDs change, instances restart, names evolve, and suddenly the “simple” solution doesn’t feel very scalable anymore.
And this is where I came across a term that completely changed how I started looking at observability systems — “Service Discovery”
—

My Initial Thought…
My first instinct was honestly very straightforward.
“Why not just separate logs container-wise?”
Each container has its own logs anyway, so creating labels based on container IDs initially sounded like the perfect solution.
And for a few minutes, I genuinely thought the problem was already solved.
But then I started thinking a little deeper about how containers actually behave in real systems.
Containers are not permanent.
They restart. They crash. They get recreated. Sometimes multiple instances of the same service run together.
And suddenly I realized something important:
“I realized I was organizing logs around containers, not around actual services.”
That small realization completely changed the direction of this phase for me.
—
Should we segreggate by Container or by Sevice
Like many of you probably would, my first thought was to separate logs using container IDs.
At first, it sounded perfectly logical.
Every container has its own identity, so why not use that identity directly as labels in Loki?
But the more I explored this approach, the more problems started appearing.
In a scaling setup, this could create observability issues very quickly.
Because Promtail would push logs separately for every individual container instance. And if multiple instances of the same service are running, Loki would end up creating separate log streams for each one of them.
Which means logs related to the same service could end up scattered across multiple places.
And then came another important realization:
Containers are ephemeral.
(Heavy word, simple meaning: short-lived.)
Containers can crash, restart, get recreated, or completely disappear. And when a fresh container spins up, it essentially becomes a completely new instance with a new identity.
So now the problem becomes even bigger.
Not only do we need to track which container failed, but we also need to aggregate logs across old and new instances together.
And that’s when service-based labels started making much more sense to me.
Because in the end, humans debug services — not random container IDs. (Cool line by the way. Not me. AI suggested. Being honest here.)
—
Why Dynamic Service Discovery Was Needed
As I mentioned earlier, there are ways to manually configure which containers Promtail should track.
And initially, that also sounded fine.
Something like: “Track these specific containers only”
But again, this approach breaks down once containers start behaving like actual containers.
Since containers are ephemeral, new instances can get created anytime. Old ones can disappear. Services can restart. Scaling can happen.
And if Promtail only knows about manually configured containers, then any newly created container would simply go unnoticed.
Simple Flow: No discovery → No logs
And observability systems silently missing logs is probably one of the worst things you can have.
That’s why I eventually moved towards Dynamic Service Discovery.
Instead of manually telling Promtail what exists, Promtail could now dynamically discover containers/services directly from Docker metadata itself.
—
How I Actually Did It… but?
Implementation-wise, it honestly wasn’t that complex.
But mentally?
The first thing I did was manually add labels to services based on how I actually wanted to see them inside Grafana.
{service="backend"}
{service="processor"}
{service="nginx"}
{service="grafana"}
Now every service had its own logical identity.
But the real question still remained:
“Why were all logs getting mixed together in the first place?”
I already knew what was happening.
I even roughly knew why it was happening.
But the actual answer was hidden inside the Promtail configuration itself.
At first, I thought the issue was only because of static_configs.
But later I realized the bigger issue was actually the Docker log path being used.
I was using a hardcoded filesystem path which was basically scraping logs from all containers together.
Which explains why everything eventually ended up flooding into the same place.
So now the goal became much clearer:
“Map container logs → to meaningful service identities”
And this is where Docker Socket (docker.sock) entered the picture.
The Docker socket is basically a Docker API endpoint which provides metadata about containers like:
- container ID
- container name
- labels
- networks
- and other runtime information
(We can probably do an entire separate exploration on this later.)
And this single concept helped me understand two very important things:
- How Docker logs are actually collected and stored internally → then scraped by Promtail → and finally labeled/indexed inside Loki.
- How Dynamic Service Discovery actually works behind the scenes.
—
Final Thoughts
Funny enough, in this whole observability mess, most of the actual implementation changes happened in just two files:
docker-compose.ymlpromtail.yml
That’s it.
“Small things, big impact I would say.”
(And yes, this line is mine. Not AI this time.)
But somehow those two files opened doors to so many concepts that I never planned to explore this deeply.
Things like:
- service identity
- ephemeral containers
- metadata
- dynamic service discovery
- Docker socket
- Loki labels
- observability scaling
And honestly, this phase made me realize something important:
“Observability is not just about collecting logs. It's about organizing system understanding.”
Before this, logs were just logs for me.
Now I slowly started seeing them as:
“Signals flowing through distributed systems”
And I think that small mental shift made this phase much more valuable than I originally expected.
—
Would keep on exploring…
Peace.
메타데이터
- post_id
- ab2cfdaf5df1
- slug
- tech-exploration-3-overcoming-the-eventnexus-messy-observability-trap-ab2cfdaf5df1
- url
- https://medium.com/@akash.bharnuke/tech-exploration-3-overcoming-the-eventnexus-messy-observability-trap-ab2cfdaf5df1
- canonical_url
- https://medium.com/@akash.bharnuke/tech-exploration-3-overcoming-the-eventnexus-messy-observability-trap-ab2cfdaf5df1
- author_url
- https://medium.com/@akash.bharnuke
- status
- ok
- fetched_at
- 2026-06-27 07:40:21