Turning Connection Patterns into Usable Fraud Signals
Connected data only matters if it changes a decision.
Turning Connection Patterns into Usable Fraud Signals
Connected data only matters if it changes a decision.
Graph analysis can reveal how entities relate, how activity clusters, and how risk moves through a network. It can show patterns that do not exist in flat data.
But detection systems do not operate directly on complex characteristics such as a relationship pattern. They need a characteristic in the form of a measurement: a “feature”..
That creates a gap between what the system can observe and what it can actually use. The challenge is not identifying connections. It is translating those connections into signals that can be evaluated consistently in real time.
Key Takeaways
• Connected data must be transformed into measurable features to influence detection • Relational patterns need consistent definitions across systems to avoid conflicting decisions • Feature duplication across pipelines creates drift and inconsistent risk evaluation • Relational signals provide context that individual attributes cannot capture • Practical signal design must balance accuracy, latency, and interpretability
Connections Must Become Measurable
Relationships provide context, but context alone is not consumable.
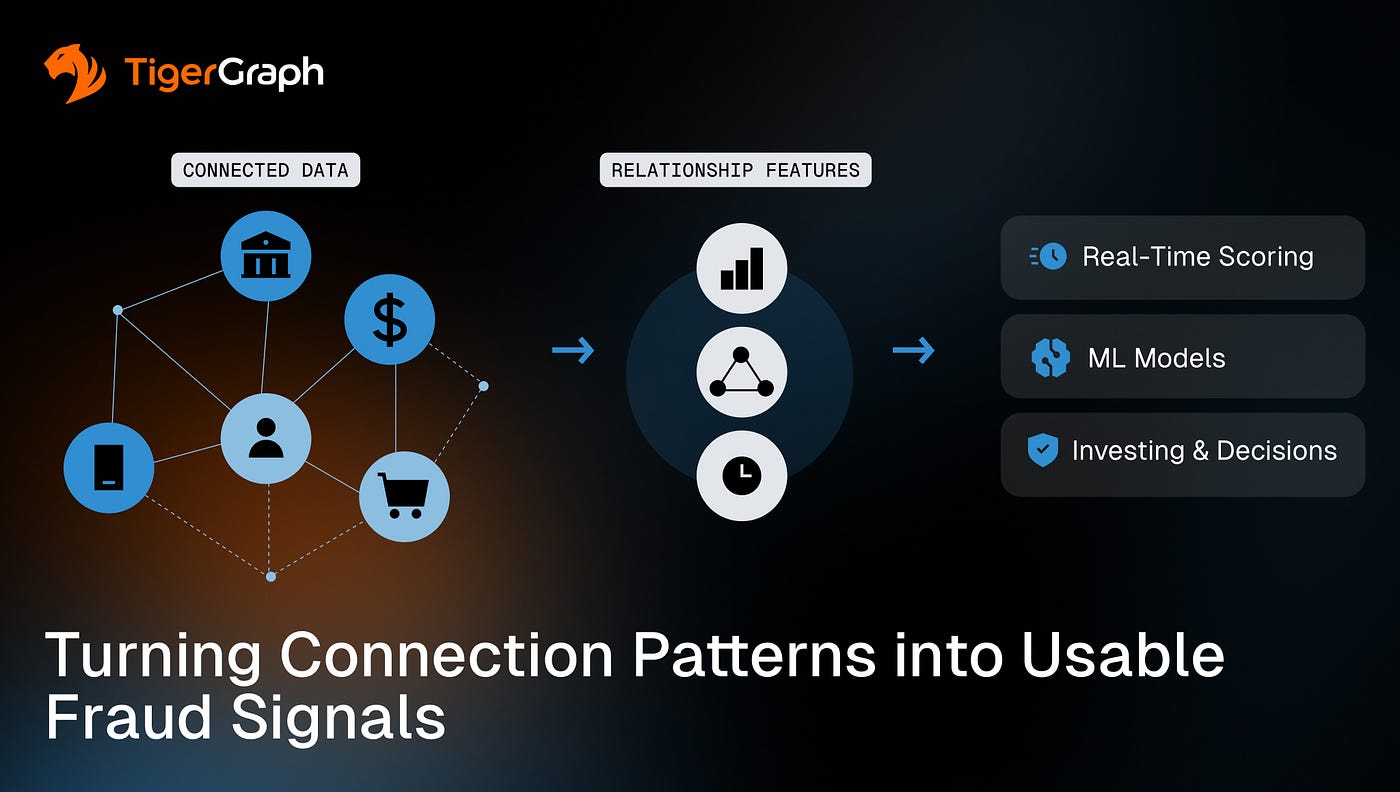
Detection systems require inputs that can be quantified, compared, and reproduced. A model cannot act on the idea that an account is “connected to risk.” It needs to understand how much risk, how close that risk is, and how it compares to other entities.
This requires transforming connection patterns into structured features.
Instead of identifying that an account is linked to suspicious activity, the system expresses that relationship in measurable terms:
• The number of high-risk entities within a defined distance • The proximity to known fraudulent accounts • The density of connections within a local network • The rate at which new connections are forming
These features translate structure into something actionable. Some features, such as shortest path between two paths, can come directly from or be inspired by standard graph algorithms. Other features are more specific to the nature of the application domain.
Without that transformation, graph analysis remains descriptive. It explains what exists, but it does not influence what happens next.
Signal Definition Must Be Consistent
Once relational features are defined, they must be calculated the same way everywhere. This sounds obvious, but it rarely happens because different systems often compute similar signals in slightly different ways.
One model may calculate proximity using one set of rules, while another uses a different threshold or dataset. A real-time system may use a simplified version of a feature that is more fully defined in batch processing. Those differences accumulate.
A transaction can receive one score in real time and a different interpretation during investigation. Two systems can evaluate the same entity and reach different conclusions, even though they are using “the same” signal.

This creates misalignment across real-time decisioning, investigation workflows, and downstream models.
Consistency requires centralized definitions and shared logic for how features are generated. Using standard graph algorithms are one step towards consistency. Without consistency, the system stops behaving as a single system. It becomes a collection of loosely related interpretations rife with feature duplication.
Feature Duplication Creates Drift
In some environments, feature generation is not centralized, it is replicated.
Different teams implement similar logic across real-time scoring systems, batch pipelines, and investigative tools. At first, those implementations match. Over time, they drift and small differences emerge.
A threshold changes in one system but not another. A time window is updated in one pipeline but not reflected elsewhere. A query is optimized in one place and simplified in another.
Each change seems minor, but together they create fragmentation.
Relational signals are particularly sensitive to this. Small differences in how connections are evaluated can produce materially different outcomes.
What should be a shared understanding of risk becomes multiple versions of it. At that point, the system is no longer interpreting risk. It is guessing without context.
Relational Signals Add Context, But Only If They Can Be Used
Traditional fraud features focus on individual attributes like transaction amount, device type and account history. These are useful, but they only describe what a single entity is doing. They do not explain how that entity is connected to others.
That gap matters.
Fraud rarely presents as a single suspicious action. It emerges through relationships. An account may appear normal on its own, but its connections can tell a very different story. It may be closely linked to known risk, part of a tightly connected cluster, or rapidly forming new relationships that indicate coordinated activity.
Relational signals capture that context and help answer questions that flat features cannot:
• Is this account part of a broader network? • How close is it to known fraudulent activity? • Is this behavior isolated, or part of a coordinated pattern? • Are connections forming slowly, or accelerating in a short window?
This changes how behavior is interpreted.
An action that looks normal in isolation can look suspicious when viewed within a network. Without relational signals, that distinction disappears. The system sees events, it does not see structure.
But not all signals are created equally.
Not All Signals Are Useful in Practice
Once relationships are translated into signals, the next challenge is deciding which ones can actually be used. This is where many systems quietly break.
It is easy to create signals that capture complex patterns. It is much harder to make them usable in a real system where decisions must happen quickly, consistently, and in a way that can be explained.
Effective signals must meet practical constraints. They must be:
• Relevant to decisioning • Fast enough to compute within real-time latency limits • Stable enough to produce consistent results • Clear enough to support investigation and audit
Signals that are too complex introduce new problems. They may slow down decisioning, behave inconsistently as data changes or just be difficult to explain when a decision is challenged. So, the goal is not to capture every possible pattern. It is to capture the patterns that materially improve detection, without breaking the system that depends on them.
Signals Only Matter If They Are Used Consistently
Even well-designed signals can fail if they are not applied consistently across the system. In most environments, different components rely on the same data:
• Real-time scoring systems • Machine learning models • Rule-based decision engines • Investigation tools
If those components do not use the same definitions of relational signals, problems appear quickly.
A model may evaluate risk using one version of a signal, while an investigator sees another. A rule may rely on a simplified version of a feature that no longer matches how the model behaves. Two systems may interpret the same activity differently because they are not using the same underlying logic.
This creates a disconnect between detection and response. The system produces decisions that cannot be consistently explained or reproduced.
Integration is what closes that gap.
Relational signals must be defined once, calculated consistently, and made available across every system that depends on them. Otherwise, the system stops behaving as a single system. If the system cannot support this calculation, it becomes the bottleneck.
Why This Becomes the Bottleneck
At this point in the architecture, the limitation shifts. The system may be able to model relationships, understand how those relationships change over time, and even be able to evaluate them across multiple steps in real time. But if those relationships are not translated into usable, consistent signals, detection still breaks down.
Fraud is increasingly coordinated. Detection depends on understanding how fraudulent activity connects across accounts, devices, and transactions. Without relational signals:
• Coordinated activity appears fragmented • Risk is underestimated or misclassified • Systems rely too heavily on isolated attributes
When that happens, the issue is the input, not the model. The system is making decisions based on a simplified view of reality, even though a richer view exists. And that is where detection capability plateaus, no matter how much you invest in models or rules.
Where This Leads
At this stage, we’ve explored a system that can:
• Model relationships directly • Evaluate how those relationships change over time • Follow them across multiple steps • Keep that view current as activity evolves
Now those relationships must be translated into signals that remain consistent across every system that depends on them. The next challenge is alignment.
Fraud detection does not rely on a single type of signal. It combines behavioral patterns and relational context. If those signals are not coordinated, they can produce conflicting interpretations of the same activity.
If your current system can identify connections but struggles to translate them into consistent, usable signals across models and decisioning systems, it is worth connecting with TigerGraph to understand how graph-native architectures unify feature generation and maintain consistency at scale.
What Comes Next
The next article examines how to align time-based and network-based risk signals so that behavioral analysis and relational context operate together within a consistent decisioning framework.
메타데이터
- post_id
- ab6cd9395346
- slug
- turning-connection-patterns-into-usable-fraud-signals-ab6cd9395346
- url
- https://medium.com/tigergraph/turning-connection-patterns-into-usable-fraud-signals-ab6cd9395346
- canonical_url
- https://medium.com/tigergraph/turning-connection-patterns-into-usable-fraud-signals-ab6cd9395346
- author_url
- https://medium.com/@tigergraph
- status
- ok
- fetched_at
- 2026-06-26 06:47:43