Deep Dive into .NET Garbage Collection with dotnet-gcdump
Modern .NET applications rely on the Garbage Collector (GC) to manage memory automatically, reclaiming unused objects and preventing leaks…
Deep Dive into .NET Garbage Collection with dotnet-gcdump
Modern .NET applications rely on the Garbage Collector (GC) to manage memory automatically, reclaiming unused objects and preventing leaks. However, when your application’s memory usage grows unexpectedly or performance degrades over time, you need visibility into what’s happening inside the GC heap. That’s where **dotnet-gcdump** comes in.
This guide walks through the exact process of capturing and analyzing memory snapshots using dotnet-gcdump—from installation to practical interpretation.
1. Why Analyze Garbage Collection?
Garbage collection is central to .NET runtime performance. It:
- Frees unused managed memory.
- Reduces fragmentation in the heap.
- Runs automatically, but can cause performance pauses.
- Becomes a bottleneck when the app retains references longer than necessary.
To investigate:
- High memory growth over time.
- Long GC pause durations.
- Memory leaks or inefficient object retention.
2. Installing dotnet-gcdump
The dotnet-gcdump tool is part of the .NET diagnostics suite. Install it globally:
dotnet tool install --global dotnet-gcdumpAfter installation, you can verify availability:
dotnet-gcdump --helpYour terminal should confirm:
Tool 'dotnet-gcdump' (version '9.x.x') was successfully installed.
You can invoke the tool using the following command: dotnet-gcdump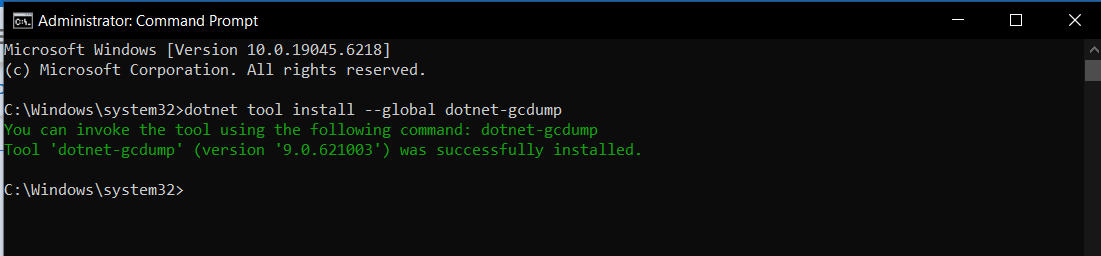
Successful installation message
3. Listing Running .NET Processes
Before collecting a dump, identify which managed processes are running:
dotnet-gcdump psOutput shows each process’s ID (PID), name, and path:
12060  Microsoft.CmdPal.UI.exe
 4812  LavenderEvent.exe
17056  Lavender.AlertService.exe
 5016  LavenderAgent.exe
23980  Lavender.exe
In this example, the process we’ll analyze is Lavender.exe with PID 23980.
4. Capturing a GC Dump
Use the collect command to take a memory snapshot:
dotnet-gcdump collect -p <PID> -o <output_name>Example:
dotnet-gcdump collect -p 23980 -o beforeThis writes a file like:
Writing gcdump to 'C:\Windows\system32\before.gcdump'...
Finished writing 19182064 bytes.
This file contains a snapshot of the .NET heap, including live object graphs, allocation stats, and root references.
Later, after performing some application actions, you can capture another snapshot:
dotnet-gcdump collect -p 23980 -o after(See final screenshot — two dumps captured as before.gcdump and after.gcdump.)
5. Comparing Dumps and Diagnosing Leaks
To analyze and compare, use Visual Studio, dotnet-dump, or PerfView.
Option 1: Visual Studio
- Open Visual Studio → Debug → Performance Profiler.
- Select Managed Memory.
- Use “Compare Snapshots” to open both
before.gcdumpandafter.gcdump.
Identify:
- Types with increased instance count.
- Large retained object graphs.
- Growing collections (e.g.,
List<T>,Dictionary<K,V>).
Option 2: PerfView
PerfView is a low-level diagnostic tool. Load the dump:
PerfView /GCHeapDump before.gcdumpInspect “By Type” view to see which objects occupy most heap memory.
6. Understanding the GC Phases (Context for Your Dumps)
The .NET GC operates in generations:
- Gen 0: short-lived objects (frequently collected).
- Gen 1: intermediate-lifetime objects.
- Gen 2: long-lived objects.
- LOH (Large Object Heap): objects > 85 KB.
If your dumps show excessive Gen 2 or LOH growth, your code likely holds long-lived references — potential memory leaks or static caches not being released.
7. When to Take Multiple Dumps
Taking two dumps — one before and one after — allows differential analysis:
- Stable heap size: GC effectively cleans up.
- Increasing heap size: indicates retention or leak patterns.
- Object growth by type: pinpoints problematic allocations.
8. Best Practices
- Capture during steady-state load, not app startup.
- Keep symbol files (.pdb) for accurate type mapping.
- Avoid capturing on production without isolation; dumps pause processes briefly.
- Regularly monitor memory via dotnet-counters for runtime GC stats.
9. Conclusion
With dotnet-gcdump, you gain visibility into .NET’s managed memory system without intrusive profiling. It’s efficient, lightweight, and designed for production use.
Use it periodically to ensure your app’s GC behavior remains healthy and predictable.
Sample workflow recap:
StepCommandOutputInstalldotnet tool install --global dotnet-gcdumpInstalled messageList processesdotnet-gcdump psShows running .NET processesCapture baseline dumpdotnet-gcdump collect -p <PID> -o beforeWrites .gcdump fileRun workload(simulate app usage)Capture comparison dumpdotnet-gcdump collect -p <PID> -o afterWrites .gcdump fileAnalyzeVisual Studio / PerfViewCompare growth trends
메타데이터
- post_id
- ab712955a63c
- slug
- deep-dive-into-net-garbage-collection-with-dotnet-gcdump-ab712955a63c
- url
- https://medium.com/@imtejassingh/deep-dive-into-net-garbage-collection-with-dotnet-gcdump-ab712955a63c
- canonical_url
- https://medium.com/@imtejassingh/deep-dive-into-net-garbage-collection-with-dotnet-gcdump-ab712955a63c
- author_url
- https://medium.com/@imtejassingh
- status
- ok
- fetched_at
- 2026-06-23 17:05:31