G1 garbage collector vs other Java GCs: Choose the right one for your app
Java developers love to argue about frameworks and libraries, but garbage collection is where performance lives or dies. Pick the wrong GC…
G1 garbage collector vs other Java GCs: Choose the right one for your app
Java developers love to argue about frameworks and libraries, but garbage collection is where performance lives or dies. Pick the wrong GC, and your users sit through random pauses while memory cleanup happens. Pick the right one, tune it well, and your app hums along smoothly even under load.
Non member link: https://blog.s10n.dev/g1-garbage-collector-vs-other-java-gcs-choose-the-right-one-for-your-app-ac4f21593727?sk=51226afd32fb658461f4e64245c1b516
Photo by Michiel Leunens on Unsplash
The Java HotSpot VM ships with several garbage collectors, each designed for different workloads. The Garbage First (G1) GC has become the default since Java 9, but that doesn’t mean it’s always the best choice for your application. Understanding how G1 works and compares to other collectors helps you make an informed decision backed by your actual performance requirements.
When Netflix migrated their streaming services to G1 GC, they saw significant improvements in both latency and throughput compared to their previous collector. This real-world validation shows that choosing the right GC and tuning it properly can transform application performance without changing business logic.
This guide walks through Java’s garbage collection fundamentals, explains how G1 GC works under the hood, and shows you how to choose and tune the right collector for your needs.
Why garbage collection matters
Every time your Java application creates an object, the JVM allocates memory for it on the heap. In languages like C, you’d need to manually free that memory when you’re done with it. Forget to free it, and you leak memory until your application crashes. Free it too early, and you get dangling pointers that corrupt your program.
Java’s garbage collector handles this automatically. It tracks which objects your application can still reach and reclaims memory from objects you can’t reach anymore. This prevents memory leaks and use-after-free bugs, letting you focus on your application code instead of memory bookkeeping.
But garbage collection isn’t free. The collector needs CPU time to find dead objects and reclaim their memory. During some collection phases, it needs to pause your application threads to ensure memory consistency. These pauses directly impact your application’s responsiveness and throughput.
The choice of garbage collector determines how these pauses happen: their frequency, duration, and predictability.
- A web service handling user requests cares deeply about pause times because users notice delays.
- A batch processing job cares more about overall throughput; occasional pauses don’t matter as long as the job finishes quickly.
How Java’s generational model works
Most Java garbage collectors use a generational approach based on the weak generational hypothesis: most objects die young. Studies of Java applications show that the vast majority of objects become unreachable shortly after allocation.
By separating short-lived and long-lived objects into different memory areas, the JVM can collect garbage more efficiently. It can collect the young generation frequently with minimal work, since most objects there are already dead. It collects the old generation less frequently, since objects that survived long enough to get promoted tend to stick around.
Young generation: Where new objects start their lives. The young generation has three parts:
- Eden space: Where the JVM allocates all new objects (except unusually large ones)
- Survivor space S0: Where objects that survive one garbage collection get copied
- Survivor space S1: Alternate survivor space used during collection (only one survivor space is active at a time)
Old generation: Where long-lived objects eventually land after surviving multiple collections.

When Eden space fills up, the garbage collector performs a minor collection. It identifies live objects in Eden and the active survivor space, copies them to the other survivor space (or promotes them to old generation if they’re old enough), then wipes Eden clean. Dead objects simply vanish; the collector doesn’t need to process them individually.
The age threshold for promotion varies by collector and can be tuned, but typically objects survive 15 young collections before promotion. Each time an object survives a collection, its age increments. Once it reaches the threshold, it moves to the old generation on the next collection.
Java HotSpot VM garbage collectors overview
The Java HotSpot VM provides several garbage collectors optimized for different scenarios. Understanding the landscape helps you choose the right tool for your needs.
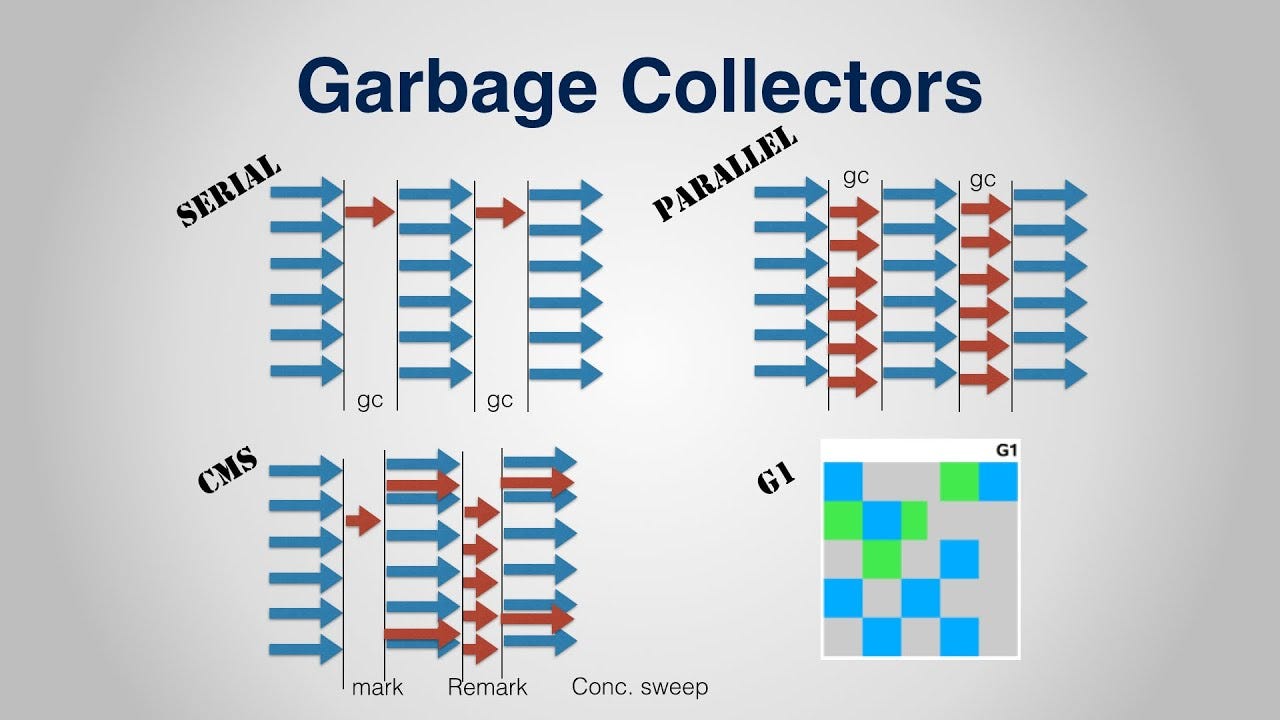
Serial GC: Single-threaded collector suitable for small applications with heap sizes under 100MB. All collection happens on one thread with application pauses. It’s simple and has low overhead, making it appropriate for client applications or containers with limited CPU. Enable with -XX:+UseSerialGC.
Parallel GC: Multi-threaded collector focused on throughput. Uses multiple threads for young and old generation collections but still has stop-the-world pauses. It maximizes throughput at the cost of longer pause times. Good for batch processing or applications that can tolerate multi-second pauses. Enable with -XX:+UseParallelGC.
G1 GC: Regionalized, generational collector that targets predictable pause times while maintaining good throughput. The default since Java 9. Designed for server applications with heaps from 4GB to hundreds of gigabytes. Enable explicitly with -XX:+UseG1GC (though it's usually the default).
ZGC and Shenandoah: Low-latency collectors designed for minimal pause times (sub-millisecond) on large heaps. These use different algorithms to perform most collection work concurrently. Worth exploring for latency-critical applications requiring sub-10ms pause guarantees.
Each collector makes different tradeoffs:
- Throughput: Percentage of total time not spent in garbage collection
- Pause time: How long application threads stop during collection
- Pause predictability: How consistent pause times are
- Memory overhead: Extra memory needed for collector metadata
- Heap size scalability: How well the collector handles large heaps
Serial GC maximizes throughput for small heaps but doesn’t scale to multi-core systems. Parallel GC achieves high throughput on large heaps but has unpredictable, potentially long pause times. G1 GC balances throughput and pause time predictability, making it suitable for most server applications.
G1 GC architecture: Regions instead of generations
G1 takes a fundamentally different approach than traditional collectors. Instead of dividing the heap into contiguous young and old generation spaces, G1 divides the entire heap into equally-sized regions.
The JVM sets region size at startup based on heap size, aiming for around 2048 regions total. The region size must be a power of two and ranges from 1MB to 32MB. On a 4GB heap, each region would be approximately 2MB (4096MB ÷ 2048 regions).
You can override the automatic sizing with -XX:G1HeapRegionSize=n, but the default calculation works well for most applications:
# Let G1 calculate region size automatically
# 8GB heap gets ~4MB regions (8192MB ÷ 2048 regions)
java -Xms8g -Xmx8g \
     -XX:+UseG1GC \
     -jar application.jar

# Override region size only if you have specific requirements
# For example, if you have many large objects (>2MB)
java -Xms8g -Xmx8g \
     -XX:+UseG1GC \
     -XX:G1HeapRegionSize=8M \
     -jar application.jar
These regions are then logically assigned to serve as:
- Eden regions: Where new objects are allocated
- Survivor regions: Where young objects that survive collection are copied
- Old generation regions: Where long-lived objects land after promotion
- Humongous regions: For objects larger than 50% of region size (these skip young generation and go straight to old generation)
The key insight: eden, survivor, and old generations are logical sets of these regions, not physically contiguous areas. This lets G1 dynamically resize generations and collect regions independently.
This regionalized approach enables G1 to:
- Compact the heap incrementally without full-heap collections. Each collection compacts selected regions, gradually reducing fragmentation.
- Collect regions with the most garbage first (the “garbage first” principle). G1 tracks how much garbage each region contains and prioritizes collecting nearly-empty regions.
- Meet pause time targets by controlling how many regions to collect. Need a shorter pause? Collect fewer regions.
- Avoid heap fragmentation in long-running applications. Traditional collectors can fragment the old generation, leading to allocation failures even when total free memory is sufficient. G1’s incremental compaction prevents this.
G1 collection phases: Young, marking, and mixed
G1 performs three types of garbage collection activities, each optimized for different purposes.
Young collections
G1 satisfies most allocation requests from eden regions. When eden fills up, G1 performs a stop-the-world young collection. This collects both eden regions and survivor regions from the previous collection. Live objects get evacuated (copied) to new regions. Objects that have aged sufficiently get promoted to old generation regions; younger objects go to survivor regions.
Young collections are typically fast (tens of milliseconds) because:
- Eden is usually small relative to total heap
- Most objects in eden are dead (weak generational hypothesis)
- Dead objects don’t need processing; G1 just doesn’t copy them
- Parallel threads evacuate live objects simultaneously
The young generation size is dynamic. G1 adjusts it based on pause time targets and observed collection performance.
Concurrent marking cycle
When total heap occupancy crosses a threshold (controlled by -XX:InitiatingHeapOccupancyPercent, default 45%), G1 starts a concurrent marking cycle to identify live objects in old generation regions.
This cycle determines which old regions contain mostly garbage and are good candidates for collection. The cycle has five phases:
Phase 1: Initial Mark (Stop-The-World, piggybacks on young GC)
- Marks GC roots (stack variables, static fields)
- Duration: ~10–50ms
Phase 2: Root Region Scanning (Concurrent)
- Scans survivor regions for references to old gen
- Must complete before next young GC starts
- Duration: ~50–200ms
Phase 3: Concurrent Marking (Concurrent, interruptible)
- Traces all reachable objects across entire heap
- Can be interrupted by young GCs
- Uses Snapshot-At-The-Beginning (SATB) algorithm
- Duration: ~1–5 seconds
Phase 4: Remark (Stop-The-World)
- Completes marking by processing SATB buffers
- Handles objects modified during concurrent marking
- Duration: ~10–50ms
Phase 5: Cleanup (Partly Stop-The-World, partly concurrent)
- Identifies completely free regions and mixed GC candidates
- Returns empty regions to free list
- Duration: ~10–100ms STW, then concurrent
G1 uses the Snapshot-At-The-Beginning (SATB) algorithm. This means it takes a logical snapshot of live objects at the start of marking. Any objects allocated during marking are considered live. This approach allows the application to keep running during most of the marking cycle.
The concurrent phases run in background threads while your application continues. Only initial mark, remark, and part of cleanup pause the application briefly.
Mixed collections
After successful marking, G1 switches from performing young-only collections to performing mixed collections. In a mixed collection, G1 collects both young regions and some old regions with the most reclaimable space.
# Configure mixed collection behavior
java -Xms8g -Xmx8g \
     -XX:+UseG1GC \
     -XX:MaxGCPauseMillis=200 \
     -XX:G1MixedGCCountTarget=8 \
     -XX:G1HeapWastePercent=5 \
     -jar application.jar
Key parameters:
-XX:G1MixedGCCountTarget=8(default 8): Target number of mixed GCs after a marking cycle. G1 divides old region cleanup across this many collections.-XX:G1HeapWastePercent=5(default 5): Acceptable percentage of heap that can remain as garbage. G1 stops mixed GCs when waste falls below this threshold.-XX:G1MixedGCLiveThresholdPercent=85(default 85): Don't collect old regions with >85% live objects. Only collect regions with lots of garbage.
G1 performs multiple mixed collections to incrementally clean old generation regions, then reverts to young-only collections until the next marking cycle triggers. This incremental approach keeps pause times predictable while gradually reclaiming space from the old generation.
How G1 meets pause time targets
G1’s primary goal is meeting a configurable pause time target while maintaining good throughput. The default target is 200 milliseconds, meaning G1 tries to keep stop-the-world pauses under 200ms.
It achieves this through adaptive behavior that adjusts collection scope based on observed performance. G1 continuously tracks how long different collection activities take and uses this data to predict future collection times.
During young collections, G1 tracks time to scan remembered sets, time to evacuate live objects, and time for post-collection cleanup. Using these measurements, G1 builds a cost model that predicts how long it would take to collect different numbers of regions.
During mixed collections, G1 uses the same cost model to decide how many old regions to include in the collection set. It selects regions with the most reclaimable space first (garbage first principle) until adding another region would exceed the pause target.
# Configure pause time target for different application requirements
# Low-latency web service
# Users notice pauses > 100ms
java -XX:+UseG1GC -XX:MaxGCPauseMillis=100 -jar web-service.jar

# Balanced server application
# Default 200ms target works well
java -XX:+UseG1GC -jar application.jar

# Batch processing
# Can tolerate longer pauses for better throughput
java -XX:+UseG1GC -XX:MaxGCPauseMillis=500 -jar batch-processor.jar
Watch out: The pause time target is a goal, not a guarantee. G1 will try to meet it but may exceed it if necessary to avoid running out of memory. If your application allocates faster than G1 can reclaim space within the pause target, you’ll see pauses exceed the target or even get allocation failures.
Remembered sets: Tracking cross-region references
One challenge with independent region collection: how do you know if objects in other regions reference objects in the region you’re collecting? G1 solves this with Remembered Sets (RSets). Each region maintains its own RSet that tracks references from other regions into that region.
When collecting a region, G1 only needs to scan:
- GC roots (stacks, static fields)
- That region’s RSet (references from other regions)
- Objects within the region itself
This enables parallel and independent collection of regions without scanning the entire heap.
G1 uses a post-write barrier to maintain RSets. Whenever your application code modifies an object reference, the barrier checks if it creates a cross-region reference and updates the appropriate RSet if needed. This happens transparently; the JIT compiler inserts write barrier checks automatically.
RSets come with tradeoffs:
Benefits:
- Enable parallel, independent region collection
- Reduce collection pause times by avoiding full-heap scans
- Make G1’s regionalized approach practical
Costs:
- Memory overhead: Each region needs space for its RSet (typically a few percent of heap)
- Write barrier overhead: Every reference update has a small CPU cost
- RSet maintenance: Cleaning up stale entries takes time during collection
The benefits usually outweigh the costs for server applications with multi-gigabyte heaps. For small heaps (<4GB), the overhead may not be worthwhile; Serial or Parallel GC may be more efficient.
Enabling and configuring garbage collectors
Selecting a garbage collector is straightforward with JVM flags. You specify the collector at JVM startup; you can’t change it while the JVM is running.
# Serial GC: Single-threaded, low overhead
# Good for: Small heaps, single-core containers
java -XX:+UseSerialGC \
     -Xms128m -Xmx128m \
     -jar small-application.jar

# Parallel GC: Multi-threaded, throughput-focused
# Good for: Batch processing, throughput-critical apps
java -XX:+UseParallelGC \
     -Xms4g -Xmx4g \
     -XX:ParallelGCThreads=4 \
     -jar batch-processor.jar

# G1 GC: Default since Java 9, balanced latency and throughput
# Good for: Server applications, large heaps, predictable pauses
java -XX:+UseG1GC \
     -Xms8g -Xmx8g \
     -XX:MaxGCPauseMillis=200 \
     -jar web-service.jar

# Check which GC is active
java -XX:+PrintCommandLineFlags -version
Basic G1 configuration follows a simple pattern: set heap size, optionally set pause target, and let G1 handle the rest:
# Minimal G1 configuration
java -Xms8g \              # Initial heap size
     -Xmx8g \              # Maximum heap size (same = no resizing)
     -XX:+UseG1GC \        # Enable G1 (optional if Java 9+)
     -XX:MaxGCPauseMillis=200 \  # Target pause time
     -jar application.jar

# More detailed production configuration
java -Xms16g -Xmx16g \
     -XX:+UseG1GC \
     -XX:MaxGCPauseMillis=100 \
     -XX:G1HeapRegionSize=8m \
     -XX:ParallelGCThreads=8 \
     -XX:ConcGCThreads=2 \
     -XX:InitiatingHeapOccupancyPercent=45 \
     -jar application.jar

# Enable GC logging (Java 9+)
java -Xms8g -Xmx8g \
     -XX:+UseG1GC \
     -Xlog:gc*:file=/var/log/gc.log:time,uptime,level,tags \
     -jar application.jar
The heap size settings (-Xms and -Xmx) are the most important tuning parameters. Setting them equal prevents heap resizing during runtime, which can cause pauses. Set them based on your application's actual memory needs plus headroom for GC efficiency (typically 20-30% free space).
Tuning G1 for your application
G1 works well with defaults for many applications, but tuning can help if you have specific requirements. Start minimal, measure, then tune based on observed behavior.
Setting pause time targets
The most important tuning knob is -XX:MaxGCPauseMillis. This sets your target maximum pause time in milliseconds. G1 adjusts young generation size and collection set selection to meet this target.
Choosing the right pause target depends on your application’s user experience requirements. Web services typically want 100–200ms. Batch processing can tolerate 500–2000ms. Real-time systems may need <50ms, in which case you should consider ZGC or Shenandoah instead of G1.
Controlling young generation size
G1 automatically sizes the young generation between 5% and 60% of the heap by default. These bounds are controlled by experimental flags:
java -Xms8g -Xmx8g \
     -XX:+UseG1GC \
     -XX:+UnlockExperimentalVMOptions \
     -XX:G1NewSizePercent=10 \      # Min young gen: 10% of heap
     -XX:G1MaxNewSizePercent=40 \   # Max young gen: 40% of heap
     -jar application.jar
Most applications should leave these at defaults. Only adjust if you observe problematic behavior and understand the tradeoff: constraining the range limits G1’s ability to adapt to meet pause targets.
Tuning mixed collections
Several flags control how G1 performs mixed collections:
java -Xms16g -Xmx16g \
     -XX:+UseG1GC \
     -XX:MaxGCPauseMillis=200 \
     -XX:InitiatingHeapOccupancyPercent=35 \  # Start marking earlier
     -XX:G1MixedGCCountTarget=12 \            # Spread cleanup over more GCs
     -XX:G1HeapWastePercent=3 \               # More thorough cleanup
     -jar application.jar
These flags let you balance old generation cleanup aggressiveness against pause time impact.
Thread configuration
Control how many threads G1 uses for parallel and concurrent work:
java -Xms16g -Xmx16g \
     -XX:+UseG1GC \
     -XX:ParallelGCThreads=10 \   # STW collection threads
     -XX:ConcGCThreads=2 \        # Concurrent marking threads
     -jar application.jar
The defaults work well for most configurations. Only adjust thread counts if you observe specific problems.
When to use which collector
Choosing the right garbage collector depends on your application’s requirements:
Use G1 GC when:
- Your heap is 4GB or larger
- You need predictable pause times in the sub-second range
- You want balanced throughput and latency
- Your application runs continuously (servers, services)
- You want the JVM to adapt automatically to workload changes
Use Parallel GC when:
- Throughput is more important than pause times
- You can tolerate multi-second pauses during collection
- Your application does batch processing or offline analytics
- You have abundant CPU resources
Use Serial GC when:
- Your heap is small (under 100MB)
- You’re running on single-core systems or small containers
- You’re building simple client applications or command-line tools
Common tuning mistakes
Mistake 1: Setting pause target too low
Setting -XX:MaxGCPauseMillis to an unrealistic value causes G1 to constantly shrink young generation size, leading to more frequent collections and lower throughput.
How to set the right target: Start with 200ms (default). Monitor actual pause times in GC logs. If 99th percentile is well below 200ms, you can lower the target. If pauses regularly exceed 200ms, investigate allocation rate or increase heap size.
Mistake 2: Constraining young generation size
Manually setting -Xmn (fixed young generation size) disables G1's adaptive sizing, preventing it from meeting pause targets. Let G1 size the young generation dynamically.
Mistake 3: Ignoring allocation rate
If your application allocates objects faster than G1 can reclaim space, you’ll get allocation failures despite tuning. No amount of GC tuning can fix excessive allocation. Solutions include reducing allocation rate (object pooling, reuse) or increasing heap size.
Monitoring GC behavior
You can’t tune what you don’t measure. Enable GC logging to observe collector behavior:
# Basic GC logging
java -Xms8g -Xmx8g \
     -XX:+UseG1GC \
     -Xlog:gc:file=/var/log/gc.log:time,uptime,level,tags \
     -jar application.jar

# Detailed GC logging with rotation
java -Xms8g -Xmx8g \
     -XX:+UseG1GC \
     -Xlog:gc*:file=/var/log/gc-%t.log:time,uptime,level,tags:filecount=5,filesize=100M \
     -jar application.jar
Sample GC log output:
[2025-01-15T10:23:45.123+0000][0.567s][info][gc] GC(0) Pause Young (Normal) (G1 Evacuation Pause)
[2025-01-15T10:23:45.123+0000][0.567s][info][gc] GC(0) Using 8 workers of 8 for evacuation
[2025-01-15T10:23:45.145+0000][0.589s][info][gc] GC(0) Eden regions: 245->0(230)
[2025-01-15T10:23:45.145+0000][0.589s][info][gc] GC(0) Survivor regions: 12->18(32)
[2025-01-15T10:23:45.145+0000][0.589s][info][gc] GC(0) Old regions: 150->152
[2025-01-15T10:23:45.145+0000][0.589s][info][gc] GC(0) Pause Young (Normal) (G1 Evacuation Pause) 1640M->693M(2048M) 22.456ms
Key metrics to watch:
- Pause times: Average, max, and percentiles (P99, P999). Compare to your target.
- Throughput: Time spent in application vs GC. Aim for >95% application time.
- Heap occupancy: Before and after collections. Should reclaim significant space.
- Allocation rate: How fast your app creates objects. High rates (>500MB/s) can cause problems.
- Mixed collection frequency: How often marking cycles complete.
Real-world example: Low-latency REST API
A high-traffic REST API serves user requests during peak periods. Response times need to stay under 100ms. Any GC pause over 150ms causes user-visible delays.
Workload characteristics:
- Request rate: 500 req/sec during peak
- Heap usage: ~6GB
- Allocation rate: ~300MB/sec
- Requirement: P99 latency < 100ms, max latency < 150ms
# Low-latency configuration
java -Xms8g -Xmx8g \
     -XX:+UseG1GC \
     -XX:MaxGCPauseMillis=75 \          # Target 75ms (margin below 100ms)
     -XX:+UnlockExperimentalVMOptions \
     -XX:G1NewSizePercent=20 \          # Min 20% young gen
     -XX:G1MaxNewSizePercent=40 \       # Max 40% young gen
     -XX:InitiatingHeapOccupancyPercent=40 \  # Start marking early
     -XX:ParallelGCThreads=8 \
     -XX:ConcGCThreads=2 \
     -Xlog:gc*:file=/var/log/gc.log:time,uptime:filecount=5,filesize=100M \
     -jar api-service.jar
Why these settings:
- Pause target 75ms: Margin below 100ms requirement
- Higher min young gen: Reduce GC frequency
- Lower IHOP (40%): Start concurrent marking earlier
- 8 parallel threads: Fast evacuation on multi-core server
Pro tip: For long-running services, monitor heap occupancy trends over time. Slowly increasing minimum heap usage after GC indicates a memory leak. G1 can’t fix leaks; you need to find and plug them with heap dump analysis.
Next steps
Understanding garbage collection helps you write more efficient Java code and diagnose performance issues. Here’s where to go deeper:
Monitor your production GC behavior: Enable GC logging in your applications and analyze the logs. Look for patterns: Are pause times meeting your targets? Is throughput acceptable?
Experiment in staging: Don’t tune production directly. Set up a staging environment that mimics production load and experiment with different collectors and settings. Measure the impact on pause times and throughput.
Read the official documentation: The Java HotSpot VM Garbage Collection Tuning Guide covers advanced topics like humongous objects, reference processing, and detailed flag descriptions.
Explore low-latency collectors: If you need sub-10ms pause times, investigate ZGC and Shenandoah. These collectors use different algorithms to achieve ultra-low pause times on large heaps.
Optimize code, not just GC: The best GC tuning is writing code that allocates fewer objects. Before spending days tuning GC flags, spend hours reducing allocation rate. The performance gains are often larger and more sustainable.
The right garbage collector configuration can transform an application from sluggish to responsive without changing a line of code. But remember: GC tuning is the last step, not the first. Start with sufficient heap size and reasonable defaults, measure your application’s behavior, and only tune when you’ve identified specific problems backed by data.
메타데이터
- post_id
- ac4f21593727
- slug
- g1-garbage-collector-vs-other-java-gcs-choose-the-right-one-for-your-app-ac4f21593727
- url
- https://blog.stackademic.com/g1-garbage-collector-vs-other-java-gcs-choose-the-right-one-for-your-app-ac4f21593727
- canonical_url
- https://blog.stackademic.com/g1-garbage-collector-vs-other-java-gcs-choose-the-right-one-for-your-app-ac4f21593727
- author_url
- https://medium.com/@sarathm09
- status
- ok
- fetched_at
- 2026-06-14 11:28:49