The Event-Driven Shift: Streaming Data with Debezium on Google Cloud (Part 1)
Part 1 of 2: Setting up Change Data Capture from PostgreSQL through Debezium Server to Google Cloud Pub/Sub, with Redis-backed offset…
The Event-Driven Shift: Streaming Data with Debezium on Google Cloud (Part 1)
Part 1 of 2: Setting up Change Data Capture from PostgreSQL through Debezium Server to Google Cloud Pub/Sub, with Redis-backed offset tracking
The Big Picture
Before we dive into the details, here is what we built and why.
Our analytics platform serves dashboards that need to reflect database changes within seconds. The legacy approach — overnight batch ETL — meant dashboards were always a day behind. Business teams were making decisions on stale data, and the gap between “what happened” and “what the dashboard shows” was becoming a real problem.
We replaced that with a real-time Change Data Capture pipeline that streams every INSERT, UPDATE, and DELETE from PostgreSQL all the way to BigQuery, where dashboards query it directly.

The pipeline breaks down into two halves. Part 1 (this article) covers the data capture layer — getting changes out of PostgreSQL and into a message stream reliably. We walk through how PostgreSQL is configured for logical replication, how Debezium Server captures WAL changes and publishes them to Google Cloud Pub/Sub, why we use Redis to track Debezium’s position in the stream, and how we monitor the whole thing.
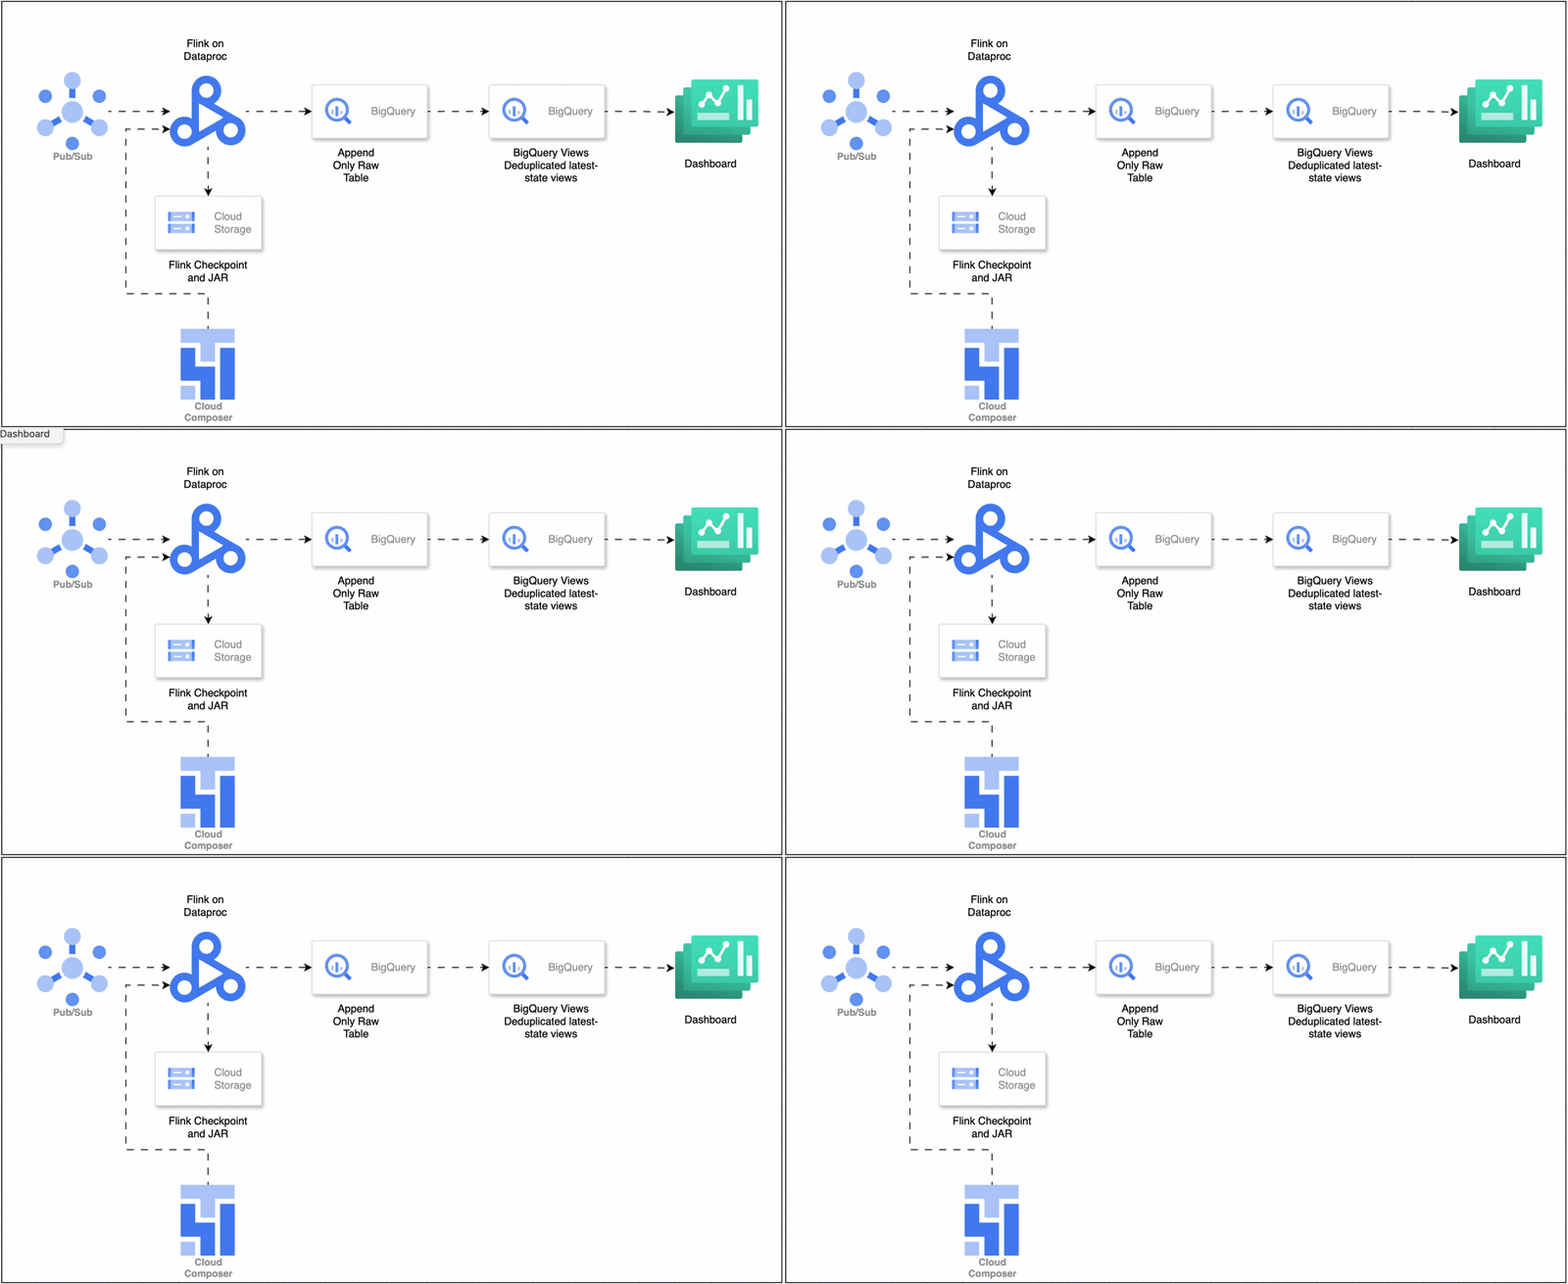
**Part 2** picks up where the messages land in Pub/Sub and covers the processing layer — how Apache Flink consumes, deduplicates, and transforms CDC events, writes them to BigQuery in an append-only pattern, and how we build the views that dashboards actually query.
In production, the pipeline handles ~3,000 events per second at peak, with sub-5-second end-to-end latency from database write to BigQuery availability. Six months in: zero data loss, 99.9% uptime.
Table of Contents
- Architecture Overview
- Choice of Technologies
- PostgreSQL Configuration for CDC
- Debezium Server Setup
- Redis for Offset Storage
- Google Cloud Pub/Sub
- Monitoring and Alerting
1. Architecture Overview
Our analytics platform needed to reflect database changes within seconds — not hours, not minutes. Batch ETL jobs that ran overnight were no longer cutting it. Dashboards were showing stale data, business decisions were lagging behind reality, and the gap between “what happened” and “what we see” kept growing.
We needed a pipeline that could capture every INSERT, UPDATE, and DELETE from PostgreSQL and deliver it downstream — reliably, in order, and without putting additional load on the primary database.

Here is the high-level data flow:
- The application writes to the PostgreSQL primary database.
- PostgreSQL records every change in its Write-Ahead Log (WAL).
- A read replica receives the WAL stream via logical replication.
- Debezium Server connects to the read replica, reads the logical replication slot, and converts WAL entries into structured CDC events.
- Before publishing each batch, Debezium persists its current offset (position in the WAL stream) to Redis, ensuring exactly-once delivery semantics on restart.
- Debezium publishes CDC events as JSON messages to a Google Cloud Pub/Sub topic.
- Pub/Sub delivers messages to a subscription, with a Dead Letter Queue (DLQ) catching any messages that repeatedly fail processing downstream.
2. Choice of Technologies
Before writing a single line of configuration, we evaluated alternatives for each layer. The decisions below shaped everything that follows.
2.1 CDC Tool: Debezium Server
Debezium Server is a standalone JVM application that embeds the Debezium connector engine and sinks directly to messaging systems — no Kafka, no ZooKeeper, no Connect workers. It gave us the full power of Debezium’s PostgreSQL connector (battle-tested logical decoding, schema tracking, snapshot support) with the operational simplicity of a single process. For a team already running on GCP with no existing Kafka infrastructure, this was the sweet spot between capability and complexity.
What we considered and passed on:
- Google Datastream — Fully managed and tempting, but at the time lacked the fine-grained control over snapshotting, filtering, and offset management that Debezium provides.
- Debezium + Kafka Connect — The most powerful option, but requires running a Kafka cluster, Connect workers, and ZooKeeper. Massive operational overhead for a pipeline that just needs to get events into Pub/Sub.
- Custom WAL parser — Maximum control, zero community support. We did not want to maintain a hand-rolled logical decoding consumer.
2.2 Message Broker: Google Cloud Pub/Sub
Google Cloud Pub/Sub was the natural fit because our entire infrastructure lives on GCP. It gave us ordered delivery (via ordering keys), native Dead Letter Queue support, automatic scaling, and near-zero operational burden. At our throughput (~3,000 events/second peak), the cost was reasonable, and the tight integration with IAM, Cloud Monitoring, and downstream GCP services (Dataflow, Flink on Dataproc) made it the path of least resistance.
What we considered and passed on:
- Apache Kafka (self-managed) — Powerful but heavy. Managing brokers, partitions, rebalancing, and ZooKeeper was not justified when Pub/Sub gave us everything we needed out of the box.
- Confluent Cloud — Managed Kafka without the ops burden, but adds a vendor dependency and does not integrate as tightly with GCP’s native services.
2.3 Offset Storage: Redis (Memorystore)
Redis via Google Cloud Memorystore stores Debezium's processing offset — the exact position in the WAL stream. Every streaming system needs to answer "where did I leave off?" and the answer must survive process restarts. Redis gave us sub-millisecond reads and writes, automatic persistence, high-availability failover, and zero additional operational complexity as a managed service. More on why offsets matter and how Redis fits in Section 5.
What we considered and passed on:
- File system — Ties the offset to a single VM. If that VM dies, the offset is gone unless you build custom backup scripts.
- In-memory — Offsets vanish on any restart. Unacceptable for production.
- PostgreSQL table — Writes offset back to the source database, adding load to the very system we are trying to offload.
3. PostgreSQL Configuration for CDC
The primary PostgreSQL instance is a Cloud SQL instance serving the main application. To enable CDC, we need logical replication turned on and a publication defined for the tables we want to capture.
3.1 Cloud SQL Flags to Set
cloudsql.logical_decoding = on          # Enables logical replication. Without this, no replication slots can be created.
max_replication_slots = 10              # Each Debezium connector uses one slot. Set higher than needed for maintenance flexibility.
max_wal_senders = 10                    # Each replication connection (replica + Debezium) uses one sender.
wal_sender_timeout = 0                  # Disables idle timeout. Prevents Debezium disconnects during low-activity periods.
max_worker_processes = 8                # Background workers for logical replication. Default is usually sufficient.
These flags require a database restart to take effect. Plan accordingly.
3.2 Publication Setup
A publication defines which tables participate in logical replication. Rather than publishing all tables (which generates unnecessary WAL traffic), we explicitly list only the tables our dashboards need.
-- Create a publication for specific tables
CREATE PUBLICATION cdc_publication FOR TABLE
    orders,
    customers,
    products,
    inventory,
    transactions,
    shipments;

-- Verify the publication
SELECT * FROM pg_publication_tables WHERE pubname = 'cdc_publication';
Important considerations
- Adding a new table to the publication requires
ALTER PUBLICATION ... ADD TABLE ...followed by a Debezium connector restart. - Only tables with a primary key (or
REPLICA IDENTITY FULL) will include the full before-and-after state in CDC events. Tables without a primary key only emit the new row values on UPDATE. - Large tables with frequent updates generate proportionally more WAL. Monitor WAL generation rate after enabling.
3.3 Replication Slot Creation
-- Debezium creates this automatically on first connection, but you can pre-create it:
SELECT pg_create_logical_replication_slot('debezium_cdc_slot', 'pgoutput');
-- Monitor slot lag (critical - a stuck slot causes WAL accumulation)
SELECT slot_name,
       pg_size_pretty(pg_wal_lsn_diff(pg_current_wal_lsn(), confirmed_flush_lsn)) AS lag_size
FROM pg_replication_slots;
4. Debezium Server Setup
Debezium Server is a ready-made application that embeds a Debezium connector engine and exposes it as a standalone process — no Kafka infrastructure required. It reads change events from the source database, tracks its position via an offset store, and writes events to a configurable sink.
4.1 Deployment
Debezium Server runs on a Google Compute Engine (GCE) VM. The deployment is straightforward: a single JVM process managed by systemd.
VM Configuration
Machine type:       e2-standard-4 (4 vCPU, 16 GB RAM) — CDC is CPU-bound at peak; 16 GB gives JVM headroom for large batches
Disk:               50 GB SSD (pd-ssd) — for temp files and logs
Network:            Same VPC as Cloud SQL and Memorystore (private IP connectivity)
Service account:    Custom SA with pubsub.publisher and redis.editor roles (least privilege)
JVM Configuration
-Xms4g -Xmx8g -XX:+UseG1GC -XX:MaxGCPauseMillis=2004.2 Debezium Application Configuration
The entire behavior of Debezium Server is controlled through application.properties. Below are the key configuration groups with explanations.
Source Connector (PostgreSQL)
debezium.source.connector.class=io.debezium.connector.postgresql.PostgresConnector
debezium.source.database.hostname=<replica-private-ip>
debezium.source.database.port=5432
debezium.source.database.user=debezium_replication_user
debezium.source.database.dbname=analytics_db
debezium.source.database.server.name=analytics-cdc
debezium.source.plugin.name=pgoutput
debezium.source.publication.name=cdc_publication
debezium.source.slot.name=debezium_cdc_slot
debezium.source.table.include.list=public.orders,public.customers,public.products,public.inventory,public.transactions,public.shipments
debezium.source.column.exclude.list=public.customers.password_hash,public.customers.ssn
Key points: plugin.name=pgoutput uses PostgreSQL's built-in logical decoding — no extensions needed. table.include.list is an explicit allowlist; only changes to these tables generate events. column.exclude.list strips sensitive columns at the source level so they never leave the database.
Sink (Pub/Sub)
debezium.sink.type=pubsub
debezium.sink.pubsub.project.id=<gcp-project-id>
debezium.sink.pubsub.ordering.enabled=true
ordering.enabled=true ensures events for the same record arrive in order at the subscriber — critical for correct UPDATE/DELETE sequencing.
Other Configuration Areas
Beyond source and sink, Debezium Server supports extensive tuning across several areas. Rather than listing every property, here is what each area controls and where to find the details:
Snapshot configuration controls how Debezium handles the initial full-table read on first startup. We use snapshot.mode=initial (take a full snapshot once, then switch to streaming). You can tune fetch sizes, lock timeouts, and parallelism. See: Debezium PostgreSQL Snapshot Docs
Event format controls how CDC events are serialized. We use JSON with schemas enabled (debezium.format.value=json, debezium.format.value.schemas.enable=true) — human-readable, no schema registry needed, slightly larger than Avro but far easier to debug in the Pub/Sub console. See: Debezium Serialization Docs
Heartbeat configuration keeps the replication connection alive during quiet periods and provides a monitoring signal. We send heartbeats every 30 seconds with a lightweight query to a heartbeat_table. See: Debezium Heartbeat Docs
Signal and notification enables runtime commands (ad-hoc snapshots, schema changes) without restarting Debezium. See: Debezium Signaling Docs
Transforms allow event routing, filtering, and enrichment via Single Message Transforms (SMTs). See: Debezium Transforms Docs
For the full list of configuration properties: Debezium Server Configuration Reference
5. Redis for Offset Storage
5.1 Why Offsets Matter
Every streaming system needs to answer one question: “Where did I leave off?” Debezium reads a continuous stream of WAL changes. If the process crashes and restarts, it needs to know the exact position (called an “offset” or “LSN” — Log Sequence Number) in the WAL stream to resume from. Without a reliable offset store:
- If the offset is lost: Debezium falls back to re-snapshotting or re-reading WAL from the beginning, producing massive duplicates downstream.
- If the offset is stale: Events between the stale offset and the crash point are replayed, causing duplicates.
- If the offset is ahead of actual processing: Events between the true position and the stored offset are skipped, causing data loss.
The offset store must be durable, fast, and accessible from any VM that might run Debezium (for failover scenarios).
5.2 Redis (Memorystore) Configuration
Tier: Standard (HA) - automatic failover with a replica node; zero data loss on primary failure
Memory: 1 GB - offsets are tiny (few KB); 1 GB is the minimum for Standard tier
Redis version: 7.0
Region/Zone: Same region as Debezium VM
Network: Same VPC (private IP, no public exposure)
Auth: AUTH string enabled
TLS: Enabled (rediss:// scheme)
Persistence: RDB snapshots every 1 minute
Maxmemory policy: noeviction - critical; prevents Redis from silently dropping offset keys under memory pressure
5.3 Debezium Offset Storage Configuration
debezium.source.offset.storage=io.debezium.storage.redis.RedisOffsetBackingStore
debezium.source.offset.storage.redis.address=rediss://<memorystore-ip>:6379
debezium.source.offset.storage.redis.password=<auth-string>
debezium.source.offset.storage.redis.ssl.enabled=true
debezium.source.offset.flush.interval.ms=10000
debezium.source.offset.storage.redis.key=debezium:offsets:analytics-cdc
offset.flush.interval.ms=10000 flushes to Redis every 10 seconds — balancing recovery granularity (at most 10 seconds of replay on crash) against Redis write frequency. The key is namespaced (debezium:offsets:analytics-cdc) to avoid collisions if multiple Debezium instances share the same Redis.
5.4 How It Works at Runtime
During normal operation, Debezium processes events from the WAL and periodically (every offset.flush.interval.ms) writes the current LSN to Redis. The write is a simple SET command — atomic and fast. On restart, Debezium reads the offset from Redis with a GET, then tells PostgreSQL to start streaming from that LSN.
If Redis is temporarily unavailable, Debezium continues processing events but cannot persist offsets. It logs warnings and retries. If Debezium crashes during this window, it will replay events from the last successfully persisted offset — a bounded amount of duplicates (at most offset.flush.interval.ms worth of events), which the downstream Flink consumer handles via deduplication.
6. Google Cloud Pub/Sub
6.1 Topic Configuration
Debezium publishes all CDC events to a single Pub/Sub topic. We use a single topic (rather than one per table) to simplify subscription management. Table-level routing happens downstream in Flink.
Topic name:             cdc-events
Message ordering:       Enabled
Message retention:      7 days — allows replay if Flink falls behind or needs reprocessing
Schema:                 None (raw JSON) — Debezium's JSON already includes schema metadata
Each message is published with an ordering key derived from table name and primary key (e.g., public.orders.12345). This guarantees all changes to a specific record arrive in order while allowing massive parallelism across records.
6.2 Subscription Configuration
Subscription name:      cdc-events-flink-subscription
Delivery type:          Pull — Flink pulls at its own pace, enabling backpressure
Ack deadline:           600 seconds — Flink processes in micro-batches; 600s prevents premature redelivery
Message ordering:       Enabled (must match topic)
Exactly-once delivery:  Enabled — Pub/Sub deduplicates on the broker side
Retry policy:           Min backoff 10s, max backoff 600s (exponential)
Dead Letter Queue:      cdc-events-dlq
Max delivery attempts:  10 — after 10 failures, messages move to DLQ instead of blocking the subscription
6.3 Dead Letter Queue
DLQ topic:              cdc-events-dlq
DLQ subscription:       cdc-events-dlq-monitor (used by alerting)
Message retention:      14 days — longer than main topic; gives time to investigate and replay
Messages land here when they cannot be processed after 10 attempts. Common causes: schema changes breaking the Flink parser, oversized messages, or transient downstream failures outlasting the retry window.
For full Pub/Sub configuration options: Google Cloud Pub/Sub Documentation
7. Monitoring and Alerting
A CDC pipeline is only as good as your ability to know it is working. Silent failures — where the pipeline looks healthy but events are being dropped or delayed — are the most dangerous failure mode. We monitor at four levels.
7.1 PostgreSQL
Replication slot lag (bytes)     — alert if > 500 MB. Growing lag means Debezium is falling behind; unchecked, WAL fills the disk.
WAL disk usage                   — alert if > 70%. WAL accumulation from a stuck slot can crash the database.
Replication slot active status   — alert if false for > 5 min. Inactive slot = Debezium disconnected, events piling up.
Replica lag (seconds)            — alert if > 30s. High replica lag delays all CDC events.
Source: pg_replication_slots view and Cloud SQL metrics.
7.2 Debezium
Events processed/sec             — alert if < 100 for > 5 min (business hours). Sudden drop = stall or connectivity issue.
Streaming lag (ms)               — alert if > 30,000 ms. Gap between PostgreSQL change time and Debezium processing time.
Heartbeat age                    — alert if > 2 min old. Stale heartbeat = Debezium stalled even if process is running.
Connector status                 — alert if not RUNNING. Captures connector failures and restart loops.
JVM heap usage                   — alert if > 85%. Large transactions can spike heap; approaching OOM.
GC pause time                    — alert if > 500 ms. Long pauses cause processing delays and replication timeouts.
Source: Debezium JMX metrics exposed via Prometheus.
7.3 Redis (Memorystore)
Connected clients                — alert if 0 for > 2 min. Debezium lost Redis connection; offsets not being persisted.
Memory usage %                   — alert if > 80%. Should never happen with offset-only storage; indicates leak or misconfig.
Operations/sec                   — alert if 0 for > 2 min. No offset reads/writes = Debezium down or disconnected.
Keyspace hits/misses             — alert on sudden spike in misses. Could mean offset key deleted or Redis flushed.
Source: Memorystore metrics in Cloud Monitoring.
7.4 Pub/Sub
Oldest unacked message age       — alert if > 10 min. Flink consumer not keeping up or has stopped entirely.
Undelivered message count (DLQ)  — alert if > 0. Any DLQ message needs human attention.
Publish rate (messages/sec)      — alert if < 50 for > 5 min (business hours). Debezium stopped publishing.
Publish error rate               — alert if > 0 for > 1 min. Debezium cannot reach Pub/Sub — network or permission issue.
Source: Pub/Sub topic and subscription metrics in Cloud Monitoring.
7.5 Alerting Strategy
Critical (P1) — PagerDuty/Opsgenie + Slack #cdc-alerts, immediate response. Examples: replication slot inactive, DLQ messages, Debezium process down.
Warning (P2) — Slack #cdc-alerts, response within 1 hour. Examples: replication lag > 30s, heap > 85%, consumer falling behind.
Informational — Slack #cdc-monitoring, next business day. Examples: throughput variance, minor latency spikes.
A single Cloud Monitoring dashboard displays all four layers on one screen — replication slot health, Debezium throughput and lag, Redis connectivity, and Pub/Sub consumption rate. The goal is to see the entire pipeline’s health at a glance.
What’s Next — Part 2
At this point, every database change flows reliably from PostgreSQL through Debezium into Pub/Sub. The pipeline handles ~3,000 events/second at peak, with sub-2-second end-to-end latency and zero data loss over six months of production operation.
But raw CDC events sitting in Pub/Sub are not useful for dashboards. In Part 2, we cover how Apache Flink consumes these events, transforms and deduplicates them, writes them to BigQuery, and how we build the aggregated views that power our analytics dashboards.
Part 2 covers:
- Apache Flink consumer on Dataproc
- Stream processing, deduplication, and transformation
- BigQuery append-only write strategy
- Building aggregated views for dashboard consumption
- Monitoring the streaming layer
Part 2: From Pub/Sub to Dashboard-Ready Data: Stream Processing with Apache Flink and BigQuery
Resources
메타데이터
- post_id
- ac6ded09e4d5
- slug
- the-event-driven-shift-streaming-data-with-debezium-on-google-cloud-part-1-ac6ded09e4d5
- url
- https://medium.com/meghgen/the-event-driven-shift-streaming-data-with-debezium-on-google-cloud-part-1-ac6ded09e4d5
- canonical_url
- https://medium.com/meghgen/the-event-driven-shift-streaming-data-with-debezium-on-google-cloud-part-1-ac6ded09e4d5
- author_url
- https://medium.com/@rishav-sarkar
- status
- ok
- fetched_at
- 2026-06-10 08:17:25