How to Perform API Load Testing Without Complex Setup
How to Load Test an API Without the Usual Pain: Why I Built Loadtester.org
How to Perform API Load Testing Without Complex Setup
How to Load Test an API Without the Usual Pain: Why I Built Loadtester.org
There is a weird pattern in software teams.
Everyone cares about performance in theory. Everyone agrees that speed matters, latency matters, uptime matters, and reliability matters. Everyone knows that slow APIs kill conversions, break user trust, and make infrastructure costs harder to predict. And yet, when it is time to actually test a system under load, most teams either do nothing, run one rushed benchmark, or reach for a tool that feels like it was designed for a different era of the internet.
That gap is exactly why I built **Loadtester.org**.
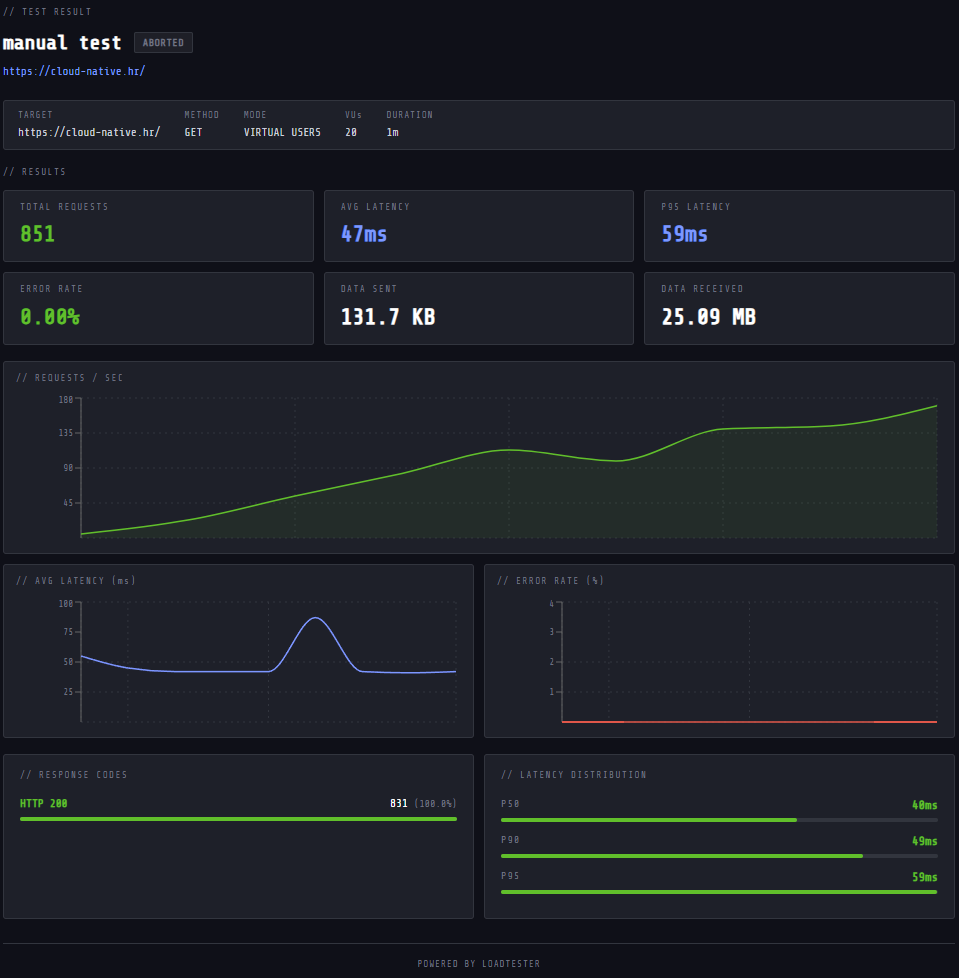
I wanted a product that made performance testing feel practical again. Not academic. Not overengineered. Not buried under scripts, YAML, or a giant “you should probably read the docs for three hours first” setup. I wanted a tool that lets you open a dashboard, configure a test in minutes, run traffic against a real target, compare results, spot regressions, automate checks, and move on with your day knowing your system is either healthy or not.
If you have ever searched for terms like http load tester, load checker, free load testing tools, load testing platform, http load test, application load testing, or even a loader.io alternative, you already understand the problem space. People are not searching for those phrases because load testing is a fun hobby. They are searching because they need answers. They need to know whether their API can handle traffic, whether a deployment made things worse, whether a landing page collapses under a campaign spike, whether their backend is stable, and whether the system they are shipping will survive contact with real users.
This article is partly a practical guide to load testing and partly the story behind my app. I want to explain how I think about performance testing, what I believe most existing tools get wrong, how Loadtester.org is structured, which workflows it supports today, and why I think there is still room for a modern, focused product in a category that many people assume is already “solved.”
It is not solved.
Not for teams that want something simple. Not for founders who want answers now. Not for developers who want an actual workflow rather than a pile of raw numbers. And not for companies that need repeatable, realistic testing without dragging a whole performance engineering department into every release.
So let’s start with the basics.
Why load testing still matters more than most teams admit
A lot of production failures do not begin as dramatic outages. They begin as minor performance issues that nobody took seriously early enough.
A small latency increase after a deployment. A database query that starts looking harmlessly slow. A queue that drains just a bit more slowly during peak times. A third-party API call that introduces variability. A backend endpoint that works perfectly fine at low traffic but starts returning errors when concurrency increases.
Those things are easy to ignore when you test manually in a local environment or click through the UI with one browser tab. They become very difficult to ignore when a few hundred or a few thousand users hit the system at once.
That is why application load testing matters. It is not just about seeing whether a service “works.” It is about understanding how it behaves when reality shows up.
A healthy load testing practice gives you answers to questions like:
- How many requests per second can this endpoint sustain?
- At what point does latency start to degrade?
- What does the p95 latency look like under moderate load versus heavy load?
- Do error rates spike gradually or suddenly?
- Does a new release improve throughput or hurt it?
- Is the problem in the application layer, the database, the cache, the network, or an external dependency?
- Can we safely launch this feature?
- Can we safely send this campaign?
- Can we safely merge this infrastructure change?
These are not theoretical concerns. They are product concerns, engineering concerns, and revenue concerns. Performance is part of UX. It is part of conversion. It is part of search visibility. It is part of retention. It is part of infrastructure economics. It is part of trust.
And despite all of that, the experience of actually running a test is often still bad.
The problem with many loadtest tools
In my experience, most loadtest tools tend to fall into one of two buckets.
The first bucket is “too barebones.” These tools let you fire requests at a URL, but the workflow ends there. You get a rough benchmark, maybe a graph, maybe a pass/fail feeling, but not a system for actually incorporating performance testing into normal engineering work. There is little support for comparisons, regression checks, automation, or repeatable habits.
The second bucket is “too heavy.” These tools are powerful, but the cost of using them is high. They want scripts, configuration files, infrastructure setup, edge-case handling, and a level of time investment that many teams simply do not have. If you are a solo founder, a small SaaS team, an agency, or a startup moving fast, that overhead is enough to make load testing slip to the bottom of the backlog.
That is the core frustration I wanted to solve.
I did not build Loadtester.org to replace every possible performance testing framework on earth. I built it to make the most common, high-value load testing workflows dramatically easier.
My goal was not “be everything.” My goal was “remove friction where people actually feel it.”
That is why the product is centered around a few practical ideas:
- running tests quickly
- seeing meaningful metrics immediately
- comparing runs without exporting everything into a spreadsheet
- detecting regressions without manual math
- scheduling tests so performance checks happen automatically
- exposing an API so tests can fit into CI/CD
- integrating alerts so performance events leave the dashboard and reach the team
That combination matters because most teams do not fail at performance due to lack of intelligence. They fail because testing is annoying enough that they stop doing it consistently.
What Loadtester.org is
At its core, Loadtester.org is a modern load testing platform for HTTP targets.
You can think of it as a focused platform for testing APIs, websites, landing pages, public endpoints, and backend services under controlled load. It supports both virtual-user-style tests and request-rate-driven tests, and it is designed for fast iteration.
The main things I cared about when building it were clarity, speed, and workflow.
When you land in the dashboard, the first thing you see is not noise. You see an overview of tests, active runs, completed runs, failed runs, aborted runs, projects, and verified domains. That may sound small, but it matters. Good tools reduce uncertainty. A dashboard should orient you instantly. Are tests running now? How many have completed? How many failed? How many were aborted? How many projects are configured? Is domain verification already done? Those answers should not be hidden.
The test list itself is straightforward. You can scan ID, name, target, method, mode, duration, status, date, and tags. That means you are not just firing anonymous tests into the void. You are building a history of performance checks that you can return to, retry, compare, and analyze.
That history is important because good load testing is cumulative. A single run can be useful, but the real value comes from patterns over time.
The workflow I wanted: from one-off test to repeatable system
When I think about a useful load test tool, I do not just think about “can it generate requests.” I think about the whole lifecycle.
A developer notices an endpoint might be slow. They want to test it quickly. They want to tweak concurrency. They want to compare before and after a code change. They want to know whether a new build regressed performance. They want to rerun the same test later. They want to automate it after deployment. They want alerts if something starts failing. They want the whole team to see results.
That is a workflow, not just a benchmark.
So the product is built around that flow.
1. Create a project and verify the domain
Before teams start hammering targets, they need some structure. That is why projects exist. A project groups tests around a domain or application and gives you a way to keep performance work organized.
Domain verification is an important part of this flow. In the UI, the project is tied to a domain and verified through DNS. That is useful because it adds trust and structure around what is being tested. Instead of random, disconnected runs, you get a project-centric setup where the domain is known, the configuration is repeatable, and the results make sense in context.
This is particularly helpful for agencies, multi-project teams, SaaS founders managing several applications, or anyone running recurring tests against a stable target.

2. Configure a test fast
The test creation flow matters a lot. Too many tools make this part painful. In Loadtester.org, the idea is simple: make it easy to define the load profile without removing the important knobs.
In the scheduling interface, you can see the general shape of how tests are configured:
- schedule name
- project
- frequency
- timezone
- HTTP method
- target URL
- mode
- VUs
- duration
- ramp-up
- custom headers in JSON
- optional user-agent
- auto-stop if error rate exceeds a threshold
- fail if p95 latency exceeds a threshold
- assertions/checks
That is the right level of control for many real scenarios. It covers what developers and teams usually care about without turning every test into a mini programming project.
Want to hit a health endpoint every hour? Easy. Want to run a smoke test after deployment? Easy. Want to test an authenticated API with headers? Easy. Want to ramp traffic, enforce a p95 budget, and stop if errors spike? Easy.
That combination is what turns a basic http load tester into something closer to an operational tool.

3. Run in the mode that matches the question
Not every performance question is the same. Sometimes you want to think in terms of users. Sometimes you want to think in terms of request rate.
That is why different modes matter.
A virtual users model is useful when you want to simulate concurrency in a way that feels closer to user activity. A requests-per-second model is useful when you care about raw throughput and predictable load generation.
Supporting both matters because traffic patterns are not all alike. Some systems fall apart with concurrency. Others are fine with concurrency but sensitive to request rate. Some bottlenecks only show up under sustained req/s pressure. Others appear when multiple user sessions overlap and resources contend.
A good http load test setup should not force you into one mental model.
4. See metrics that actually matter
A lot of dashboards drown users in numbers and still fail to answer the obvious question: “Did the system behave well?”
I wanted the comparison and results views to focus on metrics that developers actually use:
- average latency
- p95 latency
- average throughput
- total requests
- error rate
- data sent
- data received
These metrics tell a story.
Average latency is helpful, but p95 latency is often closer to the user experience you are really shipping. Throughput shows how much work the system handled. Error rate tells you whether the system stayed stable under load. Total requests gives context to the sample size. Data sent and received help interpret the scale and shape of traffic.
These are the kinds of numbers that turn a test result into an engineering decision.


5. Compare runs without friction
This is one of the most important parts of the product.
Most performance problems are not discovered because someone stares at a single run and suddenly achieves enlightenment. They are discovered because someone compares one run to another.
That is why the compare view exists and why I think it is one of the most useful features in the app.
In the comparison screen, you can select two runs and immediately see the differences across the key metrics. You can tell whether the new run got slower or faster, whether throughput improved, whether p95 improved, whether request volume changed, whether error rates differ, and whether the second run was aborted and therefore only partial data is available.
That “partial data only” warning matters too. Good tooling should tell the truth about the quality of the data. If one run was aborted, the platform should say so clearly and still let you learn from the partial results.
This is the kind of feature that makes Loadtester.org feel like more than a one-shot benchmark app. It becomes a performance workflow tool.


6. Detect regressions before users do
Regression detection is not a luxury feature. It is one of the highest-value features a load testing product can have.
Many teams do not need a thousand advanced knobs. They need a reliable way to answer one simple question: “Did this change make performance worse?”
That is why regression awareness is baked into the product. In the UI, tests can be marked with a regression status, and integrations can notify teams when regressions are detected. That changes behavior in a good way. Instead of load testing being something you do reactively when users complain, it becomes something that can protect releases proactively.
A lot of software quality practices matured because they became automatic. Unit tests became powerful when they ran in CI, not only when someone remembered to run them manually. Performance checks become far more useful when regressions are surfaced automatically instead of living as tribal knowledge.

7. Schedule tests so performance becomes a habit
I love ad hoc testing, but I do not trust ad hoc testing.
People get busy. Launches happen. Deadlines compress. Teams promise they will “test again later.” Later rarely arrives.
That is why scheduled tests are so important.
In Loadtester.org, schedules let you define recurring tests with a project, frequency, timezone, load profile, headers, thresholds, and checks. That means performance monitoring can move from “remember to test” to “the test already ran.”
This opens up several useful patterns:
- hourly smoke tests for critical endpoints
- daily regression checks against key APIs
- scheduled landing page tests before or during campaigns
- recurring checks after infrastructure changes
- stability monitoring for public endpoints
- routine validation of p95 budgets
This is where a product starts becoming a load checker in the practical sense of the term. It is no longer just a tool you visit when something feels wrong. It becomes part of the normal rhythm of keeping a system healthy.

8. Connect results to the rest of the stack
A dashboard is not enough. Teams live in other systems too.
That is why integrations and API access matter.
In the integrations section, you can see support for Slack, GitHub Actions, GitLab CI, and email. Slack notifications can be enabled for test starts, completions, failures, and regression detections. That makes a big difference. Performance events should not stay trapped inside the tool. The people responsible for the system need to see them where they already work.
The API token section points to the same philosophy from another angle. If a team wants to trigger tests from a pipeline, fetch results, export metrics, retry runs, or check analytics programmatically, they should be able to do that cleanly.
The exposed endpoints visible in the UI are exactly the kinds of things teams need:
- list all tests
- create and run a test
- get a result and full summary
- export metrics in CSV or JSON
- fetch analytics like status codes and latency percentiles
- retry a test
- check for performance regression
That is a solid foundation for CI/CD and operational workflows.
A real load testing platform should not just let people click buttons. It should let them build process.
The philosophy behind the product: simple, not simplistic
One of the hardest product design problems is the difference between making something simple and making something simplistic.
Simplistic means removing too much. It means a tool becomes easy only because it no longer helps with real work. Simple means preserving what matters while removing what does not.
That is the balance I was aiming for with Loadtester.org.
For example, it is simple to create a test. But the test model is not stripped down to the point of uselessness. You still have the knobs that matter: method, target, mode, duration, ramp-up, headers, user-agent, thresholds, assertions.
It is simple to compare runs. But the comparison is not vague. It gives actual metrics and deltas.
It is simple to schedule recurring tests. But schedules are not toy reminders. They include timezone, thresholds, checks, and load profile configuration.
It is simple to automate through the API. But the API surface still reflects real workflows like export, retry, analytics, and regression checking.
That balance matters because the people searching for a loadtest tool are often not looking for infinite flexibility. They are looking for confidence. They want something that covers the real use cases without consuming their week.
Who Loadtester.org is for
I think a lot of products in this category make the mistake of trying to talk only to “performance engineers.” That narrows the market too much and misses the actual demand.
The people who need load testing are much broader than that.
Founders and solo builders
If you are a solo founder shipping a SaaS product, you probably do not want a massive performance testing stack. You want to know if your product can survive growth. You want to test key endpoints before launches. You want to run a quick check after infrastructure changes. You want the shortest path from “I should test this” to “I have an answer.”
That is exactly the kind of user I had in mind.
Small engineering teams
Small teams need leverage. They cannot afford long setup cycles for every operational check. A tool that lets them create, rerun, compare, and automate tests quickly is valuable because it amplifies a small team’s ability to maintain quality.
Agencies and consultants
Agencies often manage multiple websites, client projects, and public endpoints. They need organization through projects, recurring checks, and reporting. Domain verification, project grouping, scheduled tests, and exports all matter in that environment.
DevOps and platform-minded teams
For teams that care deeply about release safety, regression detection and API-driven workflows are especially useful. Triggering load tests in CI/CD, exporting data, and sending alerts to Slack are practical features, not marketing fluff.
Teams looking for a loader.io alternative
A lot of people are not searching from scratch. They already know one tool and are wondering if there is a better fit. That is why the phrase loader.io alternative appears in search demand. Those searchers usually want a cleaner workflow, a better UI, more automation, clearer comparisons, or a more focused product experience.
That is a real audience, and I built Loadtester.org with them in mind too.
The feature set in practice
Let me go deeper into the product itself, because features only matter when they map to real use.
Dashboard and test history
The overview screen is intentionally operational. Total tests, active now, completed, failed, aborted, projects, verified domains. That helps the platform feel alive and immediately useful. You know what is happening now, what happened recently, and how the account is set up.
The test history table is where repeated use starts to pay off. It stores the lineage of your testing activity. You can see names, targets, modes, durations, status states, tags, and actions. This matters because load testing is iterative. You are not just collecting one datapoint. You are building context.
Projects and verified domains
Projects help users stay organized and reduce ambiguity. The ability to attach a domain and verify it through DNS creates a more trustworthy model for recurring tests. It signals that the system being tested is intentionally configured, not random.
Scheduling and policy-style thresholds
The scheduling flow is more than convenience. It is where performance checks become policy. A schedule is not just “run this later.” It is “run this repeatedly under these conditions, against this target, with these headers, and treat these thresholds as meaningful.”
That is how performance work matures inside teams. It stops being anecdotal and starts being procedural.
Compare view
The compare view might be my favorite part of the product because it captures how engineers actually reason. We almost never care only about an absolute number. We care about what changed.
The visual side-by-side layout lets users compare two runs without mental gymnastics. That saves time, but more importantly, it prevents subtle issues from being missed. A 20 percent latency regression is obvious when the numbers are next to each other. It is much less obvious when the older result is buried in some export from last week.
API tokens and developer workflows
I strongly believe a product like this needs an API. If the UI is the only path, the platform becomes a destination instead of a component in the engineering workflow. Tokens and endpoints make it possible to integrate testing into deployment processes, monitoring pipelines, scripts, internal dashboards, or release gates.

Integrations
Slack, GitHub Actions, GitLab CI, and email support the same mission: move load testing from isolated activity to connected workflow. A regression alert in Slack changes team behavior. A test in GitHub Actions changes deployment confidence. Email notices help stakeholders stay informed without logging into the tool.

Pricing tiers with a practical on-ramp
The subscription model shown in the app reflects another product decision I care about: lower the barrier to entry without making the free tier meaningless.
The free plan supports a small but real amount of usage, including 10 virtual users, 50 requests per second, 1 minute max duration, 1 concurrent test, live charts, and PDF/CSV export. That is enough to let people understand the product, validate a basic workflow, and get real value.
The premium plan expands this substantially with up to 10,000 virtual users, 10,000 req/s, longer max duration, two concurrent tests, parallel scenarios, API tokens and CI/CD, Slack and email alerts, regression notifications, scheduled tests, richer exports, and priority support.
That kind of structure makes sense to me because it mirrors user maturity. Someone starts small, proves value, then scales usage as the need grows.
Why not just use scripts?
This is the objection that always comes up in technical communities.
And it is a fair question.
Yes, you can script load tests. Yes, raw scripting can be powerful. Yes, many teams already have some custom setup.
But “can be done in scripts” is not the same thing as “is a good product experience.”
You can also write your own analytics dashboards, deploy your own alerting stack, stitch together exports, and build your own comparison logic. The question is not whether something is theoretically possible. The question is whether most teams should spend their time doing that instead of using a focused tool.
In practice, scripting often breaks down in a few ways:
- the tests become hard to maintain
- only one or two people understand them
- result comparison becomes manual
- scheduling is fragmented
- alerts are bolted on later
- nobody runs the tests consistently
- product and non-specialist stakeholders cannot use the workflow
- the whole thing becomes yet another internal system nobody wants to own
A good load testing platform should solve those problems by making the process usable, visible, and repeatable.
What makes a good load checker?
People search for the phrase load checker because they want a sanity check, not an academic paper.
A good load checker should answer a handful of practical questions fast:
- Did the endpoint stay up?
- How fast was it under load?
- How bad did p95 get?
- What error rate appeared?
- How much throughput did we sustain?
- How does this compare to the last run?
- Should I be worried?
That is the spirit I wanted to capture.
A load checker does not need to be shallow. It just needs to be decisive. It should reduce uncertainty quickly and tell users what changed.
The SEO angle and the actual user intent behind these searches
One thing I find interesting is how honest search queries are in this category.
When someone searches for “loadtester,” they are often looking for the brand directly. When they search for “http load tester,” they want a tool that can hit URLs and measure behavior. When they search for “http load test,” they want a workflow or method. When they search for “application load testing,” they are thinking at the system level. When they search for “free load testing tools,” they are still exploring and comparing. When they search for “loader.io alternative,” they already know a competitor and want a better fit. When they search for “loadtest tool” or “loadtest tools,” they are evaluating options. When they search for “load testing platform,” they are probably ready for something more comprehensive than a one-off utility.
That search intent is useful because it maps nicely to how the product is positioned.
Loadtester.org can serve beginners because the interface is approachable. It can serve growing teams because the workflow is structured. It can serve more advanced users because it includes scheduling, comparisons, API access, exports, thresholds, and integrations.
In other words, it is not trying to win by being the loudest. It is trying to win by fitting the actual job users are trying to get done.
A practical example: how I would use Loadtester.org before a release
Imagine I am preparing a release for a production API.
First, I would set up the project and verify the domain. Then I would create a baseline test against the main critical endpoint using a realistic method and headers. I would run one version in virtual users mode to see how concurrency behaves. Then I would run another in req/s mode to measure capacity differently. I would inspect average latency, p95 latency, throughput, and error rate. After making the release candidate changes, I would rerun the same test profiles. Then I would open the compare view and inspect the deltas.
If latency increased, I would know. If p95 got uglier, I would know. If throughput fell off, I would know. If errors appeared, I would know. If a run had to be aborted, the product would say so clearly.
After that, I would create a scheduled smoke test for the endpoint, attach a p95 threshold, and set regression notifications to Slack. Then I would make the test part of the deployment workflow using the API.
That is the kind of end-to-end workflow I wanted the platform to support. Not just a benchmark. A habit.
Why UI still matters in developer tools
There is a persistent myth that developers do not care about UX as long as the tool is powerful.
I think that is wrong.
Developers care deeply about UX. They just define it differently. For technical tools, good UX means speed, clarity, low friction, fast pattern recognition, honest feedback, and interfaces that respect the user’s time.
That is one reason I gave a lot of attention to the visual design and layout. The dashboard uses a dark UI with high-contrast information blocks, clear status labels, simple comparison cards, and operational focus. That is not cosmetic. It supports fast reading. When you are checking performance, you should not have to decode the interface.
The compare screen in particular benefits from this. Side-by-side cards with obvious changes make it easier to spot what matters. The scheduling modal is also intentionally direct. You do not want to hunt through hidden tabs just to set a threshold or add headers.
Developer tools do not need to be ugly to be serious.
Where I think the product can go
Every product has a current version and a larger vision.
For Loadtester.org, the current version already covers the workflows I think most users need first: test creation, history, comparison, regression awareness, schedules, API access, notifications, and project/domain organization.
But the broader vision is about making performance validation feel as normal as running unit tests or checking logs.
That could mean deeper reporting. It could mean richer assertions. It could mean more advanced scenarios. It could mean tighter CI/CD experiences. It could mean better team collaboration around performance baselines. It could mean broader integrations. It could mean stronger reporting for agencies and client work. It could mean more analysis around trends, not just single-run comparisons.
The key is that every new capability should still respect the original product principle: simple, not simplistic.
Building a product in a crowded category
I actually think crowded categories are underrated places to build.
People look at a market with existing players and assume there is no room. But if users keep searching for alternatives, there is clearly room. Search demand itself is proof that many people are still unsatisfied. Nobody searches for a loader.io alternative if they are perfectly happy. Nobody searches for load testing platform if a basic script already solved their problem. Nobody searches for free load testing tools unless they are still trying to find the right fit.
A crowded category with obvious pain points is often better than a totally empty category with no user demand.
The trick is not to be generic. The trick is to be specific about what you improve.
For me, the improvements were:
- faster setup
- clearer dashboarding
- easy comparisons
- visible regression signals
- recurring schedules
- practical thresholds
- real integrations
- usable API surface
- a product experience that feels modern
That is enough differentiation to matter.
FAQ: common questions about load testing and Loadtester.org
What is an HTTP load tester?
An HTTP load tester is a tool that sends traffic to a URL or API endpoint so you can measure how the system behaves under load. The point is not just to see whether the endpoint responds, but to understand latency, throughput, stability, and error behavior as traffic increases.
How do you run an HTTP load test properly?
A good HTTP load test starts with the right target, the right traffic model, and the right metrics. Pick a meaningful endpoint, decide whether you want to test concurrency or request rate, define the duration and ramp-up, include any required headers, and then analyze average latency, p95 latency, throughput, and error rate. The test becomes much more useful when you compare the result against a previous run.
What is the difference between a basic loadtest tool and a full load testing platform?
A basic loadtest tool usually helps you generate traffic and inspect raw results. A full load testing platform adds workflow around that: projects, history, comparisons, regression checks, scheduling, exports, API integration, and alerts. That extra layer is what makes load testing repeatable instead of occasional.
Are there free load testing tools?
Yes. There are several free load testing tools available, and they can be a good starting point for basic benchmarks. The challenge is that many free tools stop being enough once you want recurring tests, regression detection, team visibility, CI/CD integration, or a smoother operational workflow. That is where a platform like Loadtester.org becomes more useful.
Is Loadtester.org a loader.io alternative?
Yes, that is a fair way to think about it. If you are looking for a loader.io alternative because you want a cleaner workflow, better comparison features, scheduling, regression visibility, API-driven automation, or a more modern UI, Loadtester.org is built for that kind of user.
What makes a good load checker?
A good load checker should give fast, trustworthy answers. It should tell you whether the target stayed healthy, how latency changed under load, what throughput was sustained, what error rate appeared, and whether the latest run is better or worse than the last one. The best load checkers reduce uncertainty quickly.
What is application load testing?
Application load testing is the practice of testing how an application behaves under expected or elevated traffic. It usually covers APIs, public web pages, internal services, or full backend systems. The goal is to understand capacity, bottlenecks, and reliability before users run into problems.
When should I run load tests?
You should run load tests before major releases, after infrastructure changes, when optimizing performance, before campaigns or traffic spikes, and on a recurring schedule for critical endpoints. The teams that get the most value from load testing are the teams that make it habitual rather than occasional.
Why compare runs instead of looking at one result in isolation?
Because performance work is usually about change. A single run can tell you whether the system survived. A comparison tells you whether the system improved or regressed. That is a much more actionable insight, especially in release workflows.
Why do p95 latency and regression alerts matter so much?
Average latency can hide bad experiences. P95 surfaces how slow the tail gets, which is often closer to what real users feel. Regression alerts matter because performance rarely collapses all at once. It often gets worse gradually. Alerts help you catch that early.
Final thoughts
I built Loadtester.org because I wanted load testing to feel normal again.
Not intimidating. Not bloated. Not trapped in scripts unless you want it there. Not hidden behind a steep setup tax.
I wanted a platform where you can create a project, verify a domain, run a test, compare two runs, detect a regression, schedule recurring checks, plug it into CI/CD, and get notified when something changes. That is the kind of workflow that helps teams actually use performance testing instead of merely admiring the idea of it.
If you have ever searched for a better http load tester, a more practical load checking workflow, a simple entry into application load testing, a modern load testing platform, or a serious loader.io alternative, that is the exact problem Loadtester.org is trying to solve.
Performance should not be guesswork. Load testing should not be painful. And the tools around it should help teams build confidence, not complexity.
That is the whole point of Loadtester.org.
메타데이터
- post_id
- ad14461b44bf
- slug
- how-to-perform-api-load-testing-without-complex-setup-ad14461b44bf
- url
- https://medium.com/@cloudnativehr/how-to-perform-api-load-testing-without-complex-setup-ad14461b44bf
- canonical_url
- https://medium.com/@cloudnativehr/how-to-perform-api-load-testing-without-complex-setup-ad14461b44bf
- author_url
- https://medium.com/@cloudnativehr
- status
- ok
- fetched_at
- 2026-07-30 10:03:37