The Calm Before the Storm: Tracing a Full Attack Chain in Splunk
The Setup
The Calm Before the Storm: Tracing a Full Attack Chain in Splunk
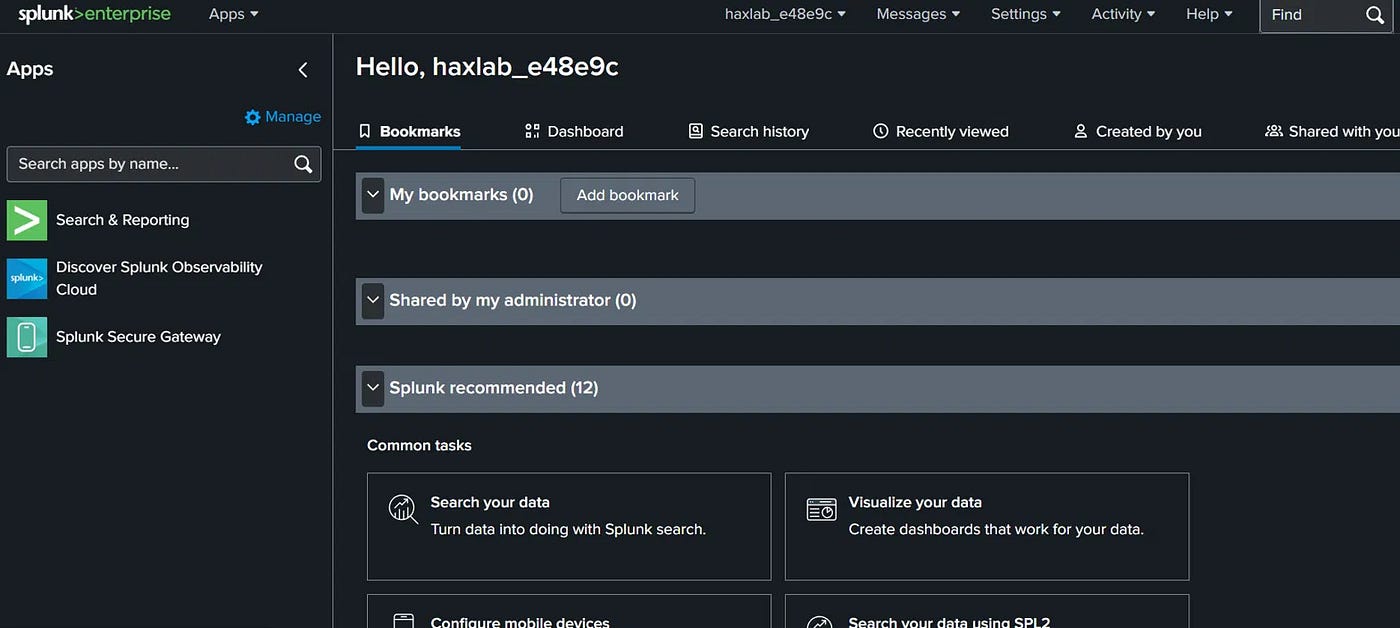
The Setup
A few days ago I signed up for a 3-hour SOC Analyst L2 blue-team CTF built entirely around Splunk. There was one small problem: I had never actually used Splunk before. Not once.
So going in, my plan wasn’t “solve every question perfectly.” It was “learn SPL live, under time pressure, on a real-shaped incident, and see how far I get.” I think that’s actually a more honest way to test SOC skills than a lab environment you’ve already memorized because that’s what a real on-call shift feels like too.
The scenario: Vertex Financial, a fictional company, had flagged unusual overnight activity across several endpoints and servers. No ransom note. No encrypted files. Just a quiet, uneasy feeling that something had already gotten in and my job was to find it before it detonated.
Three log sources were provided:
- wec01_win_security: Windows Security event log (logons, process creation, privilege use)
- wec01_powershell_events: PowerShell script block logging
- fileserver_audit: SMB file share access activity
No prior indicators, no IOC list, no hints beyond “something happened overnight.” Just raw logs and a time range set to All Time.
Module 1: The Calm Before the Storm
Finding the foothold
The first task was to find a PowerShell process launched with an encoded/obfuscated command, outside business hours (08:00–19:00).
My first instinct was to search the PowerShell script block index directly for -enc. That returned nothing. It turned out the script block log in this environment only captured benign admin activity Get-ADUser, Get-Service, routine housekeeping commands. The actual encoded execution wasn't logged there at all.
The real evidence was sitting in the Windows Security log, under EventCode = 4688 (process creation), in the Command_Line field:
index=wec01_win_security EventCode=4688
| stats count by Command_Line
| sort -count
Running stats count by Command_Line and sorting by frequency turned out to be the single most useful move of the whole module, legitimate business software (Excel, Teams, Chrome, Outlook) showed up dozens of times each, while genuinely suspicious commands appeared exactly once. That count-based outlier pattern is something I'll be using in every SOC investigation from now on: normal is repetitive, malicious is often a singleton.
Sitting right at the bottom of that low-frequency tail:
powershell.exe -nop -w hidden -enc SQBFAFgAIAAoAE4AZQB3AC0ATwBiAGoAZQBjAHQA...-nop (no profile), -w hidden (hidden window), -enc (base64-encoded command) — a textbook obfuscated PowerShell launch. Pulling the full event gave me the host and the account behind it:
- Host: WKS-VF-021.vertexfin.local
- User: VERTEXFIN\kevin.oshea
That was the initial foothold.
Module 2: Trust Betrayed
With an entry point identified, the next module asked me to trace what the attacker did in the first hour after getting in: enumeration, privilege escalation, and credential theft.
Recon: mapping the terrain
Back in the PowerShell script block log (the one that did capture the “boring” commands), a short list of recon activity stood out once I filtered out routine admin noise:
net group "Domain Admins" /domain
net localgroup administrators
net view \\SRV-VF-03 /all
net use \\SRV-VF-07\C$
nltest /domain_trusts
whoami /all
Get-ADComputer -Filter * | Select Name
The question asked specifically for enumeration of the highest-privilege domain-wide group which ruled out net localgroup administrators (local, not domain) and pointed to:
net group "Domain Admins" /domainexecuted from WKS-VF-021.vertexfin.local by kevin.oshea at 02:22:05; 25 minutes before the next, much more serious step.
Escalation: LSASS memory dumping
The Command_Line field also revealed this, executed from the same host and account:
rundll32.exe C:\Windows\System32\comsvcs.dll, MiniDump 624 C:\Windows\Temp\lsass.dmp fullThis is a well-known living-off-the-land technique: comsvcs.dll's MiniDump export can be invoked via rundll32 to dump the memory of any running process in this case PID 624, which is almost universally lsass.exe, the process that holds cached credentials for every account that has logged onto that machine.
To figure out whose credentials were exposed, I checked who had logged onto that host before the dump occurred:
index=wec01_win_security EventCode=4624 ComputerName="WKS-VF-021.vertexfin.local"
| table _time, Account_Name, ComputerName
| sort _time
The timeline told the story cleanly:
2026–07–05 14:22:40 james.walsh (legitimate logon) 2026–07–06 02:14:10 kevin.oshea (attacker foothold) 2026–07–06 02:47:03 LSASS dumped 2026–07–06 03:05:12 james.walsh (again but this time it’s the attacker)
james.walsh had logged in the previous afternoon and left credentials cached in memory. The attacker dumped LSASS, extracted them, and by 03:05 was authenticating as james.walsh themselves, a privilege jump from a low-value foothold account straight to a more trusted identity.
Lateral movement
Using the compromised james.walsh account, I checked how many distinct hosts it touched:
index=wec01_win_security Account_Name="james.walsh" EventCode=4624 Logon_Type=3
| stats dc(ComputerName) as distinct_hosts, values(ComputerName) as hosts
The key detail here was filtering to Logon_Type = 3, network logons specifically, rather than counting every host the account had ever touched (which included months of ordinary day-to-day access as part of the account owner's normal job). Once filtered correctly, the account showed 4 distinct hosts touched during the actual intrusion window, including a hop to the domain controller, a serious escalation from a single compromised workstation.
Module 3: The Final Countdown
The final module picked up where recovery sabotage begins, the phase that happens right before ransomware detonates, when attackers try to remove your ability to recover.
Killing the recovery path
Back in the Command_Line field, two entries jumped out immediately:
vssadmin.exe list shadows
vssadmin.exe delete shadows /all /quiet
wbadmin.exe delete catalog -quiet
list shadows was recon (checking what shadow copies existed), but the actual destructive action deleting every shadow copy silentlywas:
vssadmin.exe delete shadows /all /quietThis is one of the most reliable pre-ransomware indicators there is. Legitimate admins essentially never run this exact command in production; it exists almost exclusively to prevent victims from rolling back to a shadow copy after encryption.
Finding the staging ground
Last question: which host showed abnormal file access, the staging point before encryption. A simple count across the file server audit log settled it fast:
index=fileserver_audit
| stats count by ComputerName
| sort -count
SRV-VF-03.vertexfin.local 421
SRV-VF-07.vertexfin.local 119421 versus 119, roughly 3.5x the volume on the second server, with no legitimate business reason for a single user or process to touch that many files in the timeframe. That’s the staging ground: the attacker pulling/touching data ahead of encryption that, in this scenario, never got the chance to detonate.
The Full Chain, End to End
Putting it all together, the intrusion looked like this:
- Initial access: obfuscated PowerShell execution on WKS-VF-021 via kevin.oshea
- Recon: Domain Admins enumeration, AD computer enumeration, DC connectivity probing
- Credential theft: LSASS memory dump exposing james.walsh's cached credentials
- Lateral movement: 4 hosts touched via network logons, including the domain controller
- Anti-recovery: shadow copy deletion via vssadmin
- Staging: mass file access spike on SRV-VF-03, the calm right before the storm that was caught in time
What I Actually Learned
A few things stuck with me more than the specific answers did:
- Frequency is a detection signal by itself. stats count by <field> sorted descending will show you the outliers before you've even formed a hypothesis. Malicious activity is disproportionately rare compared to the repetitive noise of daily business tools.
- The interesting evidence isn’t always where you expect it. I assumed encoded PowerShell would show up in the PowerShell log. It didn’t, it was in the process creation events instead. Don’t get anchored to one log source; pivot across all of them.
- A pivot value is your map. Once you find one suspicious host, user, or IP, searching for that exact value across every index (index=*"value") shows you every place it left a trace, that's how an isolated finding turns into a full attack chain.
- Filtering matters as much as searching. The lateral movement question genuinely depended on filtering to Logon_Type=3, without that, a single compromised account's legitimate day-to-day access looked identical to attacker movement.
- You don’t need to already know a tool to think like an analyst in it. The SOC workflow (enumerate, correlate, pivot, verify) transfers regardless of which SIEM is in front of you. Splunk was new to me. The methodology wasn’t.
Three hours, one unfamiliar tool, and one full attack chain traced end to end.
메타데이터
- post_id
- ad8b25c2b77f
- slug
- the-calm-before-the-storm-tracing-a-full-attack-chain-in-splunk-ad8b25c2b77f
- url
- https://medium.com/@zainabqureshi620/the-calm-before-the-storm-tracing-a-full-attack-chain-in-splunk-ad8b25c2b77f
- canonical_url
- https://medium.com/@zainabqureshi620/the-calm-before-the-storm-tracing-a-full-attack-chain-in-splunk-ad8b25c2b77f
- author_url
- https://medium.com/@zainabqureshi620
- status
- ok
- fetched_at
- 2026-07-14 09:24:11