Exploring Citi Bike Demand and Designing a Machine Learning Driven Experiment for Smarter…
Urban mobility systems capture human behavior at scale. Every commute, every trip, and every movement creates patterns hidden within data…
Exploring Citi Bike Demand and Designing a Machine Learning Driven Experiment for Smarter Rebalancing

Urban mobility systems capture human behavior at scale. Every commute, every trip, and every movement creates patterns hidden within data. As a Data Scientist, I wanted to explore whether these patterns could be used not just to understand the system, but to design smarter operational strategies.
In this project, I explored Citi Bike trip data to understand how demand evolves across time and geography, and how machine learning and statistical experimentation can be used to design and evaluate improved rebalancing strategies.
This exploration grew into a complete machine learning and experimentation pipeline, combining forecasting, clustering, anomaly detection, and Bayesian experiment design.
Understanding the Rebalancing Problem
Bike sharing systems constantly face imbalance. Some stations run out of bikes during peak commute hours, while others accumulate excess bikes. This creates two key operational challenges:
- Users cannot find bikes when needed
- Bikes remain unused at oversupplied stations
The goal of this exploration was to determine whether demand patterns could be predicted accurately enough to support proactive decision making.
Exploring Demand Patterns Across Time
I began by aggregating trip data into hourly demand per station and exploring temporal patterns. The results revealed clear behavioral structure:
- Morning demand peaks during commute hours
- Evening demand peaks during return commute
- Overnight demand remains low
- Weekends show different usage patterns compared to weekdays
These findings confirmed that bike demand follows predictable human routines.
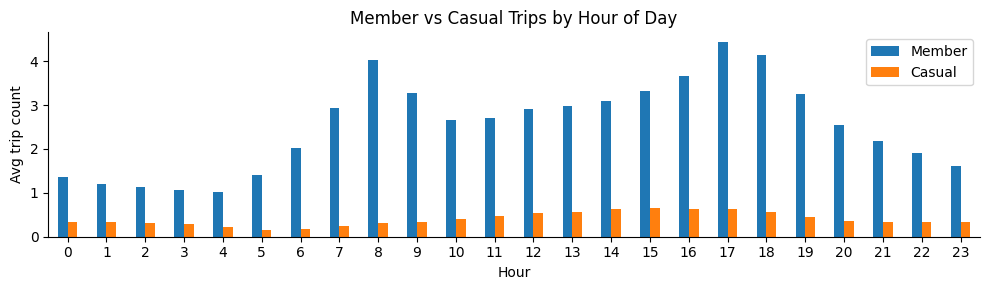
Hourly demand reveals strong commute driven patterns and consistent daily seasonality
Discovering Station Behavior Using Clustering
Not all stations behave the same way. Some serve commuters, while others serve recreational or tourist activity. To understand this structure, I applied clustering using engineered demand features. This revealed distinct behavioral groups of stations based on their demand patterns. This segmentation is important because stations influence each other geographically, and treating all stations as identical would ignore important system structure.
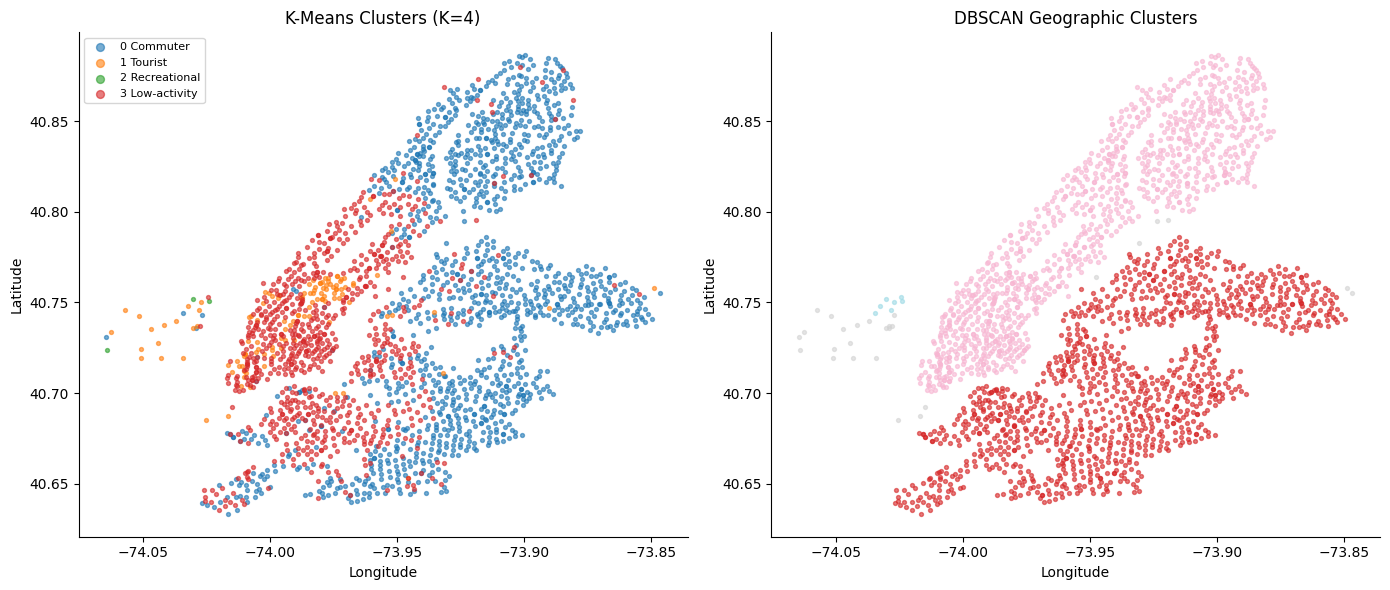
Clustering reveals distinct station types with different behavioral patterns across the city.
Forecasting Demand Using Machine Learning
Next, I explored whether demand could be predicted accurately. I compared three forecasting approaches:
- Prophet
- SARIMA
- XGBoost
XGBoost achieved the strongest performance due to its ability to capture nonlinear relationships using engineered lag and calendar features.
This demonstrated that carefully engineered features combined with machine learning can produce accurate demand forecasts.
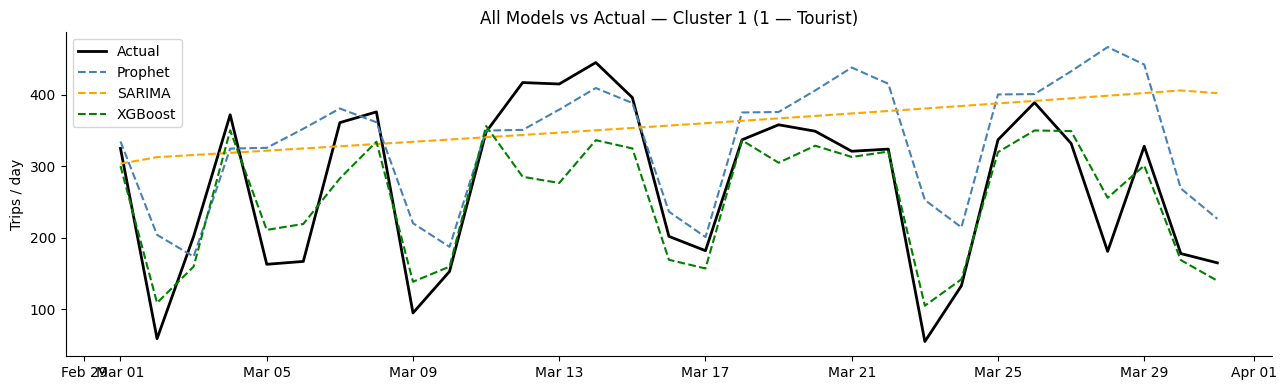
Machine learning model accurately captures demand trends and seasonal patterns.
Detecting Anomalies to Improve Reliability
Real world data contains anomalies caused by unusual events, disruptions, or system irregularities. These anomalies can distort model performance and experiment results.
To address this, I implemented multiple anomaly detection methods and used consensus detection to identify reliable anomalies. This ensured that downstream modeling and experimentation were based on reliable data.
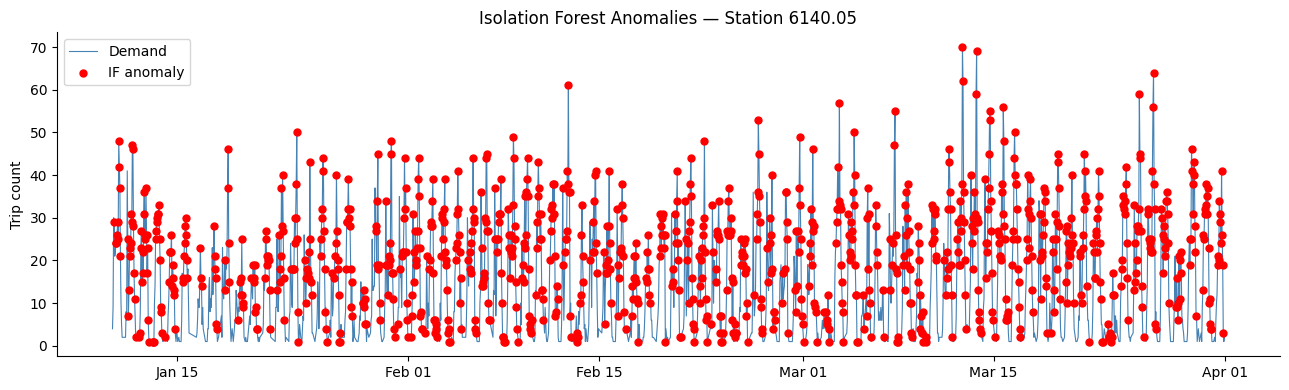
Anomaly detection identifies unusual demand patterns that could distort analysis.
Designing a Statistically Rigorous Experiment
Forecasting demand enables proactive planning, but it is essential to evaluate whether an improved strategy actually leads to better outcomes. To explore this, I designed a full experiment framework including:
- Power analysis
- Frequentist statistical testing
- Sequential testing
- Bayesian modeling
Bayesian modeling provided probabilistic estimates of improvement, offering deeper insight into potential operational gains.
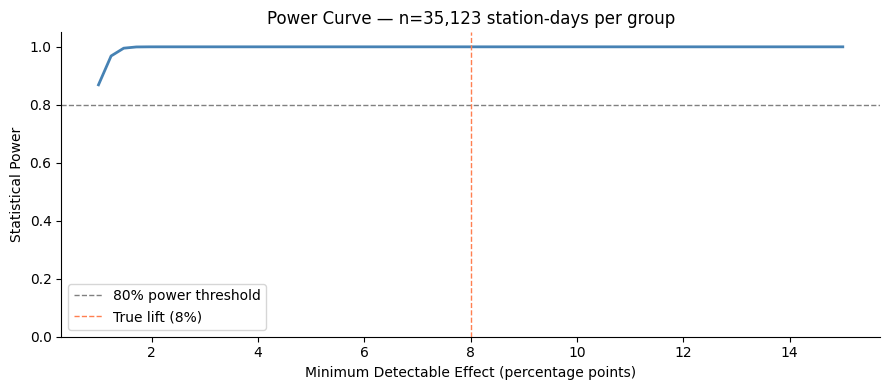
Power curve demonstrating that the experiment has sufficient statistical power (>80%) to detect the expected 8% improvement in performance.
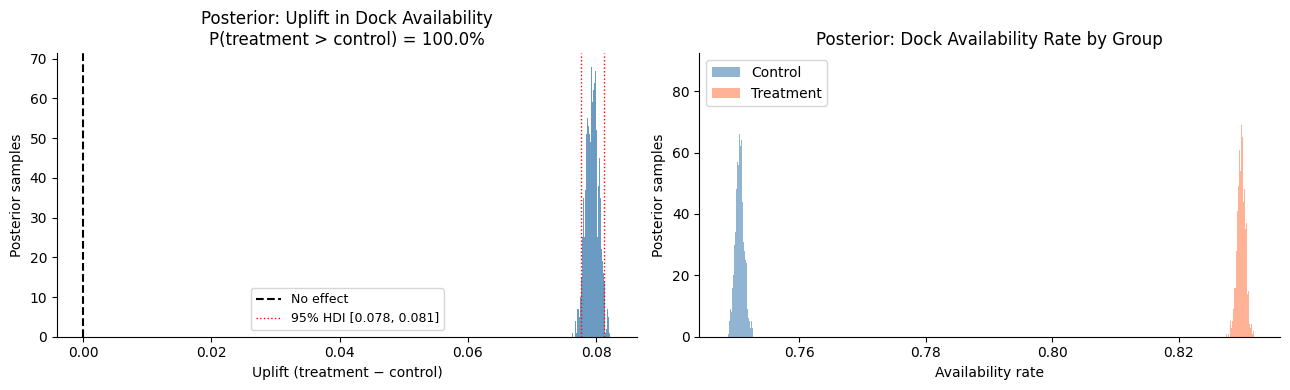
Bayesian analysis provides probabilistic insight into treatment effectiveness.
Exploring the Geographic Structure of Demand
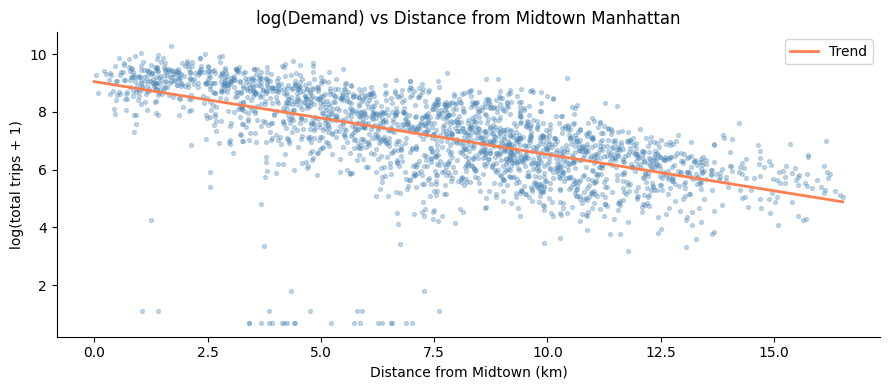
Demand patterns are strongly influenced by geography. Geospatial visualization revealed demand hotspots and spatial relationships between stations. These insights reinforce the importance of geographic awareness in modeling and experimentation.
Heatmap visualization highlights geographic demand concentration.
From Analysis to Action: What This Enables
This project was not just about predicting demand, instead, it was about understanding whether data science can enable smarter operational decision-making in real systems. Through this exploration, several key conclusions emerged.
First, demand in bike sharing systems is highly predictable when modeled correctly. Machine learning models, especially XGBoost with engineered temporal and behavioral features, were able to capture recurring demand patterns with strong accuracy. This means demand forecasting can be reliably used to anticipate shortages and surpluses before they occur.
Second, stations behave differently and must be treated differently. Clustering revealed distinct station types like commuter-driven, residential, and recreational and each with unique demand signatures. This demonstrates that uniform system-wide strategies are inefficient, and targeted, station-specific interventions are more effective.
Third, experimentation is essential to validate operational improvements. The statistical experiment framework demonstrated how proposed rebalancing strategies can be evaluated rigorously, ensuring that operational changes lead to measurable performance improvements rather than relying on intuition alone.
Most importantly, this project demonstrates how data science can move from passive analysis to active system optimization. Instead of reacting to shortages after they occur, operators can:
- Predict where shortages will happen
- Proactively rebalance bikes before failure occurs
- Quantify the impact of operational interventions
- Continuously improve strategies using experimental feedback
This transforms system management from reactive to predictive and from heuristic-driven to data-driven.
More broadly, this project reflects a generalizable principle: the true value of data science lies not in building models, but in enabling better decisions. Forecasting, anomaly detection, clustering, and experimentation together form a complete decision pipeline that can improve efficiency, reliability, and user experience in real-world systems.
Why This Matters
This exploration demonstrates how data science can move beyond prediction and support real world decision making. By combining forecasting, clustering, anomaly detection, and experimentation, it is possible to design smarter operational strategies that improve efficiency and user experience. These same principles apply broadly across industries including transportation, logistics, healthcare, and finance.
Project Repository
Full code and implementation available here: https://github.com/aditi-1996/demand-forecasting-experiment-design
Image and reproducibility note All visualizations, models, and experimental analyses presented in this article were developed by the author using publicly available Citi Bike trip data and custom machine learning pipelines implemented in Python. The full code and reproducible workflow are available in the linked GitHub repository.
메타데이터
- post_id
- ae87bb55da31
- slug
- exploring-citi-bike-demand-and-designing-a-machine-learning-driven-experiment-for-smarter-ae87bb55da31
- url
- https://medium.com/@bhardwajaditi203/exploring-citi-bike-demand-and-designing-a-machine-learning-driven-experiment-for-smarter-ae87bb55da31
- canonical_url
- https://medium.com/@bhardwajaditi203/exploring-citi-bike-demand-and-designing-a-machine-learning-driven-experiment-for-smarter-ae87bb55da31
- author_url
- https://medium.com/@bhardwajaditi203
- status
- ok
- fetched_at
- 2026-06-09 14:34:10