Understanding Odds Ratio, Relative risk and Hit Ratio
An odd ratio(OR) is a statistical measure of association between two events, for example, exposure and outcome. OR plays a crucial role in…
Understanding Odds Ratio, Relative risk and Hit Ratio
An odd ratio(OR) is a statistical measure of association between two events, for example, exposure and outcome. OR plays a crucial role in the logistic model. This performance metric is commonly used in epidemiology, case-control studies, and clinical trials.
Suppose we are computing the association between a new drug(exposure) and recovery from a disease(outcome). The data we obtain is as follows:
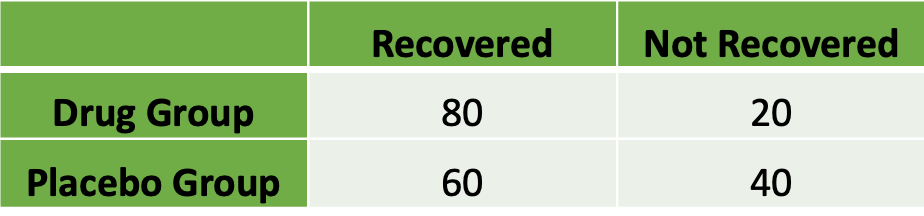
Table created by the author
Now, we would like to compute the odd ratio and get some insights from the number.
According to the definition it is the ratio of the odds of an event occurring in one group(here Drug Group) to the odds of it occurring in another group(Placebo Group). Hence, by definition,
Odds is Drug Group = 80/20 = 4
Odds is Placebo group = 60/40 = 1.5
and , OR = 4/1.5 = 2.67
Patients receiving the drug have 2.67 times higher odds of recovery compared to those receiving the placebo.
if OR = 1, no association exists between exposure(Recovered) and outcome(Not recovered).
OR > 1 implies a positive association; exposure may increase the odds of the outcome.
OR < 1 implies a negative association; exposure may decrease the odds of the outcome.
ORs are used to interpret the coefficients in logistic regression models. The exponentiated coefficients represent the change in odds for a one-unit change in the predictor variable.
Hit ratio
However, a statistical measure called hit ratio is relevant if we want to describe or compare the absolute success rates (proportions) in the two groups(Drug Group and Placebo group). In the above context,
Hit ratio for Drug Group = 80/(20+80) = 0.8(80%)
Odds is Placebo group = 60/(60+40) = 0.6 (60%)
The hit ratios for the Drug group and Placebo group represent the proportion of “recovered” cases in each group. This is an intuitive way to summarize the success rates without needing the concept of odds or odds ratios.
Risk ratio
The risk ratio, also known as the relative risk (RR), is a measure of the likelihood of an event occurring in one group compared to another. It is commonly used in cohort studies or clinical trials to quantify the strength of the association between an exposure (e.g., treatment) and an outcome (e.g., recovery).
In the above case,
Risk in Drug Group = 80/(20+80) = 0.8(80%)
Risk in Placebo group = 60/(60+40) = 0.6 (60%)
Risk ratio = Risk in Drug Group/Risk in PlaceboGroup = 0.8/0.6 = 1.33
RR = 1: No difference in risk between the two groups.
RR > 1: The event is more likely to occur in the exposed group (e.g., the drug increases the likelihood of recovery).
Example: RR=1.33 implies that patients in the drug group are 33% more likely to recover compared to those in the placebo group.
The following table provides a comparison of the three terms.

Table create by the author
About me
Thank you for reading the article! If you find this article useful, check out my other articles relevant to data science. Also, like, clap, comment, and follow me on Medium, LinkedIn, and GitHub.
메타데이터
- post_id
- afe3ff3c07db
- slug
- understanding-odds-ratio-relative-risk-and-hit-ratio-afe3ff3c07db
- url
- https://medium.com/@nivedita.home/understanding-odds-ratio-relative-risk-and-hit-ratio-afe3ff3c07db
- canonical_url
- https://medium.com/@nivedita.home/understanding-odds-ratio-relative-risk-and-hit-ratio-afe3ff3c07db
- author_url
- https://medium.com/@nivedita.home
- status
- ok
- fetched_at
- 2026-07-23 01:47:02