How We Optimized a 100 Node Elasticsearch Cluster
By Piotr Zielinski, Software Engineering Technical Leader at Cisco ThousandEyes
How We Optimized a 100 Node Elasticsearch Cluster
By Piotr Zielinski, Software Engineering Technical Leader at Cisco ThousandEyes
At Cisco ThousandEyes, we use Elasticsearch extensively, storing terabytes of data. Our clusters have about 100 nodes and 20k shards. We run aggregation queries on quite large data sets, so performance degradation is quickly visible. An innocent mistake can lead to latency issues, high CPU usage and potentially a production outage.
Improving performance not only provides a better customer experience but also allows us to reduce costs and keep the cluster smaller. At some point, adding 5% extra throughput becomes very expensive and engineering team needs to find a more optimal way of using it.
In this article, I’ll go through our optimizations and pitfalls you may encounter when using Elasticsearch.
Storage reduction — use compression
By default, Elasticsearch uses LZ4 compression, which isn’t very efficient. You can achieve much better results if you set it to best_compression, which uses ZSTD. It can save up to 28% of storage, and if your documents are large, that’s a significant saving.
Compression can be configured using the“index.codec” property. For example:
  "settings": {
    "index": {
      "codec": "best_compression"
    }
  }
In our case, we saved around 25% of storage, and it didn’t affect throughput. However, you should always test it in your environment and pay attention to the following:
- Throughput impact — Elasticsearch documentation states that the impact on throughput should be similar, as ZSTD is not a very complex algorithm. However, it’s still important to monitor it.
- Query performance — According to the official documentation, some queries may be slower; however, we didn’t observe this.
- Compression rate — If query performance or throughput is affected, is the achieved compression rate worth it?
Refresh interval
Our systems have very high write throughput, a single cluster can index 1k documents per second. The refresh interval greatly affects throughput and CPU usage. By default, the refresh interval is set to 1 second, which is very expensive in terms of CPU. It means a user only needs to wait one second to see the data, but this requires Elasticsearch to refresh it every second.
This setting depends on the use case — in our case, we were happy to set it to 30 seconds in an index template:
"settings": {
  "index": {
    "refresh_interval": "30s"
  }
}
The default value means near real-time processing. Not all systems need such high granularity, and for very high throughput, it is rarely a good choice.
Cardinality aggregation is expensive
The cardinality aggregation returns the number of distinct values for a given field. Unfortunately, it can be slow, uses a lot of memory, and is not always accurate. Its accuracy can be controlled using the precision_threshold parameter, where you can trade memory usage for accuracy (more memory usage results in better accuracy). For our large data sets, it became a bottleneck. For example, the following query takes 15 seconds:
{
  "aggs": {
    "type_count": {
      "cardinality": {
        "field": "machineId.keyword"
      }
    }
  }
}
If you really need to get unique values and your field is a string then it’s much more efficient to convert it into a hash code. Elasticsearch is pretty slow when running queries or aggregations on text fields.
We decided to use the MurmurHash3 algorithm to convert our strings into numbers when running expensive cardinality queries. Elasticsearch already uses this algorithm internally for some use cases. The same query time was reduced to just 650 milliseconds from 15 seconds.
{
  "aggs": {
    "type_count": {
      "cardinality": {
        "field": "machineIdHash"
      }
    }
  }
}
Elasticsearch even supports a custom field type based on Murmur3 hashing.
Avoid “exists” clause on objects
Our documents are large and contain complex objects. Some of our queries needed to check whether a specific object was present. For example, we checked whether an error object was set when running queries intended to calculate metrics for error cases. This specific query took 5 seconds when run on an object:
{
  "query": {
    "exists": {
      "field": "errorInfo"
    }
  }
}
It was reduced to 365 milliseconds (from 5 seconds) when we chose to run an exists query on primitive fields:
  {
    "exists": {
      "field": "errorInfo.message",
    }
  }
If possible, use integer values rather than text. However, even filtering by text is much faster than filtering on an object, as the example above demonstrates.
Avoid using a string as a tie breaker in sorting
Many of our performance issues were related to processing strings. Whenever possible, use numeric values instead. Of course, this is not always feasible — for example, when you need to sort documents alphabetically.
We also had a few cases where we used sorting only to enforce deterministic behaviour. When a public API was called multiple times for the same data, we wanted to return results in the same order (normally, the order is not deterministic due to distributed shards).
Example of sorting by a string:
{
  "sort": [
    {
      "machineId.keyword": {
        "order": "desc"
      }
    }
  ]
}
Example of sorting by a number:
{
  "sort": [
    {
      "machineIdHash": {
        "order": "desc"
      }
    }
  ]
}
It made it faster around 4 times (from 2 seconds to 500 milliseconds).
A similar situation occurs with tie-breakers. If you need to sort by a second field only to break ties, use numeric values.
Don’t use scripting
This may be obvious, but avoid using scripting or computed fields. The only exception is when your data set is very small and scripts are applied only to the output. If you use them as part of filtering or sorting, Elasticsearch must scan all the data, which results in high memory usage and slow queries.
If you need to sort by a field “B” that is calculated from existing data, compute it at ingestion time rather than using a script. Store precomputed values instead of recalculating them each time.
Don’t use “_id” field
Each document in Elasticsearch has an _id field that uniquely identifies it, but you should avoid using it in queries. In fact, it is good practice to disable querying on _id in the server configuration.
If you need to query by a unique value, create your own field, even if it contains the same value as _id. Operations such as filtering, searching, aggregations, and grouping are much slower and more memory-intensive on _id than on regular fields. This can exhaust heap memory and trigger circuit breakers in Elasticsearch. In fact, sorting by _id in older Kibana versions has the potential to trigger circuit breakers in large-scale clusters.
Why is it so slow? The _id field is not a regular field and is stored differently (in stored_fields). Using _id can result in very high memory usage in field data, which may lead to circuit breakers.
The safest option is to disable querying on _id at the server level:
PUT /_cluster/settings
{
  "transient": {
    "indices.id_field_data.enabled": false
  }
}
Keep an eye on your shards size
Shard size matters in Elasticsearch, and you should aim for 10–50 GB per shard, with each shard containing fewer than 200 million documents. Too many small shards (oversharding) or too few large shards can degrade cluster performance.
At ThousandEyes, we have alerts when a shard approaches 50 GB. You can also configure ILM (Index Lifecycle Management) to roll over an index when it reaches this size. If you use daily indices (or a similar strategy for splitting indices), you can control shard count using the number_of_shards parameter in your index template.
Don’t index everything
Elasticsearch is great at indexing and searching. It is easy to use — by default, you can search by any field, and you do not need to create custom indexes as in traditional SQL databases. However, this can also be a pitfall: you may waste significant resources (memory and CPU) if your documents are large.
We do not use dynamic mapping in our indices. This means that if we add a new field, it must be explicitly defined in the index template if we want to search by it.
At a high level, our index template sets two properties:
**dynamic: false** — When set to false (the default is true), Elasticsearch does not create mappings for unknown fields during ingestion. As a result, these fields are not searchable but are still stored in _source. This behavior applies only to fields that are not explicitly defined in the mapping. By default, Elasticsearch attempts to infer the mapping automatically.**index**— We set this to true or false depending on whether we want a given field to be searchable.
Example:
{
  "mappings": {
    "dynamic": false,
    "properties": {
      "name": {
        "type": "text",
        "index": true
      },
      "age": {
        "type": "integer",
        "index": false
      }
    }
  }
}
In the mapping above, there are only two defined fields:
**name** — a fully indexed field. It is searchable, which is the default behavior if you do not modify the dynamic or index settings.**age** — not indexed. You cannot search or aggregate on this field, but you can still retrieve and display it.**city** — not present in the mapping. It is still stored in _source, but you cannot reference it in queries or scripts because it has no defined type.
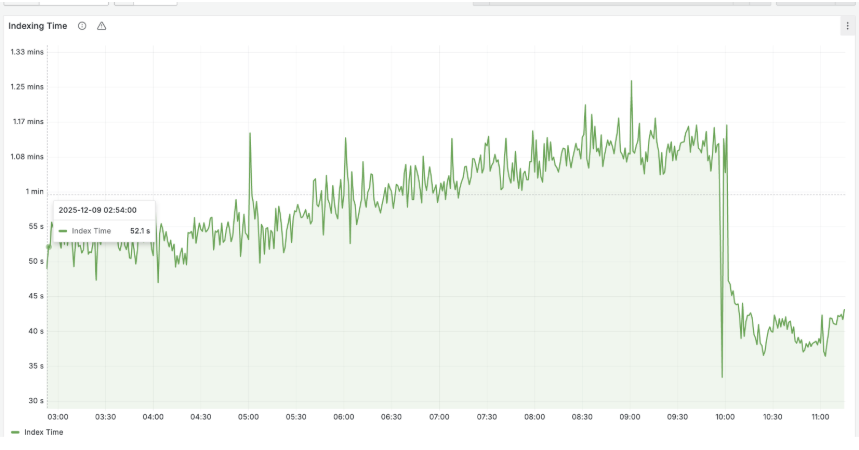
If your documents are large, it is unlikely that you need to search all fields. Indexing a field is expensive, and reducing the number of indexed fields can significantly lower CPU usage. The following example shows how our indexing time improved after applying these settings:
Changing an index template with many fields can be very time-consuming. We used Cisco approved AI tools (Codex, Cursor) to handle it for us. Here was our process:
- Get the latest template dynamically generated from production
- Use AI tools to scan the codebase and identify which fields should be indexed
- Run integration tests with the new static template
The AI was able to infer from the code analysis which fields should be searchable, saving us a lot of time that would otherwise have been spent manually reviewing every field, especially since we have multiple clusters and indexes. A decent test coverage allowed us to confidently validate the results.
Final thoughts
Elasticsearch is a powerful database, but like any technology, it has its own “gotchas.” Before applying any of these or other optimizations, test them in your own environment. The fact that something worked for someone does not mean it will be a good choice for you. It is also important to gather metrics about your usage, for example:
- Latency histograms
- Circuit breakers
- Cluster memory and CPU usage
- Shard sizes
- Indexing times
- Slow queries
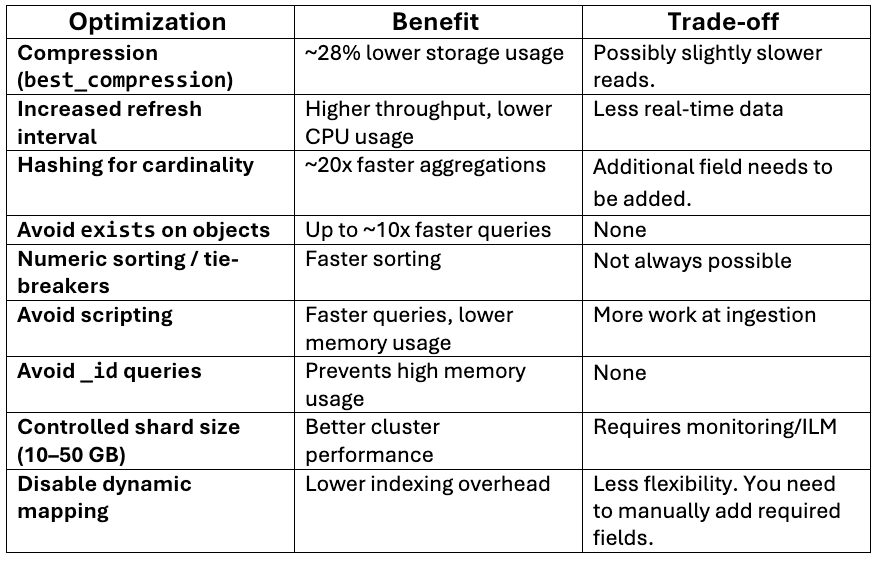
Here it’s a quick summary of what we described:
Want to be a part of our team? ThousandEyes is hiring! Please see our Careers page for open roles.
메타데이터
- post_id
- b044ae387f4e
- slug
- how-we-optimized-a-100-node-elasticsearch-cluster-b044ae387f4e
- url
- https://medium.com/thousandeyes-engineering/how-we-optimized-a-100-node-elasticsearch-cluster-b044ae387f4e
- canonical_url
- https://medium.com/thousandeyes-engineering/how-we-optimized-a-100-node-elasticsearch-cluster-b044ae387f4e
- author_url
- https://medium.com/@ThousandEyesEng
- status
- ok
- fetched_at
- 2026-06-15 20:49:13