Linux — Instrumentation: Part 2 — kprobes
It is time to deep dive into the different instrumentation technologies. We are going to start with kprobes, which was started by IBM in…
Linux — Instrumentation: Part 2 — kprobes
It is time to deep dive into the different instrumentation technologies. We are going to start with kprobes, which was started by IBM in 2014 and was merged to the mainline kernel in 2015. In order for kprobes to be enabled we should set “CONFIG_KPROBES=y” while compiling the kernel. There are several tools which leverage kprobes like SystemTap, perf and ftrace.
By using kprobes we can dynamically break into kernel code/functions while collecting debugging information. There are specific kernel address that we can break such as the kprobe itself, those address are managed in a blacklist (we can add something using the NOKPROBE_SYMBOL macro — for example https://elixir.bootlin.com/linux/latest/source/kernel/kprobes.c#L390). Overall, there are two types of probes which are “kprobes” and “kretprobes” (aka return probes — which are fired when the specified function returns).
Historically, in order to use “kprobes”/”kretprobes” we had to write a kernel module and using functions “register_kprobe” and “unrigster_kprobe” (we should specify a symbol, offset and pre/post operations). Today we can also use bpf (I am going to publish about bpf separately) in order to set/unset a “kprobes”/”kretprobes”.
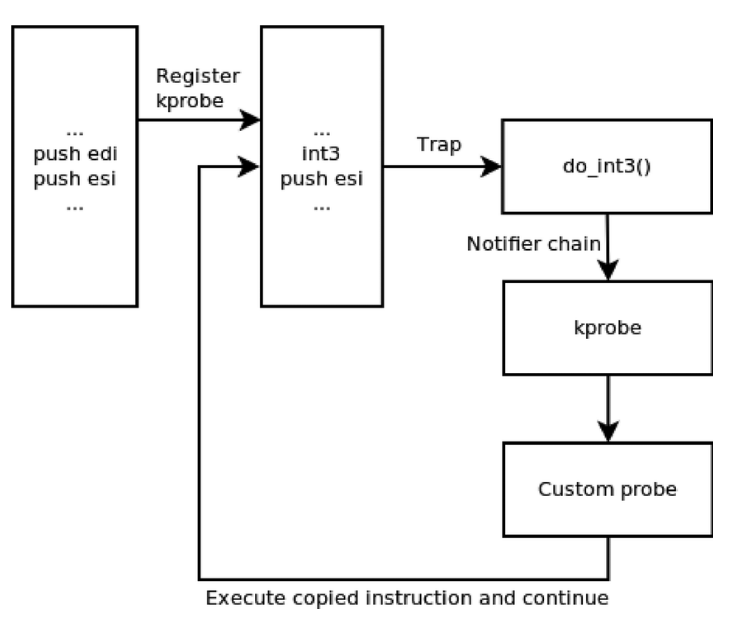
But how does kprobes work? The implementation is like “Software Breakpoints” used by a debugger. It makes a copy of the probed instructions and replaces the first byte/bytes with a “special instruction” which will cause an interrupt/exception that is caught by the CPU which then passes the control to the kprobe (int3 in x86, which has also a one byte instruction “cc”). For more information I suggest reading my writeup about “Breakpoints” — https://medium.com/@boutnaru/have-you-ever-asked-yourself-how-breakpoints-work-c72dd8619538. Also, check the diagram below which demonstrates the flow of using a kprobe. By the way, we can see all registered kprobes in “/sys/kernel/debug/kprobes”.
See you next time.
In the meantime you can also check my twitter account — @boutnaru (https://twitter.com/boutnaru).
메타데이터
- post_id
- b089092c4cff
- slug
- linux-instrumentation-part-2-kprobes-b089092c4cff
- url
- https://medium.com/@boutnaru/linux-instrumentation-part-2-kprobes-b089092c4cff
- canonical_url
- https://medium.com/@boutnaru/linux-instrumentation-part-2-kprobes-b089092c4cff
- author_url
- https://medium.com/@boutnaru
- status
- ok
- fetched_at
- 2026-07-26 17:05:25