Revamping Bantuinonline: From Marketing Website to Operational Dashboard
Project Overview 🚀
Revamping Bantuinonline: From Marketing Website to Operational Dashboard
Project Overview 🚀
Role: Product Designer Project Type: Website Revamp + Internal Dashboard Design Industry: IT Consulting & Digital Services
Bantuinonline provides digital solutions including technology development, digital marketing, and media publication.
This project goes beyond a typical website redesign. It focuses on improving both:
- External experience → attracting and converting clients
- Internal system → managing projects, clients, and operations
The goal was simple: Improve how the business grows and how it operates.

The Problem 🛑
From the UX audit and initial analysis, I identified two major gaps:
1. Website (Customer-Facing Issues)
- Weak value proposition on the landing page
- Unclear service differentiation
- Lack of strong call-to-action
- Low trust and credibility signals
2. Internal Workflow (Operational Issues)
A. No centralized system to manage:
- Projects
- Clients
- Payments
- Team progress
B. Difficult to monitor performance in real-time
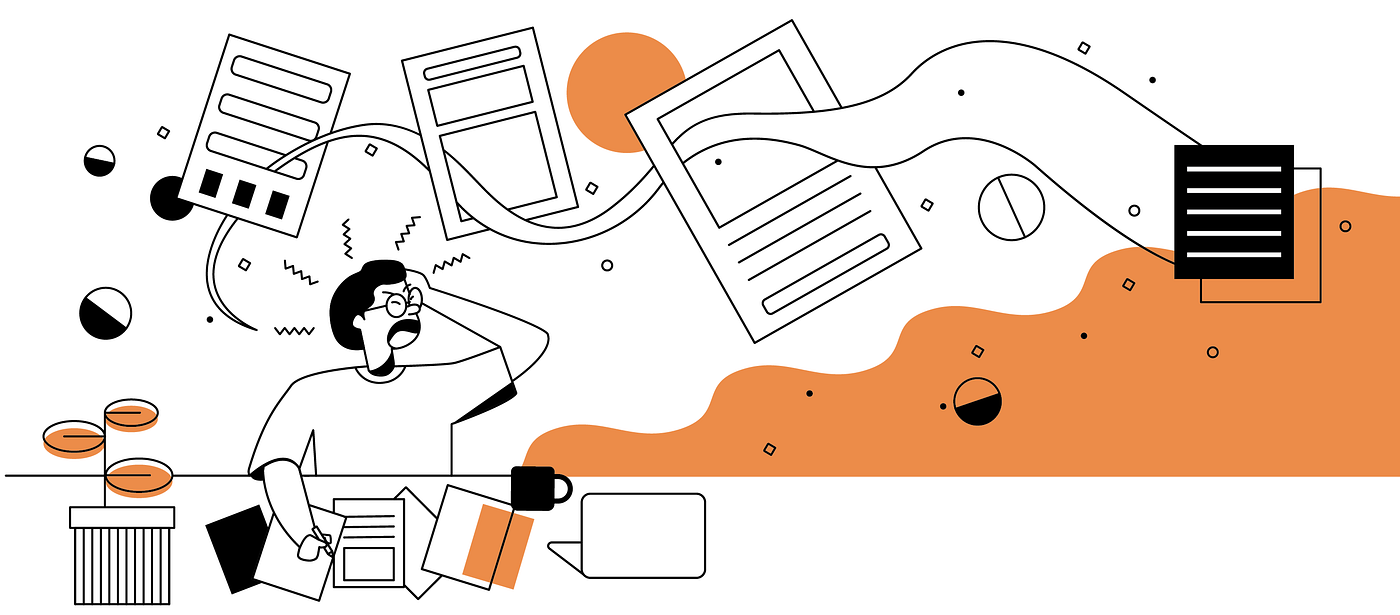
The business had tools — but not a system.

My Approach 👋
Instead of treating this as two separate problems, I approached it as one system:
“Designing a connected experience between business growth and operations.”
Key strategies:
- Improve clarity and conversion on the website
- Build a structured internal dashboard
- Align both sides with business goals
What I did:
- Conducted UX audit on existing website
- Rebuilt information architecture
- Defined dashboard features based on business needs

The Solution 💡
Part 1 — Website Revamp 💻
1. Clear Value Proposition
First impression was redesigned to communicate:
- What the company does
- Who it helps
- Why it’s different

2. Structured Service Presentation
Services were reorganized into clear categories:
- Technology Development
- Digital Marketing
- Online Media Publication
Each service is now easier to understand and compare.

3. Stronger Call-to-Action
Users are guided toward action:
- Clear CTA placement across sections
- Focus on consultation as primary conversion goal

4. Trust & Credibility
To increase conversion:
- Added testimonials / proof
- Highlighted experience and expertise
- Improved visual professionalism

Part 2 — Internal Dashboard Design 🖥️
1. Centralized Business Overview
The dashboard acts as a single source of truth.
Key metrics displayed:
- Active projects
- Deadlines
- Leads
- Revenue

2. Project & Task Management
Allows the team to track progress effectively:
- Project list with status and priority
- Timeline visibility
- Task monitoring

3. Performance & Analytics
To support decision-making:
- On-time vs delayed projects
- Completion rate
- Project Breakdown
- Upcoming Deadline

4. Financial Tracking
Finance is integrated into the system:
- Payment status (Paid, Pending, Overdue)
- Revenue tracking
- Cashflow visibility

5. Operational Efficiency
The dashboard is designed to:
- Reduce manual tracking
- Improve visibility across teams
- Support faster decision-making
Instead of switching tools, everything is accessible in one place.

Impact ⬆
Although this is a conceptual redesign, the outcome focuses on real business improvements:
External (Website) 💻
- Clearer positioning and services
- Improved user understanding
- Stronger conversion flow
Internal (Dashboard) 🖥️
- Centralized business operations
- Better project tracking
- Increased visibility of performance and finance
A good product doesn’t just attract users, it supports how the business runs behind the scenes.
Key Takeaways 🗒️
This project reinforced that:
- Design should connect frontstage (users) and backstage (operations)
- A strong system is more valuable than isolated features
- Clarity and structure directly impact both conversion and efficiency
If I had more time, I would:
- Validate dashboard usability with real team members
- Measure improvements in task efficiency
- Explore role-based access and automation features
Closing 🙏🏻
Designing for an IT consulting business is not just about visuals — it’s about building a system that supports growth.
Through this project, the goal was to create a seamless connection between:
- getting clients and
- delivering work efficiently
메타데이터
- post_id
- b0accadd5568
- slug
- revamping-bantuinonline-from-marketing-website-to-operational-dashboard-b0accadd5568
- url
- https://medium.com/@zanblog/revamping-bantuinonline-from-marketing-website-to-operational-dashboard-b0accadd5568
- canonical_url
- https://medium.com/@zanblog/revamping-bantuinonline-from-marketing-website-to-operational-dashboard-b0accadd5568
- author_url
- https://medium.com/@zanblog
- status
- ok
- fetched_at
- 2026-06-09 15:37:30