Stop Using Pearson Correlation! Why Distance Correlation is the Ultimate Data Science Cheat Code 🚀
Pearson is lying to you. If you’re looking for non-linear relationships in your data, Distance Correlation is the superhero you’ve been…
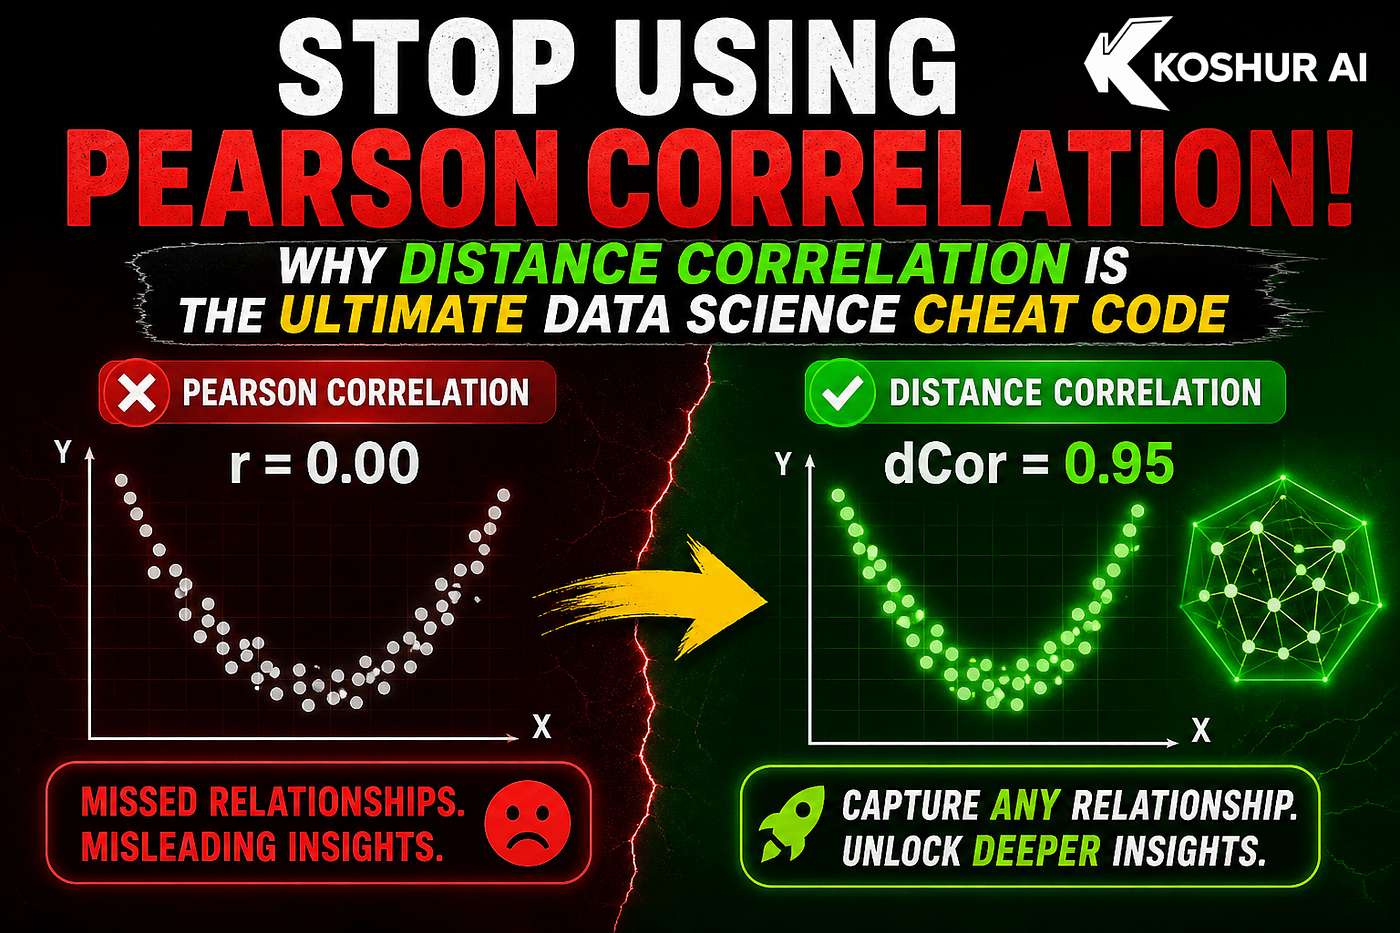
Stop Using Pearson Correlation! Why Distance Correlation is the Ultimate Data Science Cheat Code 🚀
Pearson is lying to you. If you’re looking for non-linear relationships in your data, Distance Correlation is the superhero you’ve been waiting for.
Discover why Pearson correlation fails at non-linear relationships and how Distance Correlation uncovers hidden patterns in your data science projects. Learn the math, intuition, and Python code.
You’re Missing the Best Patterns in Your Data. Here’s Why.
Picture this: You just downloaded a massive, messy dataset. You fire up Python, run a quick .corr(), sort the values, and drop all the columns with a correlation close to 0.
“Clean up the noise,” you tell yourself.
You just made a catastrophic mistake.
You used Pearson correlation. And Pearson just lied to your face.
While Pearson is the undisputed king of statistics class, it has a massive, fatal blind spot: It only cares about straight lines. If your data has a curve, a wave, or a chaotic but deterministic pattern, Pearson looks at it and says, “No relationship here.”
Enter Distance Correlation — the algorithmic cheat code that uncovers the hidden relationships Pearson can’t see.
In this article, we’re going to break down why Pearson fails, what Distance Correlation is, and how you can use it to supercharge your feature engineering today.
The Villain: Pearson’s Linear Bias 📉
Pearson correlation (often just called “correlation”) measures the linear relationship between two variables, X and Y. It gives you a score from -1 to 1.
But what happens when the relationship isn’t linear?
Look at the classic Anscombe’s Quartet or the modern Datasaurus Dozen. These are datasets that look completely different one is a circle, one is a parabola, one is a dinosaurbut they all have the exact same Pearson correlation (approx. 0.16).
Let’s look at a simple sine wave. If Y = sin(X), X and Y are locked in a perfect, mathematically unbreakable relationship. But if you calculate the Pearson correlation between X and sin(X), what do you get?
Zero. Zilch. Nada. 🤯
Because a sine wave goes up and then goes down, the “linear” trend averages out to nothing. Pearson throws its hands up and says, “Independent!”
In real-world data — stock prices, biological signals, user behavior relationships are rarely perfectly linear. If you rely on Pearson for feature selection, you are literally deleting your most predictive variables.
The Hero: Distance Correlation 🦸♂️
In 2005, statisticians Gábor J. Székely, Maria L. Rizzo, and Nail K. Bakirov introduced a mind-bending concept: Distance Correlation (dCor).
Unlike Pearson, Distance Correlation doesn’t care about the shape of your relationship. It only cares about whether X and Y are connected in any way.
The Golden Rule of dCor: Distance Correlation is exactly 0 IF AND ONLY IF X and Y are completely independent.
If dCor > 0, there is a relationship. It could be linear, exponential, sinusoidal, or a shape you’ve never seen before. It doesn’t matter. dCor will find it.
The Intuition (Without the Heavy Math)
Imagine you have three data points for X and three for Y.
- Pearson calculates how far each point is from the average of X and Y.
- Distance Correlation calculates how far each point is from every other point in X and Y.
It builds a distance matrix for X and a distance matrix for Y. If the distances between points in X are similar to the distances between points in Y, then dCor is high. It captures the “structure” of the data, regardless of whether that structure is a straight line or a chaotic spiral.
Let’s Prove It: A Python Showdown 🐍
Let’s see the difference in real-time using Python. We will generate a perfectly dependent non-linear relationship (Y=*X***2) and compare Pearson and Distance Correlation.
First, install the library: pip install dcor
Now, the code:
import numpy as np
import dcor
from scipy.stats import pearsonr

# Create a non-linear relationship (Parabola)
np.random.seed(42)
x = np.linspace(-10, 10, 500)
y = x ** 2  # X and Y are perfectly dependent!

# 1. Pearson Correlation
pearson_corr, _ = pearsonr(x, y)
print(f"Pearson Correlation: {pearson_corr:.4f}")

# 2. Distance Correlation
dist_corr = dcor.distance_correlation(x, y)
print(f"Distance Correlation: {dist_corr:.4f}")
The Output:
- Pearson Correlation: 0.0000
- Distance Correlation: 0.5674
Boom. Pearson sees a perfect mathematical bond and calls it zero. Distance Correlation correctly identifies a strong, non-linear dependency.
Imagine running this on a dataset with 1,000 features. How many U-shaped or exponential relationships are you throwing away every single day because you used Pearson?
How to Use Distance Correlation for Feature Engineering 🛠️
Applying dCor in your daily Data Science workflow is a game-changer for Feature Selection and Exploratory Data Analysis (EDA). Here is how to do it right:
1. Non-Linear Feature Selection
Stop using df.corr() to drop features. Instead, calculate the Distance Correlation between your target variable and your features. If a feature has a low Pearson score but a high dCor score, you have found a hidden gem. Keep it, and watch your model's accuracy spike.
2. Pairwise EDA Heatmaps
You can compute a Distance Correlation matrix just like a Pearson matrix. Plot it using Seaborn. You will suddenly see connections between variables that were previously invisible.
3. Combine with Tree-Based Models
Distance Correlation pairs beautifully with algorithms like XGBoost or Random Forests. Tree-based models are great at finding non-linear splits, but they struggle if you’ve already thrown away the non-linear features. dCor ensures the right features make it to the model.
The Catch: Why Doesn’t Everyone Use It? 🐢
If Distance Correlation is so superior, why isn’t it the default in Pandas?
Speed.
Pearson is lightning-fast — O(n) time complexity. Distance Correlation requires computing distance matrices, which scales at O(n2)
If you have a dataset with 1 million rows, calculating dCor across all features will take a serious amount of time and memory.
The Fix: Use dCor intelligently. Don’t run it on everything. Run Pearson first, then run dCor on a random sample of your data to hunt for the non-linear features Pearson missed. Alternatively, use the newer, faster implementations in the dcor library that optimize memory usage.
The Future of Correlation is Non-Linear 🔮
As data scientists, our job isn’t to force data into straight lines; it’s to uncover the truth, no matter how weird or curvy it is.
Pearson correlation is a relic of the 1800s when calculations had to be done by hand and linear assumptions were a necessity. We live in the era of deep learning and complex systems. The relationships driving stock markets, genetics, and human behavior are not straight lines.
It’s time to upgrade your toolkit. Stop dropping features based on Pearson. Start using Distance Correlation, and unlock the hidden patterns your models have been begging for.
If you found this helpful, smash that 👏 button 50 times! (It actually helps the algorithm show this to other data scientists).
💬 Drop a comment below: What’s the craziest non-linear relationship you’ve ever found in your data? Let’s chat!
📌 Want more deep dives into Data Science algorithms and Python tricks? Follow me so you never miss an article.
메타데이터
- post_id
- b1a93bf26414
- slug
- stop-using-pearson-correlation-why-distance-correlation-is-the-ultimate-data-science-cheat-code-b1a93bf26414
- url
- https://medium.com/@koshurai/stop-using-pearson-correlation-why-distance-correlation-is-the-ultimate-data-science-cheat-code-b1a93bf26414
- canonical_url
- https://medium.com/@koshurai/stop-using-pearson-correlation-why-distance-correlation-is-the-ultimate-data-science-cheat-code-b1a93bf26414
- author_url
- https://medium.com/@koshurai
- status
- ok
- fetched_at
- 2026-06-22 07:15:07