I ran a churn model on NBA players. Here is what it found.
Part 4 of a series where I work through marketing science techniques using sports data.
I ran a churn model on NBA players. Here is what it found.
Part 4 of a series where I work through marketing science techniques using sports data.

Same dataset as last time. Completely different question.
Model 3 was about cohorts. Draft classes as customer segments. How many from the 2003 class were still active at year 5, year 10. Aggregate stuff.
Model 4 gets specific. I want to know which individual players are going to churn out of the league next season. Name by name. And I want to know why.
XGBoost binary classifier. SHAP for explainability. 452 active players scored for 2026–27 churn risk. AUC of 0.82. Let’s get into it.
The setup
Churn label is simple. A player who logged at least 20 games in season Y and did not log at least 20 games in season Y+1 is churned. Still playing? Retained. Gone? Churned.
One wrinkle worth flagging. You cannot label 2025–26 players as churned or retained. You do not have 2026–27 data yet. So the most recent season becomes the prediction set, not the training set. Everyone before it gets the actual label.
18 features. Age, career year, draft position, box score stats, minutes, a composite performance score, and year-over-year deltas in performance and minutes. Walk-forward time-based train/val split to avoid leaking future information into the training set.
Standard stuff. The findings were less standard.
Age is not the top predictor. It is fourth.

The top predictor is overall performance level. By a wide margin.
If you are still producing, you stay. The model does not care how old you are. It cares what you did last season.
I expected age to dominate. It does not. What the model learned is that production is the gate. Teams keep players who help them win. A 35-year-old still scoring 18 points a game is safer than a 26-year-old averaging 6.
Year 3 players churn at the lowest rate of any career year.

15.2%. Compared to 20.3% in year 1 and 19.5% in year 2.
This one surprised me. You would expect churn risk to decrease monotonically with tenure. It does not. It drops in year 1 and 2, bottoms out in year 3, and then starts creeping back up as players age out of the league.
The reason is filtering. Players who reach year 3 have survived two full seasons of NBA evaluation. Coaches have had enough looks. Front offices have made a real decision about them. They are not speculative roster spots anymore. They are rotation players.
Subscription businesses have this same pattern. The user who makes it past the first renewal is structurally more loyal. Not because they like the product more. Because the hazard rate drops after the first filter. Year 3 in the NBA is that filter.
Performance trend is almost useless as a signal.
16th out of 18 features. Not third. Not eighth. Sixteenth.
What matters is the absolute production level. A declining star is safer than a flat fringe player. The model does not care that LeBron is averaging fewer points than he did at 30. It cares that he is still averaging 20.
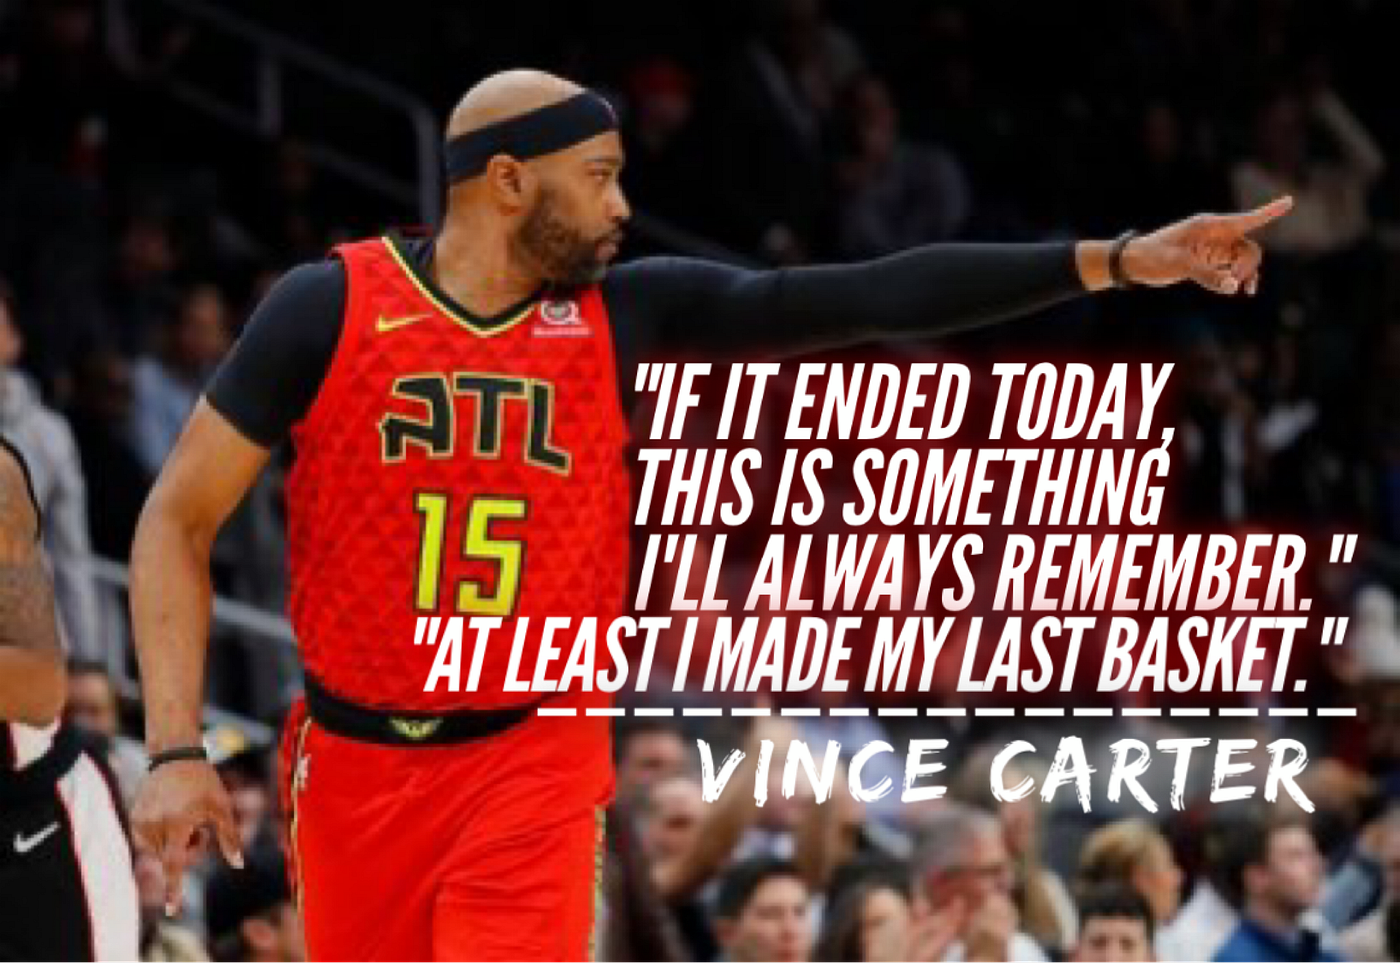
An example of a fringe player in Garrett Temple:

Now for the part I did not see coming.
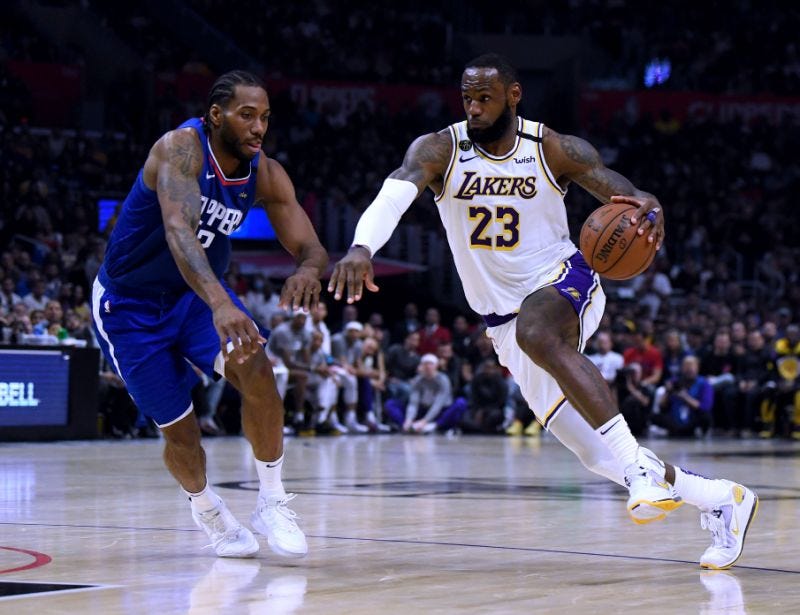
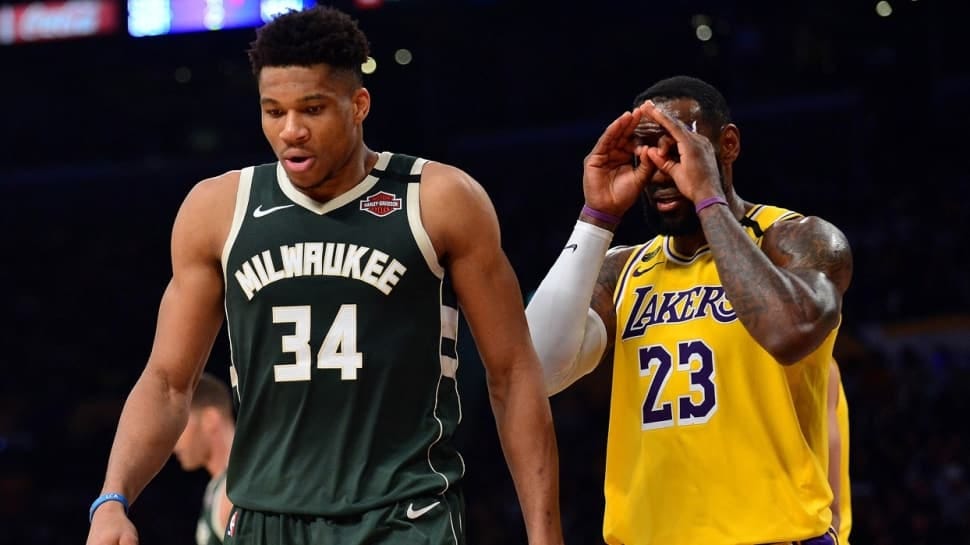
LeBron James. Career year 23. Age 41. 20.9 points per game. Performance score in the top handful of players in the entire league.
Churn probability: 60.2%.
Stephen Curry. 26.6 points per game. Age 38.
Churn probability: 50.4%. A literal coin flip.
Both of them, based on current production, should be nowhere near the top of the churn list. And yet here we are.
The model is not malfunctioning. It is being honest about the limits of its own training data.
The training set has never seen a player at career year 23. Or 22. Or 21. Once you get past year 15, the historical base rate for returning the following season drops toward zero. Almost no one does it. So when the model sees career year 23, it has no precedent to anchor on. Elite production pulls one direction. Career year pulls the other. The model gets uncertain and defaults toward the base rate.
LeBron and Curry are out-of-distribution cases. There is no version of them in the training data. The model is telling you it does not know. That is actually the correct answer.
Knowing when your model is uncertain is as valuable as knowing when it is confident. Most models hide this. The honest ones flag it.
The 2026 churn list
452 active players scored.
The high-risk names, setting LeBron and Curry aside, are mostly fringe veterans. Late career years. Low minutes. Production that has dipped below replacement level. The model is flagging what any competent front office scout would flag.
The low-risk names are younger players with career years 3 through 8, decent box scores, and regular rotation minutes. The year 3 effect shows clearly in the scored data. Players in their third season cluster at the bottom of the risk list even when their raw stats are unremarkable.
The model learned the hurdle. It just needed 30 years of data to do it.
The code is on GitHub if you want to run it yourself or adapt it for something outside of basketball.
https://github.com/marcusthuillier/Marketing_Science/tree/main/model_04_churn_model
메타데이터
- post_id
- b287ebe1fd1f
- slug
- i-ran-a-churn-model-on-nba-players-here-is-what-it-found-b287ebe1fd1f
- url
- https://medium.com/@marcus.thuillier/i-ran-a-churn-model-on-nba-players-here-is-what-it-found-b287ebe1fd1f
- canonical_url
- https://medium.com/@marcus.thuillier/i-ran-a-churn-model-on-nba-players-here-is-what-it-found-b287ebe1fd1f
- author_url
- https://medium.com/@marcus.thuillier
- status
- ok
- fetched_at
- 2026-06-23 03:48:11