How we managed to bring down memory footprint of our Spring Boot micro services — A case study
How we managed to bring down memory footprint of our Spring Boot microservices — A case study
Since I restarted my Java journey last year, I have been busy working with Spring Boot day-in and day-out. My client right now has a few one-pager applications and 20–30 supporting microservices and almost 99% of them are Spring Boot. These microservices not only interact with each other but also Keydb, MySQL database and few external services.
Since last year my client moved to a containerized application development — delivery-deployment architecture, which definitely streamlined CI/CD but brought a few side effects with it. And one the biggest one is memory footprint/consumption by these containerized applications.
To give an example, a simple GET which is querying a table from a MySQL database on properly indexed columns requires startup and runtime memory close to 600 MB. So, if we scale this service up by 3 instances/pods already a 2GB memory footprint for a simple Spring Boot application. And for 20–30 services, each having 3 instances (or pods) running, is going to cost our client close to 60–100GB to run their platform.
This was a huge problem for us, since we needed to think carefully which services, we want to scale which we cannot simply because we had only 40GB memory available. This made us started investigating on what is going wrong and where we can make things better. We even questioned about the choice of Spring Boot and maybe rewrite a few simple services in Express/Node JS.
Diving-Deep
We went on wild-goose-chase almost to find the root cause of our memory issues, read articles from every possible sources, because we couldn’t believe that no-one every faced this before. What we were looking for was an article like this, a white paper about their struggle and success with memory footprint issue with Spring Boot.
We found a few interesting articles and discussions online, which helped us in right direction:
-
DZone blog over spring memory usage and how to track details
-
Stackoverflow discussion: about JVM params
-
Stackoverflow discussion: runtime docker container settings
-
Stackoverflow discussion: running jar with minimal memory settings
The more we dived deeper, it became quite clear to us, that Spring Boot is not what makes the runtime memory go up, ofcourse there are some framework defaults which adds to this but not so much of memory consumption.
So, we started looking at the runtime container instance and the JVM parameters, because we were quite sure that’s where we have some quick wins.
The base-line
We setup 3 microservices which interacts with each other and also with Spring config server, KeyDB and MySQL. And tested this with JMeter with varied load and setup.
We invoked 1 microservice for our test, which interacts with 2 other microservices and they all retrieve their config from a spring cloud config and also interacts with KeyDb and MySQL.
The sequence of actions looks like below:
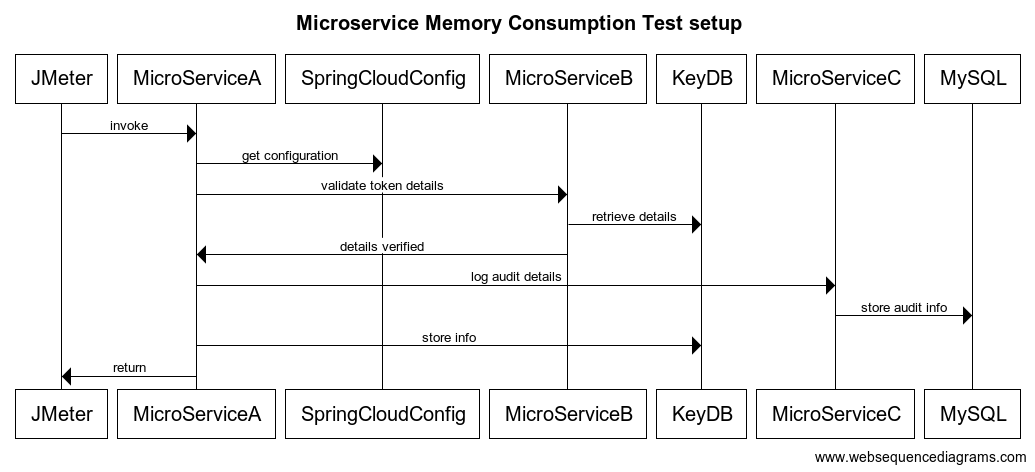
Test setup interaction diagram
And the setup is as below:

Spring Boot & JVM config
We researched about this quite intensively and found that there is a max thread setup and max connection parameter which gives startup and runtime memory quite a boost.
server.tomcat.max-connections=20 server.tomcat.threads.max=5
Although please read and adjust this according to your production requirements, Tomcat documentation can be found here.
For JVM parameters apart from a fixed Xmx, we used:
-
-XX:MaxRAM=150m (Or -XX:MaxRAMPercentage=70)
-
-XX:+UseSerialGC
-
-Xshareclasses
-
-Xquickstart
Container base-image
The biggest memory footprint reduction we saw is due to this, i.e., moving to a different base image while building our images.
We ran our tests on containers build with base image OpenJDK for Java 8 and 11 and OpenJ9.
The runtime and startup memory footprint were reduced for some cases almost 70% that too with an increase in Transaction per second value.
The Test and Results
We ran a JMeter load test with the following settings:
· Load: 20 concurrent threads with 500 requests per thread with no delay, which is 10000 transactions.
What we measured:
· Throughput (transactions per second)
· Image size
· Memory usage before, during and after the test.
Image Size with Base image as

First set of tests were ran with out an Xmx value on the JVM and we calculated Transaction per second(tps) on “Microservice A”.

test results with only base image variations

memory usage average
Then we repeated our test with Xmx=512 MB. Although we needed to set Xmx value only when we used OpenJDK 8 as our base image, for all other tests it was via docker-compose.yaml .
OpenJDK 8 crashed when it reached memory limit specified in container resources, we had to specifically set this as JVM parameter.

test results with only base image variation

memory usage average
Recommendations
OpenJ9 as your base image with some application properties and JVM parameters gave us the best outcomes. So, we recommend OpenJ9. Our tests also showed OpenJDK 8 as base image has worst memory footprint and also not very container aware.
Contributors
This article could not have been written without the help from Ian van Staden. My sincere thanks Ian :)
메타데이터
- post_id
- b41dd94e6c27
- slug
- how-we-managed-to-bring-down-memory-footprint-of-our-spring-boot-micro-services-a-case-study-b41dd94e6c27
- url
- https://medium.com/springboot-chronicles/how-we-managed-to-bring-down-memory-footprint-of-our-spring-boot-micro-services-a-case-study-b41dd94e6c27
- canonical_url
- https://medium.com/springboot-chronicles/how-we-managed-to-bring-down-memory-footprint-of-our-spring-boot-micro-services-a-case-study-b41dd94e6c27
- author_url
- https://medium.com/@iam.soham
- status
- ok
- fetched_at
- 2026-07-28 08:20:09
