How MCP Really Works in Prod: kagent, 124 Tools, 2 Sessions, 1 HTTP Header
I deployed an MCP server on k8s and traced every wire protocol call to understand what actually happens between agents and tools.
How MCP Really Works in Prod: kagent, 124 Tools, 2 Sessions, 1 HTTP Header
I deployed an MCP server on k8s and traced every wire protocol call to understand what actually happens between agents and tools.
I spent a day deploying kagent on k8s to understand how MCP really works. The real version, with wire protocol traces, session management, and agent-to-agent calls.
Most MCP tutorials stop at the config file. I wanted to see the HTTP requests, the JSON-RPC calls, the session lifecycle. So I dug in.
MCP is everywhere now. Anthropic launched it, everyone is building servers. But when you read the docs, you get quickstart guides. Install this, configure that, done.
What none of them tell you: how does the session actually start? Where does the session ID come from? What does a real tool call look like on the wire?
I needed to know this because I work with k8s. If I am going to run MCP servers in prod, I need to understand what is actually happening. Not just it works on my laptop.
This Substack is reader-supported. To receive new posts and support my work, consider becoming a free or paid subscriber.
The Setup
I used Nebius AI Cloud. They have GPU instances (L40S with 46GB VRAM). I did not actually use the GPU for this test. kagent runs fine on CPU. But in prod, if your MCP tools need to run image generation or video analysis, you will need GPU scheduling.
For multi-tenant GPU sharing, I contribute to Project HAMi (a CNCF sandbox project). It splits GPUs across pods. Different topic, but worth mentioning if you are thinking about AI workloads on k8s. The VM: 8 vCPUs, 32GB RAM, Ubuntu 24.04. Fresh install.
Installing k3s
k3s is lightweight k8s. One command, 15 seconds:
curl -sfL https://get.k3s.io | sh -From my terminal:
[INFO]  systemd: Starting k3s
real    0m15.794s
I picked k3s because a 5-node cluster is overkill here. It gives me a working k8s API in under 20 seconds.
Installing kagent
kagent is a k8s-native agent framework that includes MCP servers. Version 0.9.0 just came out. First, the CRDs:
time helm install kagent-crds \
  oci://ghcr.io/kagent-dev/kagent/helm/kagent-crds \
  --namespace kagent \
  --create-namespace
From my terminal:
Pulled: ghcr.io/kagent-dev/kagent/helm/kagent-crds:0.9.0
NAME: kagent-crds
LAST DEPLOYED: Sat Apr 25 15:53:23 2026
NAMESPACE: kagent
STATUS: deployed
REVISION: 1
real    0m5.476s
Check what got installed:
k get crds | grep kagent.devOutput:
agents.kagent.dev                              2026-04-25T15:53:24Z
mcpservers.kagent.dev                          2026-04-25T15:53:24Z
memories.kagent.dev                            2026-04-25T15:53:24Z
modelconfigs.kagent.dev                        2026-04-25T15:53:24Z
modelproviderconfigs.kagent.dev                2026-04-25T15:53:24Z
remotemcpservers.kagent.dev                    2026-04-25T15:53:24Z
sandboxagents.kagent.dev                       2026-04-25T15:53:24Z
toolservers.kagent.dev                         2026-04-25T15:53:24Z
Eight CRDs. One new CRD in 0.9.0 is sandboxagents.kagent.dev. I have not dug into what that does yet, but it is new since the last version.
Then the main kagent install:
export NEBIUS_API_KEY="your-api-key-here"time helm install kagent \
oci://ghcr.io/kagent-dev/kagent/helm/kagent \
--namespace kagent \
--set providers.default=openAI \
--set providers.openAI.apiKey=$NEBIUS_API_KEY \
--set providers.openAI.endpoint=https://api.studio.nebius.ai/v1 \
--set providers.openAI.model=meta-llama/Llama-3.3-70B-Instruct \
--wait --timeout=10mI am using Nebius Token Factory (OpenAI-compatible API) with Llama 3.3 70B. Why not OpenAI directly? Because I wanted to test with an open model, and Nebius pricing is good ($2.56 for this entire test session).
The install timed out at 10 minutes:
Error: INSTALLATION FAILED: context deadline exceeded
real    10m2.775s
This is not actually a failure. Helm’s --wait flag expects all pods to be Ready. One pod (kmcp-controller-manager) was still pulling its image. After another minute, everything was running.
Check the pods:
kgp -n kagentOutput (17 pods total):
NAME                                              READY   STATUS    RESTARTS   AGE
argo-rollouts-conversion-agent-985c94668-4zm2t    1/1     Running   0          13m
cilium-debug-agent-5bdfbbf8b5-8qw5z               1/1     Running   0          13m
cilium-manager-agent-7c85d7b7df-9qrlh             1/1     Running   0          13m
cilium-policy-agent-5dd67dd9fc-skf4m              1/1     Running   0          13m
helm-agent-589bf45db8-j48tr                       1/1     Running   0          13m
istio-agent-6b44cd4fd-vcd9r                       1/1     Running   0          13m
k8s-agent-895864cb6-756sb                         1/1     Running   0          13m
kagent-controller-87fb569dc-wv48f                 1/1     Running   4          26m
kagent-grafana-mcp-dc4d9d79d-4f8tx                1/1     Running   0          26m
kagent-kmcp-controller-manager-777746db7c-kvcpx   1/1     Running   0          26m
kagent-postgresql-68f97986df-g9xqs                1/1     Running   0          26m
kagent-querydoc-7dbd595b58-db4cb                  1/1     Running   0          26m
kagent-tools-77c6f575c8-t7cwt                     1/1     Running   0          26m
kagent-ui-df66c64bd-pzht2                         1/1     Running   0          26m
kgateway-agent-5cc8d7fdc6-sfx9d                   1/1     Running   0          13m
observability-agent-78c9d59d54-5kck2              1/1     Running   0          13m
promql-agent-7685b45dc-h9cps                      1/1     Running   0          13m
All Running. Good.
The Manual Patch Nobody Tells You About
Something the docs do not mention. The Helm parameter — set providers.openAI.endpoint creates the API key secret correctly. But it does not populate the baseUrl field in the ModelConfig CRD.
Check it:
k get modelconfig default-model-config -n kagent -o yamlYou will see:
spec:
  apiKeySecret: kagent-openai
  apiKeySecretKey: OPENAI_API_KEY
  model: meta-llama/Llama-3.3-70B-Instruct
  provider: OpenAI
No openAI.baseUrl field. That means kagent will try to call https://api.openai.com/v1 instead of Nebius.
The fix:
k patch modelconfig default-model-config -n kagent --type=merge -p '{
  "spec": {
    "openAI": {
      "baseUrl": "https://api.studio.nebius.ai/v1"
    }
  }
}'
Output:
modelconfig.kagent.dev/default-model-config patchedCheck again:
k get modelconfig default-model-config -n kagent -o jsonpath='{.spec.openAI.baseUrl}'Output:
https://api.studio.nebius.ai/v1Good. This is a known limitation in kagent 0.9.0. The Helm chart sets the secret but not the CRD field. You need the manual patch. I am mentioning this because if you deploy kagent with a non-OpenAI provider, you will hit this.
The MCP Wire Protocol
This is the part nobody writes about. What does MCP look like on the wire?
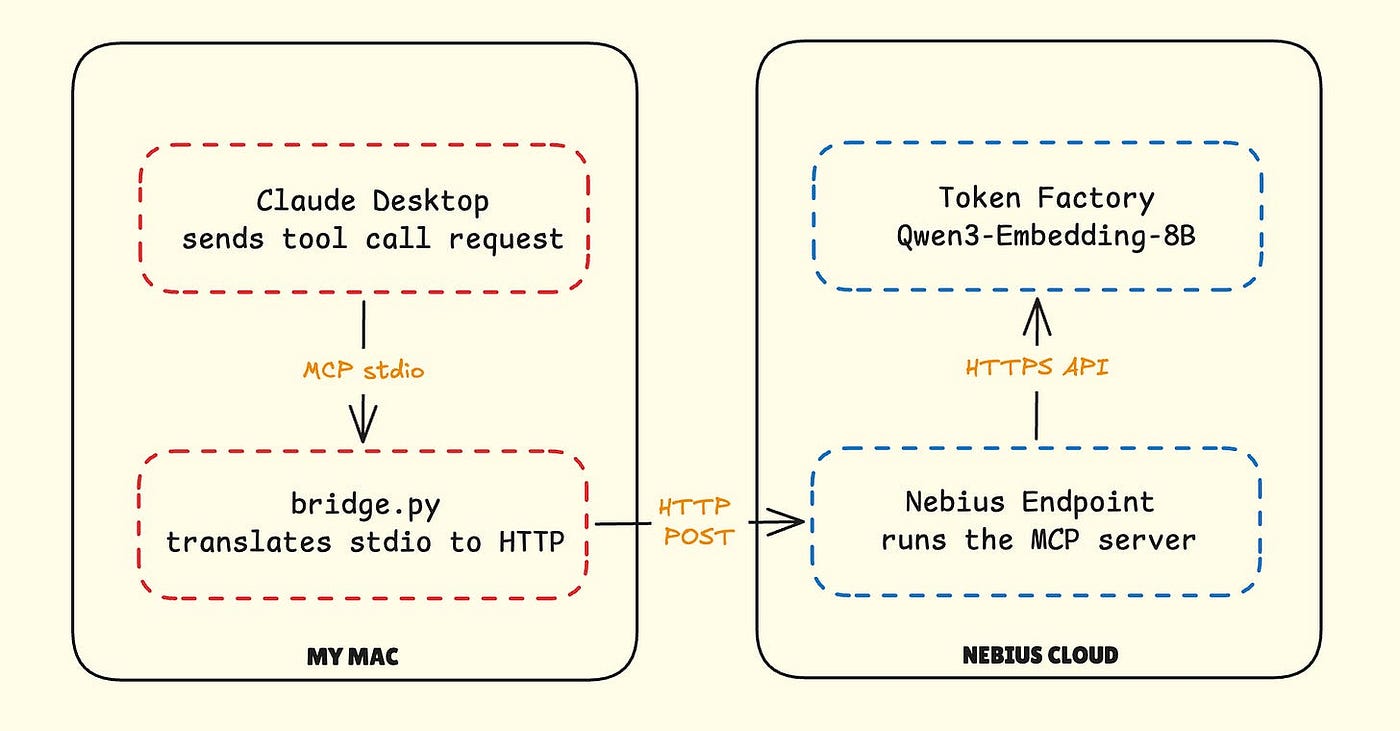
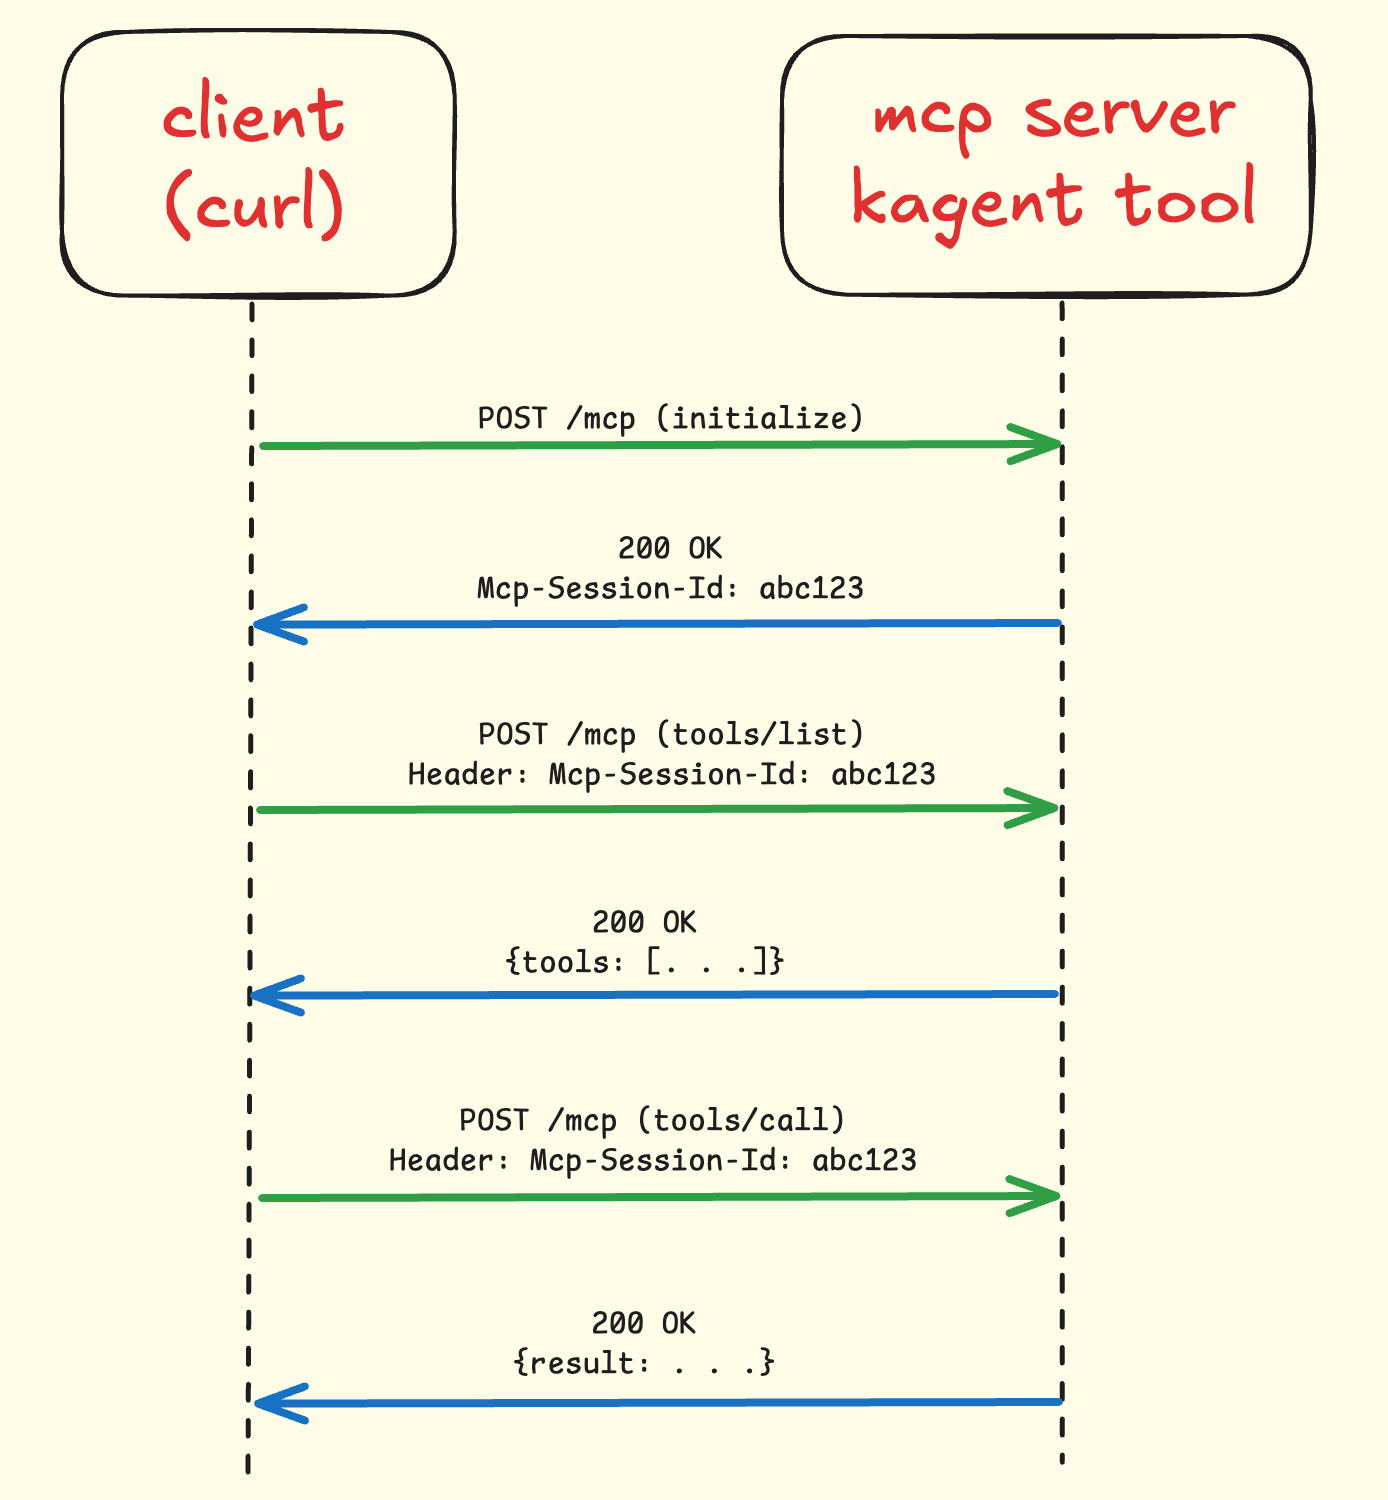
Here is a simple diagram showing the flow:
I port-forwarded the kagent-tools service to my laptop:
k port-forward -n kagent svc/kagent-tools 8084:8084 --address 127.0.0.1 &kagent-tools is an MCP server. It exposes 124 k8s-related tools (we will get to that).
Step 1 > Initialize a Session
MCP uses JSON-RPC 2.0. First request: initialize.
curl -i -X POST http://localhost:8084/mcp \
  -H "Content-Type: application/json" \
  -d '{
    "jsonrpc": "2.0",
    "id": 1,
    "method": "initialize",
    "params": {
      "protocolVersion": "2024-11-05",
      "capabilities": {},
      "clientInfo": {"name": "test", "version": "1.0"}
    }
  }'
The response from my terminal:
HTTP/1.1 200 OK
Content-Type: application/json
Mcp-Session-Id: mcp-session-bed70407-ca06-4689-a2a6-e1ab213add6a
Date: Sat, 25 Apr 2026 16:19:30 GMT
Content-Length: 175{"jsonrpc":"2.0","id":1,"result":{"protocolVersion":"2024-11-05","capabilities":{"tools":{"listChanged":true}},"serverInfo":{"name":"kagent-tools-server","version":"0.1.3"}}}Look at the header: Mcp-Session-Id.
The session ID is in an HTTP header. Not in the JSON response. This matters because if you are building an MCP client, you cannot just parse the JSON and expect to find the session ID. You need to read headers.
The MCP docs mention sessions, but they do not show you the actual HTTP exchange.
Step 2 > List Available Tools
Now that I have a session ID, I can call tools/list:
curl -s -X POST http://localhost:8084/mcp \
  -H "Content-Type: application/json" \
  -H "Mcp-Session-Id: mcp-session-bed70407-ca06-4689-a2a6-e1ab213add6a" \
  -d '{
    "jsonrpc": "2.0",
    "id": 2,
    "method": "tools/list",
    "params": {}
  }' > /tmp/tools-list.json
cat /tmp/tools-list.json | jq '.result.tools | length'Output:
124124 tools. Let me show you what one looks like:
cat /tmp/tools-list.json | jq '.result.tools[0]'Output:
{
  "annotations": {
    "readOnlyHint": false,
    "destructiveHint": true,
    "idempotentHint": false,
    "openWorldHint": true
  },
  "description": "Check the logs of the Argo Rollouts Gateway API plugin",
  "inputSchema": {
    "type": "object",
    "properties": {
      "namespace": {
        "description": "The namespace of the plugin resources",
        "type": "string"
      },
      "timeout": {
        "description": "Timeout for log collection in seconds",
        "type": "string"
      }
    }
  },
  "name": "argo_check_plugin_logs"
}
The annotations are interesting. MCP has a safety hint system. Each tool tells you:
destructiveHint: truemeans this tool can change thingsidempotentHint: falsemeans running it twice is not safereadOnlyHint: falseconfirms it is not read-only
These hints let LLMs (or orchestrators) make smarter decisions about when to call tools.
The 124 tools are organized by category:
Argo Rollouts:      3 tools
Cilium networking: 15 tools
Helm:               8 tools
Istio:             12 tools
Kubernetes core:   45 tools
Gateway API:        6 tools
Prometheus/PromQL: 35 tools
Step 3 > Call a Tool
Let me actually execute something. I will call k8s_get_resources to list namespaces:
curl -s -X POST http://localhost:8084/mcp \
  -H "Content-Type: application/json" \
  -H "Mcp-Session-Id: mcp-session-bed70407-ca06-4689-a2a6-e1ab213add6a" \
  -d '{
    "jsonrpc": "2.0",
    "id": 3,
    "method": "tools/call",
    "params": {
      "name": "k8s_get_resources",
      "arguments": {
        "resource_type": "namespace"
      }
    }
  }' | jq '.'
From my terminal:
{
  "jsonrpc": "2.0",
  "id": 3,
  "result": {
    "content": [
      {
        "type": "text",
        "text": "NAME              STATUS   AGE\ndefault           Active   28m\nkagent            Active   27m\nkube-node-lease   Active   28m\nkube-public       Active   28m\nkube-system       Active   28m\n"
      }
    ]
  }
}
That is a real k get ns executed inside the MCP server pod. The tool server has cluster-admin RBAC, so it can read anything.
MCP itself is just JSON-RPC over HTTP. What feels like magic is the LLM picking the right tool and formatting arguments correctly.
The Transport: Server-Sent Events
One more thing I noticed. When I made a plain GET request to the MCP endpoint:
curl -v http://localhost:8084/mcp 2>&1 | head -25Response headers:
HTTP/1.1 200 OK
Cache-Control: no-cache
Connection: keep-alive
Content-Type: text/event-stream
Date: Sat, 25 Apr 2026 16:16:03 GMT
Transfer-Encoding: chunked
text/event-stream is Server-Sent Events (SSE). MCP’s STREAMABLE_HTTP transport uses SSE under the hood.
Makes sense for streaming. The MCP server can push tokens to the client as the LLM generates them.
Agent-to-Agent Communication
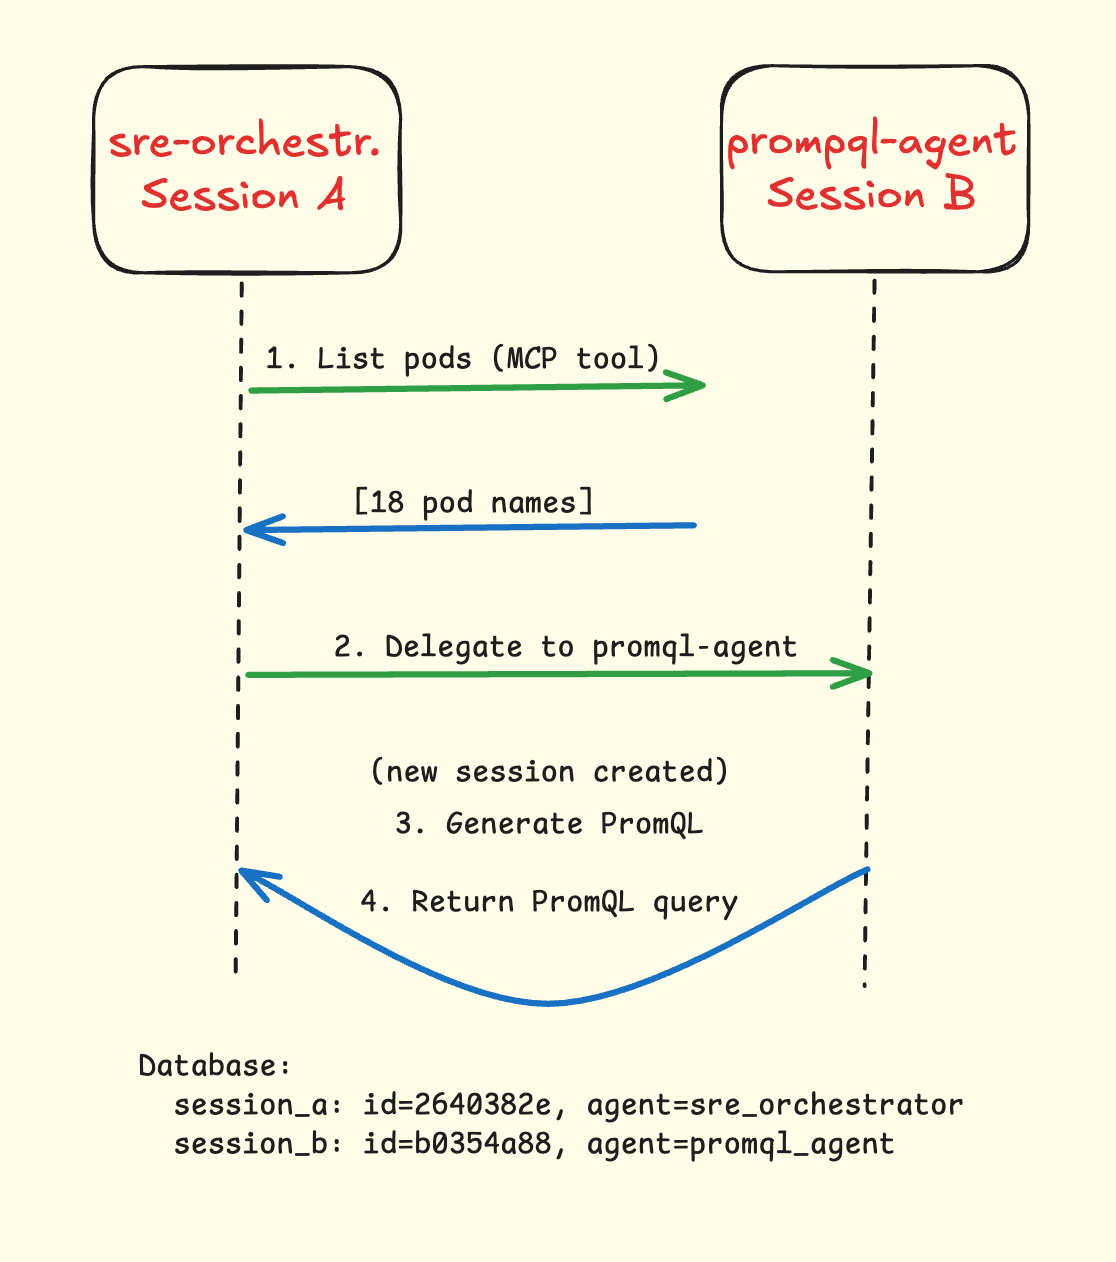
kagent has built-in support for agent-to-agent (A2A) delegation. I wanted to see how this works with MCP.
Here is what happens when one agent delegates to another:
I created a custom agent called sre-orchestrator:
cat <<'EOF' | k apply -f -
apiVersion: kagent.dev/v1alpha2
kind: Agent
metadata:
  name: sre-orchestrator
  namespace: kagent
spec:
  type: Declarative
  description: "SRE Orchestrator that delegates to specialized agents"
  declarative:
    modelConfig: default-model-config
    systemMessage: |
      You are an SRE orchestrator. When asked about metrics or PromQL,
      delegate to promql-agent. When asked about cluster state, use K8s tools directly.
    tools:
    - type: McpServer
      mcpServer:
        name: kagent-tool-server
        kind: RemoteMCPServer
        apiGroup: kagent.dev
        toolNames:
        - k8s_get_resources
        - k8s_describe_resource
        - k8s_get_pod_logs
    - type: Agent
      agent:
        name: promql-agent
EOF
Output:
agent.kagent.dev/sre-orchestrator createdWait for it to be ready:
k wait --for=condition=Ready agent/sre-orchestrator -n kagent --timeout=120sOutput:
agent.kagent.dev/sre-orchestrator condition metThis agent has two types of tools:
- Direct MCP tools (k8s_get_resources, k8s_describe_resource, k8s_get_pod_logs)
- Another agent (promql-agent)
I gave it a task:
kagent invoke --agent sre-orchestrator \
  --task "First, list all pods in kagent namespace. Then ask promql-agent to write a PromQL query for CPU usage of those pods." \
  --stream
What happened (simplified from the JSON stream):
- sre-orchestrator called
k8s_get_resourceswith namespace=kagent, resource_type=pod - Got back 18 pod names
- Called
kagent__NS__promql_agent(agent delegation) - promql-agent generated this PromQL query:
sum(rate(container_cpu_usage_seconds_total{pod=~"argo-rollouts-conversion-agent-985c94668-4zm2t|cilium-debug-agent-5bdfbbf8b5-8qw5z|..."}[5m])) by (pod)- Response came back to sre-orchestrator
Two separate sessions. That surprised me.
From the JSON stream I saw:
Parent session: 2640382e-4884-417e-95ac-20d9af90085a (sre-orchestrator)
Sub-session:    b0354a88-bdef-4290-8442-c1f88138a9fa (promql-agent)
I checked the PostgreSQL database to confirm this:
k exec -n kagent deployment/kagent-postgresql -it -- psql -U kagent -d kagent -c "
SELECT
  id,
  LEFT(id, 8) as short_id,
  agent_id,
  created_at,
  updated_at
FROM session
WHERE id IN (
  '2640382e-4884-417e-95ac-20d9af90085a',
  'b0354a88-bdef-4290-8442-c1f88138a9fa'
)
ORDER BY created_at;
"
My output:
id | short_id | agent_id | created_at | updated_at
--------------------------------------+----------+------------------------------+------
 2640382e-4884-417e-95ac-20d9af90085a | 2640382e | kagent__NS__sre_orchestrator | 2026-04-25 16:22:35.674079+00 | 2026-04-25 16:22:35.674079+00
 b0354a88-bdef-4290-8442-c1f88138a9fa | b0354a88 | kagent__NS__promql_agent     | 2026-04-25 16:22:49.573249+00 | 2026-04-25 16:22:49.573249+00
The sub-session was created 14 seconds after the parent. Two separate database records. Complete isolation.
Token accounting is also separate (from the JSON stream metadata):
- Parent session: 3,707 tokens total
- Sub-session: 2,407 tokens (prompt: 2,081, completion: 326)
When one agent delegates to another, the sessions do not share state. The parent only sees the final response from the child, not the internal reasoning or tool calls.
Worth knowing if you are debugging a multi-agent flow. You will need to dig into both sessions, not just the parent.
The Agent Card Protocol
A2A has a discovery mechanism. Every agent exposes a JSON file at /.well-known/agent-card.json.
I port-forwarded the k8s-agent service:
k port-forward -n kagent svc/k8s-agent 8080:8080 --address 127.0.0.1 &
sleep 2
curl -s http://localhost:8080/.well-known/agent-card.json | jq '.'
The response:
{
  "capabilities": {
    "pushNotifications": false,
    "stateTransitionHistory": true,
    "streaming": true
  },
  "defaultInputModes": ["text"],
  "defaultOutputModes": ["text"],
  "description": "An Kubernetes Expert AI Agent specializing in cluster operations, troubleshooting, and maintenance.",
  "name": "k8s_agent",
  "preferredTransport": "JSONRPC",
  "protocolVersion": "0.3.0",
  "skills": [
    {
      "description": "The ability to analyze and diagnose Kubernetes Cluster issues.",
      "examples": [
        "What is the status of my cluster?",
        "How can I troubleshoot a failing pod?",
        "What are the resource limits for my nodes?"
      ],
      "id": "cluster-diagnostics",
      "name": "Cluster Diagnostics",
      "tags": ["cluster", "diagnostics"]
    },
    {
      "description": "The ability to manage and optimize Kubernetes resources.",
      "examples": [
        "Scale my deployment X to 3 replicas.",
        "Optimize resource requests for my pods."
      ],
      "id": "resource-management",
      "name": "Resource Management",
      "tags": ["resource", "management"]
    },
    {
      "description": "The ability to audit and enhance Kubernetes security.",
      "examples": [
        "Check for RBAC misconfigurations.",
        "Audit my network policies."
      ],
      "id": "security-audit",
      "name": "Security Audit",
      "tags": ["security", "audit"]
    }
  ],
  "url": "http://k8s-agent.kagent:8080",
  "version": ""
}
The agent advertises:
- What it can do (three skills: cluster-diagnostics, resource-management, security-audit)
- Example queries it understands
- Protocol version (0.3.0)
- Preferred transport (JSONRPC)
Compare this to promql-agent:
k port-forward -n kagent svc/promql-agent 8082:8080 --address 127.0.0.1 &
sleep 2
curl -s http://localhost:8082/.well-known/agent-card.json | jq '.skills'
Output:
[
  {
    "description": "Translates a natural language description of monitoring needs into a precise and performant PromQL query, providing an explanation, assumptions, and alternatives.",
    "id": "generate-promql-query",
    "name": "Generate PromQL Query",
    "tags": ["promql", "prometheus", "query-generation", "metrics"]
  },
  {
    "description": "Explains how an existing PromQL query works, helps debug issues, or suggests refinements for better performance or accuracy.",
    "id": "explain-debug-promql-query",
    "name": "Explain or Debug PromQL Query",
    "tags": ["promql", "debug-query", "optimization"]
  },
  {
    "description": "Provides information about Prometheus data models, PromQL functions, syntax, common patterns, and best practices for writing effective queries.",
    "id": "promql-concepts-best-practices",
    "name": "PromQL Concepts and Best Practices",
    "tags": ["promql", "concepts", "best-practices", "tutorial"]
  }
]
And my custom sre-orchestrator:
k port-forward -n kagent svc/sre-orchestrator 8081:8080 --address 127.0.0.1 &
sleep 2
curl -s http://localhost:8081/.well-known/agent-card.json | jq '.skills'
Output:
[]Empty. I did not define any skills for it. That is fine. Skill definitions are optional. But if you are building a multi-agent system, defining skills helps other agents understand what to delegate.
Things That Did Not Work
Not everything went smoothly.
Llama 3.3 70B and Tool Calling
I tried a general question first:
kagent invoke --agent k8s-agent \
  --task "What is the status of this cluster? How many nodes and namespaces?" \
  --stream
The agent called k8s_get_resources with these parameters (from the JSON stream):
{
  "namespace": "null",
  "resource_name": "null"
}
Not JSON null. The string "null".
The tool server tried to run k get node null -n null. From my terminal:
[Kubernetes] get node null -n null -o wide failed: exit status 1The agent retried 9 times with the same parameters. Same error every time. Then it gave up.
But when I made the question specific:
kagent invoke --agent k8s-agent \
  --task "List all pods in the kagent namespace" \
  --stream
It worked perfectly. The parameters this time:
{
  "namespace": "kagent",
  "resource_type": "pod"
}
The tool executed successfully and returned 18 pods.
The problem is Llama 3.3 70B tool calling accuracy. It is not as sharp as GPT-4. When the query is vague, it guesses wrong. When the query is specific, it is fine.
If you run Llama in prod, write specific prompts. I learned that the hard way. Or just use Claude or GPT-4 and stop worrying about it.
Wrapping up
MCP itself is HTTP, JSON-RPC, and a session header. Nothing exotic. The problem is that most tutorials stop at the config file, so you never see the actual exchange.
A few things stuck with me.
» Sessions live in the Mcp-Session-Id header, not the JSON body. If you are writing a client, parse headers. I almost missed this.
» Tool schemas have annotations like destructiveHint and readOnlyHint. That is genuinely useful. You can build guardrails so the LLM does not fire destructive tools without confirmation.
» Agent-to-agent delegation creates a new session under the hood. Parent and child are isolated. Separate database rows, separate token counts. Worth knowing if you are debugging a multi-agent flow.
» Tool calling is more LLM-dependent than I expected. Llama 3.3 70B handles specific prompts fine but trips on vague ones. For prod, I would probably reach for Claude or GPT-4 unless my prompts were really locked down.
» And the kagent Helm chart in 0.9.0 does not populate the baseUrl in ModelConfig. If you use Nebius or anything other than OpenAI, you have to patch it manually after install. Took me 20 minutes to figure that out.
Next?
I tested MCP with CPU-only agents. But what if your tools need GPUs? Imagine an MCP tool that runs Stable Diffusion, or does real-time video analysis.
On k8s, you will need GPU scheduling. I work on Project HAMi for this. It is a CNCF sandbox project that does multi-tenant GPU sharing. HAMi plus MCP could be interesting: MCP tools request GPU fractions, HAMi schedules them across pods.
Maybe a future article.
All the commands above are from a real session on a Nebius VM. Whole thing took 30 minutes on a k3s cluster. If you want to try it yourself, k3s and any OpenAI-compatible LLM API will work. I used Nebius for cost reasons, but OpenAI, Anthropic, or local Ollama all work.
The MCP Dev Summit is happening in Shanghai in September. I might submit this as a talk. If you are going, let me know.
메타데이터
- post_id
- b49f55bdecbb
- slug
- how-mcp-really-works-in-prod-kagent-124-tools-2-sessions-1-http-header-b49f55bdecbb
- url
- https://medium.com/@mesutoezdil/how-mcp-really-works-in-prod-kagent-124-tools-2-sessions-1-http-header-b49f55bdecbb
- canonical_url
- https://medium.com/@mesutoezdil/how-mcp-really-works-in-prod-kagent-124-tools-2-sessions-1-http-header-b49f55bdecbb
- author_url
- https://medium.com/@mesutoezdil
- status
- ok
- fetched_at
- 2026-07-10 23:42:37