How to Identify Crypto Market Conditions Using Simple Metrics
As a crypto trader, I’ve learned that understanding the broader market context is crucial before executing any trade. Many traders focus…
How to Identify Crypto Market Conditions Using Simple Metrics
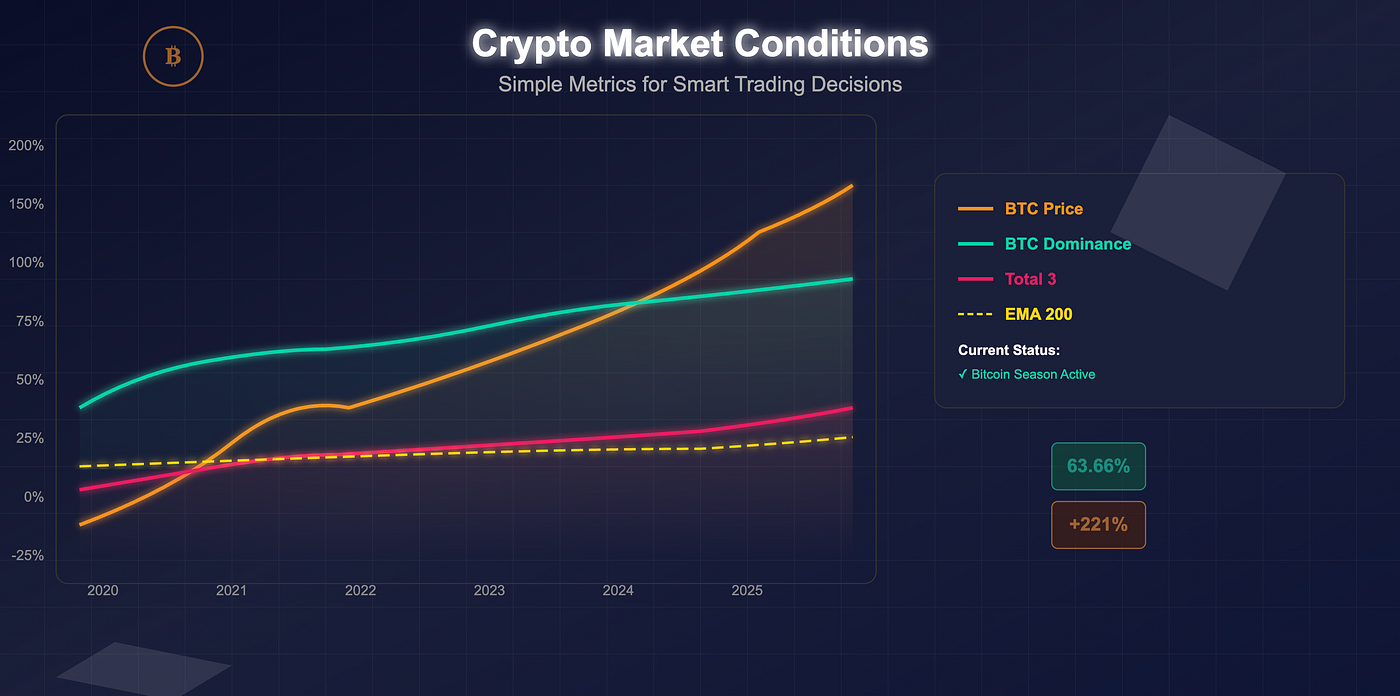
As a crypto trader, I’ve learned that understanding the broader market context is crucial before executing any trade. Many traders focus solely on individual coin setups while ignoring the overall market direction — a mistake that can be costly.
In this article, I’ll share straightforward methods to quickly assess crypto market conditions using easily accessible metrics. This knowledge will help you determine whether we’re in a bull market, bear market, altcoin season, or Bitcoin season — essential context for making smarter trading decisions.
Why Market Context Matters
Trading without understanding market conditions is like sailing without checking the weather. Here’s why this assessment is critical:
- Risk management: During crypto winters, you should be more conservative with long positions and position sizing
- Target selection: In Bitcoin-dominant periods, BTC typically outperforms alts
- Breakout validation: Levels break more easily in bullish conditions; breakouts often fail in bearish ones
- Capital preservation: Identifying downtrends early helps prevent significant losses
- Entry timing: Recognizing market bottoms provides optimal buying opportunities
Simple Metrics for Quick Assessment
1. Bitcoin Dominance (BTC.D)
Bitcoin dominance measures BTC’s percentage of the total crypto market cap. This single metric provides substantial insight:
When BTC.D is rising:
- Capital is flowing into Bitcoin rather than altcoins
- Market uncertainty or fear often prevails
- Bitcoin season is likely in effect
- Altcoins typically underperform
When BTC.D is falling:
- Capital is flowing from Bitcoin to altcoins
- Market confidence is growing
- Altcoin season may be emerging
- Diversification becomes more rewarding
Current situation (May 2025): BTC dominance sits at around 63.66%, showing an upward trend from early 2023 levels. This suggests we’re currently in a Bitcoin-favoring environment, though not at historical dominance peaks.

Source: BTC.D ticker in TradingView
2. Total 3 Chart vs. BTC.D
The Total 3 index represents the crypto market capitalization excluding Bitcoin and Ethereum. Comparing BTC.D with Total 3 provides another layer of insight:
When BTC.D outperforms Total 3:
- Investors are seeking safety in Bitcoin
- Altcoin season is unlikely
- Conservative trading approaches are advised
When Total 3 outperforms BTC.D:
- Risk appetite is increasing
- Altcoin season may be developing
- Opportunities in smaller cap projects expand

Pink line: BTC.D, Candles chart — Total 3
Note: Pink line — BTC.D; Candles chart — Total 3
Source: Total 3 and BTC.D tickers from TradingView
3. BTC.D and EMA 200 Relationship
The 200-day Exponential Moving Average (EMA) on Bitcoin Dominance (BTC.D) serves as an important indicator for market cycles:
When BTC.D > EMA 200:
- Bitcoin season is likely in effect
- Capital is flowing primarily to Bitcoin
- Altcoins typically underperform
- Conservative altcoin approach is recommended
When BTC.D < EMA 200:
- Altcoin opportunities increase
- Capital is diversifying beyond Bitcoin
- Risk appetite in the market is expanding
- Strategic altcoin exposure becomes more favorable
From the charts provided, we can see the yellow EMA 200 line on the BTC.D chart, with Bitcoin dominance currently trading above its EMA 200, indicating conditions that favor Bitcoin over altcoins.

Source: BTC.D chart with EMA 200 from TradingView
4. The Altcoin Season Index
The Altcoin Season Index is a specialized metric that quantifies whether we’re in Bitcoin season or altcoin season:
Index above 75: Clear altcoin season Index below 25: Definitive Bitcoin season Index between 25–75: Mixed market conditions
This index compares the performance of top altcoins against Bitcoin over a specific timeframe. When 75% of top altcoins outperform Bitcoin, we’re in altcoin season. When fewer than 25% outperform Bitcoin, we’re in Bitcoin season.

Source: https://www.blockchaincenter.net/en/altcoin-season-index/
5. CVDD Floor Model
The CVDD (Cumulative Value Days Destroyed) Floor Model provides an excellent indicator for Bitcoin buying opportunities:
When BTC price approaches the CVDD floor:
- Historically excellent buying opportunities emerge
- Risk/reward ratios for long-term investments improve dramatically
- Market capitulation may be nearing completion
The CVDD model tracks the economic activity of Bitcoin and helps identify when BTC is undervalued relative to its historical economic utility.

Source: https://woocharts.com/bitcoin-price-models/
Practical Trading Applications
Understanding these metrics transforms your trading approach:
Bear Market Strategy
When metrics indicate bearish conditions:
- Reduce position sizes by 50–75%
- Focus on shorter timeframes and take profits quickly
- Consider holding higher cash percentages
- Look for shorting opportunities on weak altcoins
- Set tighter stop losses
For example, during the 2022 crypto winter visible in your charts, traders who recognized the bear market early could have preserved capital by reducing exposure when BTC.D was declining while Total 3 was also falling — a sign of capital leaving the crypto space entirely.
Bull Market Strategy
When metrics signal bullish conditions:
- Increase position sizes gradually
- Hold winning trades longer
- Consider more speculative altcoin positions
- Use pullbacks as buying opportunities
- Implement trailing stops instead of fixed ones
The chart from 2023–2025 shows a period where BTC’s rising price coincided with increasing BTC dominance — traders who recognized this pattern could have concentrated more capital in Bitcoin rather than altcoins.
Altcoin Season Strategy
When the Altcoin Season Index moves above 75:
- Rotate profits from Bitcoin into high-quality altcoins
- Look for coins with strong fundamentals but lagging price action
- Pay attention to sector rotations (DeFi, NFTs, L2s, etc.)
- Consider smaller cap projects with strong fundamentals
Bitcoin Season Strategy
When BTC.D rises and the Altcoin Season Index falls below 25:
- Concentrate positions in Bitcoin
- Reduce altcoin exposure, particularly in smaller caps
- Focus on “blue chip” alts with strong BTC pairs
- Wait for clear bottoms in BTC.D before increasing altcoin exposure
Current Market Assessment (May 2025)
Based on the charts provided:
- BTC price is showing strong performance
- BTC dominance is at 63.66% and trending upward
- Total 3 is showing positive momentum but at a slower pace than BTC
- BTC is trading well above its EMA 200
This combination suggests we’re in a market with Bitcoin leading the charge. While not a pure “Bitcoin-only” market, the conditions favor BTC over smaller altcoins. The optimal strategy would be to maintain significant Bitcoin exposure while selectively adding quality altcoin positions during dips.
Conclusion
These simple metrics — BTC dominance, Total 3 comparison, EMA 200 relationship, Altcoin Season Index, and CVDD Floor Model — provide a comprehensive framework for assessing crypto market conditions without complex analysis.
By incorporating these metrics into your trading routine, you’ll gain valuable context that helps determine:
- When to be aggressive vs. conservative
- When to focus on Bitcoin vs. altcoins
- When to look for buying opportunities vs. capital preservation
Remember that no single metric tells the complete story, but together they create a reliable compass for navigating the crypto markets. Check these indicators regularly, ideally weekly, to maintain awareness of changing market conditions.
Trading with market awareness doesn’t guarantee profits, but it significantly improves your probability of success by ensuring your strategy aligns with prevailing conditions.
What market conditions do you see currently? Share your observations in the comments below.
Feel free to connect with me if you want to discuss trading strategies, market analysis, or anything crypto-related. Let’s navigate the exciting world of cryptocurrency together!

OR
Join the Private WhatsApp group to follow a trading ideas: https://chat.whatsapp.com/DD44TLPNjJU8RQ5FC3x38T

메타데이터
- post_id
- b52df8e503b7
- slug
- how-to-identify-crypto-market-conditions-using-simple-metrics-b52df8e503b7
- url
- https://medium.com/@zalutskyiyuriy/how-to-identify-crypto-market-conditions-using-simple-metrics-b52df8e503b7
- canonical_url
- https://medium.com/@zalutskyiyuriy/how-to-identify-crypto-market-conditions-using-simple-metrics-b52df8e503b7
- author_url
- https://medium.com/@zalutskyiyuriy
- status
- ok
- fetched_at
- 2026-08-03 15:48:06