Building Fairer AI for Capital Prioritization
1. Problem Domain and Motivation
Building Fairer AI for Capital Prioritization
1. Problem Domain and Motivation
Starting Point: The foundational idea for this project originated from GWU venture competition win (https://newventurecompetition.gwu.edu/2026-new-venture-competition-winners#business-goods-services), proposing the use of agentic AI to help asset managers make smarter capital decisions.
Picture a commercial real estate asset manager in Miami at the start of hurricane season. She owns 150 commercial buildings spread across Miami-Dade, Broward, and inland Polk County. She has enough capital budget this year to reinforce the roofs and windows on 45 of them. The other 105 will face the next storm with whatever they have now.
Choosing which 45 is hard. This process, an asset manager, undertakes every quarter is called Capex (Capital Expenditure) Prioritization.
Agentic AI system with access to the asset manager’s portfolio data, FEMA flood zones, wind risk data associated with the respective property should be able to provide a ranked capital list of which properties to fund first. That’s exactly what we have done, and let’s look at the gap we have identified.
2. The Gap
One of the KPI on which an asset manager’s performance and bonus relies on, is Net Operating Income (NOI), a simple formula used in real estate to calculate a property’s annual profitability.
The asset manager manager commercial real estate, not houses. We are talking about strip malls, office parks, retail centers, warehouses, and corner stores. None of these buildings are themselves “wealthy” or “working class.” But the neighborhoods they sit in are. Wealthy neighborhoods in Florida sit on more expensive commercial buildings, because rents and sale prices track local incomes. The AI is told to weight financial exposure heavily, because losing a $20 million building hurts the portfolio more than losing a $5 million one. So when the AI looks at the numbers, the buildings in wealthier tracts always come out on top. The buildings in working-class tracts next door, often facing the same hurricane or worse, end up at the bottom of the list.
3. The Data Used and What AI Sees
It looks at a small set of numbers for each of the 150 commercial buildings and produces a score. To understand why it favors the buildings in wealthier neighborhoods, you have to look at the inputs. Some of these come from real public APIs. Some are synthetic but built on top of real public APIs. We were careful about which is which, because the trust in the whole report depends on it.
Public Data
Building location and type (latitude, longitude, commercial / office / retail tag) : Sourced from OpenStreetMap
Census tract assignment : FCC Area API. We give it a lat / lon, it returns the state, county, and tract code.
Median household income and minority percentage: US Census Bureau, ACS 5-Year Estimates (2022)
FEMA flood zone (VE, AE, or X) : FEMA National Flood Hazard Layer, queried via the ArcGIS REST API for the building’s exact coordinates.
Synthetic Data
Wind risk (mph) : Coastal counties (Miami-Dade, Broward) get 150 to 185 mph. Inland Polk gets 110 to 140 mph.
Property value : The value is mathematically driven by the real Census income for the tract.
Net Operating Income and insurance premium: NOI is a random cap rate (5 to 8 percent) of the property value. Insurance is a percentage of value, scaled up sharply for buildings in real FEMA flood zone VE.
The scoring AI never sees income or race. It only sees four numbers per building: flood_zone, wind_risk_mph, noi, and insurance_premium. From those four, it produces a physical risk score (60 percent weight) and a financial exposure score (40 percent weight), then ranks the portfolio.
4. Results from our Agentic AI System
We pulled 150 commercial buildings from OpenStreetMap across three Florida counties and tagged each one with its real neighborhood income from the US Census, its real FEMA flood zone, and a realistic wind and financial profile. Then we ran the multi-agent AI pipeline (it uses LangGraph and uses kimi-k2-thinking using Nvidia NIM endpoint) and let it pick its top 30 percent.
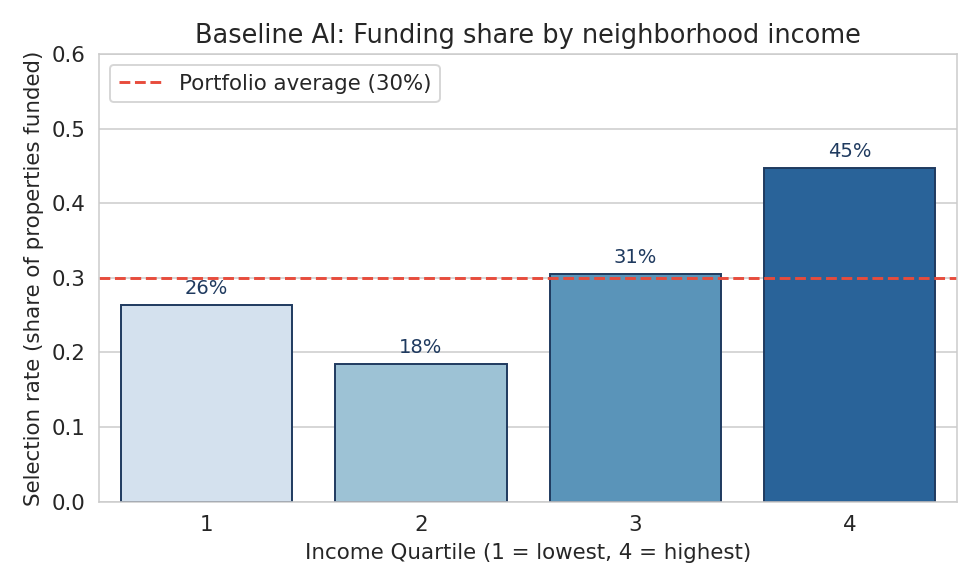
The baseline AI funds properties from the highest-income neighborhoods (Quartile 4) more than twice as often as the second-lowest group. The dashed red line is the portfolio average of 30 percent.
The picture matched the gap we worried about. Before we ran the LLM on the data, we wrote down five specific failure cases we predicted the system would produce. This protects us from cherry-picking. Three of the five played out as predicted, one was confirmed in aggregate, and one was mixed.
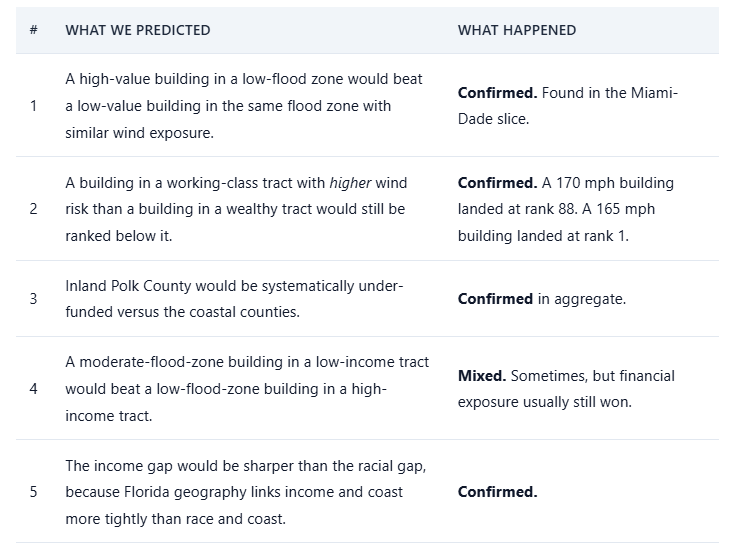
The clearest single failure was prediction number two.

And, yes, there is a difference between 165 mph and 170 mph winds. Damage does not increase linearly with wind speed; it increases exponentially. A 170 mph wind holds roughly 6% more kinetic energy than a 165 mph wind, increasing the force applied to structures.
5. Introducing the Trust Layer — Risk-Adjusted Gap
The idea is straightforward. We ask, “If we ignored money completely and only looked at the storm risk, who would the system fund?” Then we compare that imaginary list to the real one. If a group is funded much less often than pure storm risk would say they should be, that is the part of the gap money cannot explain. That is the part that should make us nervous.
This metric maps cleanly to what trust actually means here. Let’s look at how we built it.
We used a logistic regression model that takes one input per building (its physical risk score, computed from FEMA flood zone and ASCE wind exposure) and learns the relationship between that risk and whether the AI chose to fund the building.
# Step 1. Train a tiny model that predicts "was this building funded?"
# using ONLY the physical_risk_score (FEMA flood zone + ASCE wind) as input.
# Income, value, NOI are deliberately excluded.
X = df[["physical_risk_score"]]
y = df["funded_baseline"].astype(int)

model = LogisticRegression(class_weight="balanced")
model.fit(X, y)

# For each building, this gives the probability it WOULD have been funded
# if storm risk were the only thing that mattered.
df["risk_justified_prob"] = model.predict_proba(X)[:, 1]

# Step 2. For each income group, compare actual to risk-justified.
# Negative gap means the group is under-funded relative to its real storm risk.
for q in [1, 2, 3, 4]:
    sub         = df[df["income_quartile"] == q]
    actual_rate = sub["funded_baseline"].mean()       # what the AI picked
    justified   = sub["risk_justified_prob"].mean()   # what storm risk alone would pick
    gap         = actual_rate - justified
    print(f"Q{q}: gap = {gap:+.1%}")
That is the whole idea, a one-feature logistic regression gives us the storm-risk-only baseline, and a simple loop turns that into a per-group gap number.
6. The Implemented Fix
We thought about three ways to fix this. We rejected two of them.
The first option was to ask the AI to “be fair” in its prompt. We rejected this because LLMs are slippery when you give them moral instructions. You ask for fairness and you get something different every run, and you cannot explain to a regulator afterward what changed and why.
The second option was to retrain the AI on rebalanced data. We rejected this because we do not own the training data, and faking the financial inputs would distort the very signal the manager is paying for.
The third option, the one we picked, is a small filter that runs after the AI has finished. We call it the Parity Guardrail. It looks at the AI’s list of 45 funded properties, checks the funding rate for each income group, and asks, “Is any group falling more than 10 percent below the portfolio average?” If yes, it swaps out the lowest-priority funded property from an over-represented group and replaces it with the highest-priority unfunded property from the under-represented one. It keeps doing this until everyone is back inside the fairness band, or until no clean swap is possible.
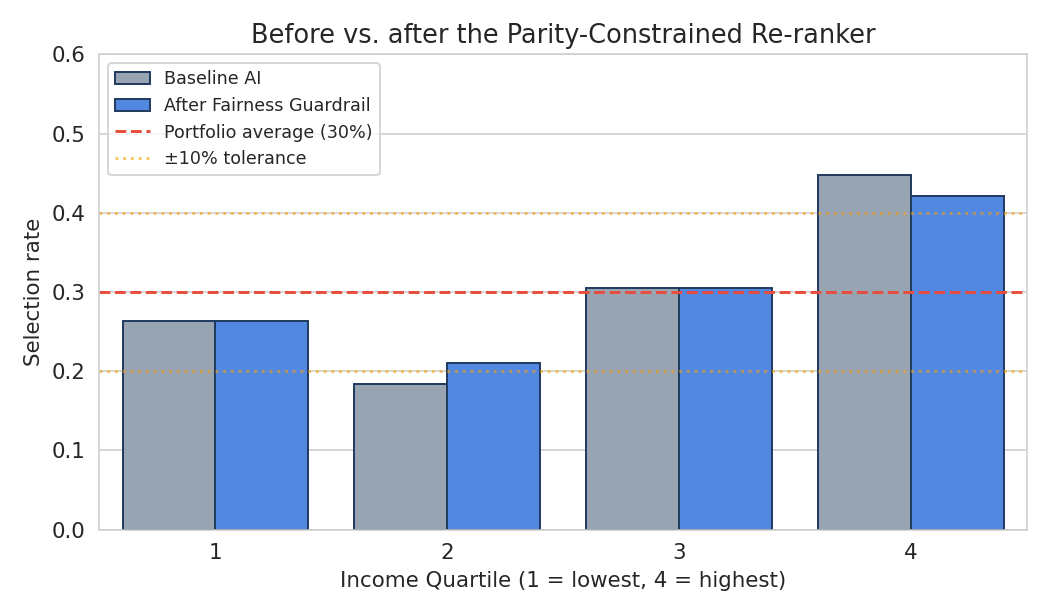
After the Guardrail ran, every group was inside the 10 percent fairness band. Here are the four numbers in plain form.
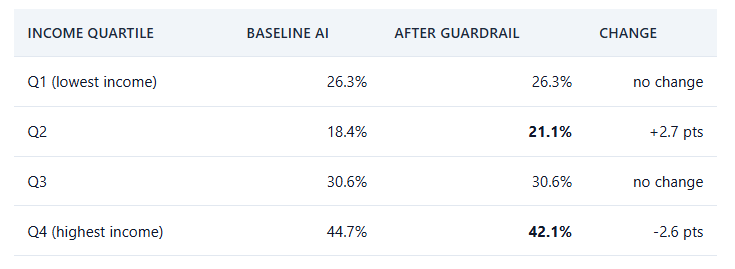
The Actual Swap
On this run, the Guardrail made exactly one swap. Here is what happened in real terms. The Guardrail removed an office building sitting in a Quartile 4 (high-income) tract in Broward that the AI had funded at rank 42 of 45. That building had only modest financial exposure and sat in a low flood zone, so it was not a strong pick to begin with. In its place, the Guardrail added a retail building in a Quartile 2 (working-class) tract in Miami-Dade. That building sat at rank 47, one spot below the funding cutoff, but it was in a moderate flood zone and faced 168 mph winds. The neighborhood it sits in includes a small grocery store and a check-cashing place that are essential to the surrounding apartments.
7. What the Fix Cost
On this portfolio, the Guardrail swapped one property. The total drop in “financial efficiency” was 2.2 percent. That is the cost. It is real, but it is small, and it is the kind of cost a manager can defend in a meeting by saying, “We accepted a 2 percent reduction in financial optimality to keep our funding inside a fairness band our regulator and our community can understand.”
That is the headline cost. There are smaller costs too:
- Speed and compute. Almost zero. The Guardrail runs in milliseconds. The AI calls take seconds. The Guardrail is a rounding error on top.
- What it covers. The Guardrail enforces fairness across income quartiles only. It does not directly enforce fairness across race, county, or building type.
- The risk of false comfort. This is the biggest hidden cost. A manager could look at “all four groups are inside the band” and conclude the AI is fixed. The truth is that the Guardrail clamps the symptom. It does not change the underlying scoring logic. The bias is still there. The Guardrail is a seatbelt, not a cure.
It is really important to note that such an Agentic AI system only helps an asset manager make smarter capital decision, at the end of the day, the decision to fund which property first depends upon the asset manager and the conditions/environment in which the asset management firm operates.
메타데이터
- post_id
- b52e1af95522
- slug
- building-fairer-ai-for-capital-prioritization-b52e1af95522
- url
- https://medium.com/@jaydparmar16/building-fairer-ai-for-capital-prioritization-b52e1af95522
- canonical_url
- https://medium.com/@jaydparmar16/building-fairer-ai-for-capital-prioritization-b52e1af95522
- author_url
- https://medium.com/@jaydparmar16
- status
- ok
- fetched_at
- 2026-06-23 03:48:11