Deploying Single-Node Kubernetes on Tencent CVM (RHEL 10 + Calico)
Vibe DevOps: From raw infrastructure to a cloud-integrated cluster via AI Agents
Deploying Single-Node Kubernetes on Tencent CVM (RHEL 10 + Calico)
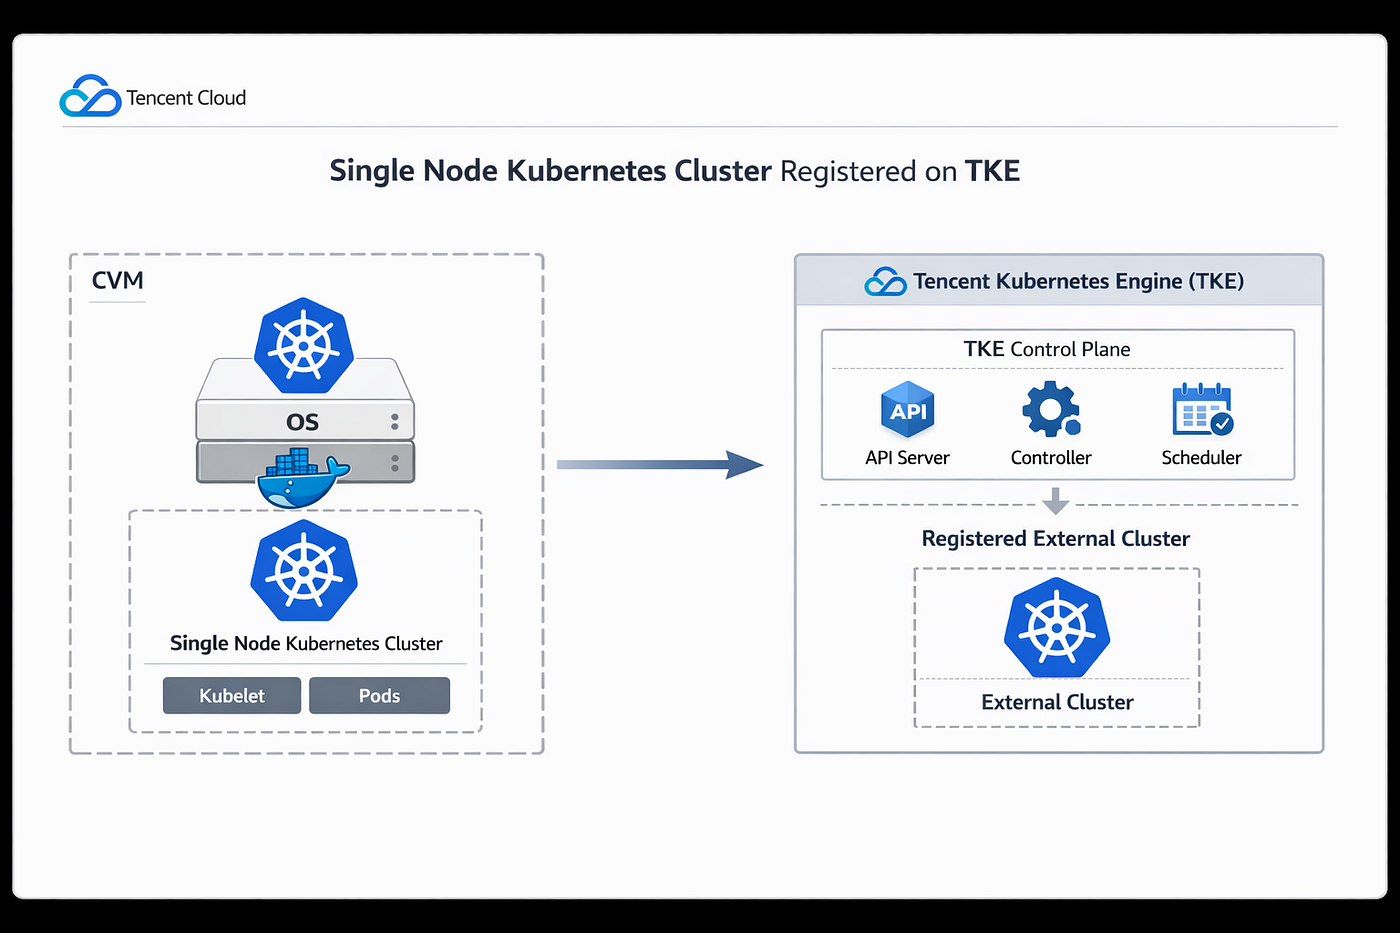
Vibe DevOps: From raw infrastructure to a cloud-integrated cluster via AI Agents
Standing up Kubernetes is easy to describe — but much harder to operationalize cleanly, especially when you’re working from a single node and building everything from scratch. I wanted to see how effective “vibe” coding could be used in the context of Platform Engineering and DevOps.
In this post, I walk through how I:
- Deployed a single-node Kubernetes cluster on Tencent Cloud CVM (RHEL 10)
- Diagnosed early CNI (Calico) issues using an AI-assisted workflow
- Brought up the standard web-based Kubernetes Admin dashboard
- Registered the cluster into Tencent Kubernetes Engine (TKE) as an external cluster
This isn’t just a step-by-step guide — it’s an operator’s deployment story, showing how a cluster evolves from “barely working” to fully integrated and observable.
This setup is intentionally minimal — perfect for:
- Edge deployments
- POCs
- Internal platforms
- AI-driven infra experimentation
🚀 Phase 1: Bootstrapping Kubernetes on CVM
The cluster started as a single CVM instance running RHEL 10, acting as both control plane and worker.
Instead of manually running every command, I used an AI agent over SSH to:
- Install Kubernetes components
- Perform health checks
- Diagnose failures in real time
🔍 First Reality Check: Control Plane vs Networking
The cluster didn’t come up perfectly — and that’s where things got interesting.
From the initial validation:
- ✅ API server reachable
- ✅ etcd, scheduler, controller-manager running
- ✅ CoreDNS healthy
- ❌
calico-nodestuck at0/1
This is a classic single-node failure mode:
Kubernetes is “alive,” but the network dataplane is broken.
The key insight:
- Don’t rebuild
- Don’t panic
- Narrow the failure domain
As captured in the deployment journal, the AI agent quickly isolated the issue to Calico readiness and suggested targeted diagnostics like pod logs, events, and DNS checks .
🧠 Why AI-assisted debugging actually mattered
This wasn’t just convenience — it changed how debugging worked:
- It separated control plane health from CNI issues
- It avoided unnecessary rebuilds
- It proposed safe, iterative diagnostics instead of guesswork
Instead of “cluster is broken,” the mindset became:
“The control plane is fine — networking is the only blocker.”
🔁 Phase 2: Iterative CNI Debugging
On the second pass, debugging became more surgical:
- Inspect Calico DaemonSet rollout
- Describe failing pods
- Check
install-cnicontainer logs - Validate config maps
This is where most people give up and rebuild — but the cluster was already 90% functional.
The journal explicitly highlights this iterative narrowing approach, focusing only on the failing networking layer rather than treating the system as fully broken.

🖥️ Phase 3: Bringing Up the Kubernetes Dashboard
Once the cluster reached a usable state, I added a browser-based Kubernetes dashboard.
This was a huge turning point.
Instead of relying only on kubectl, I now had:
- Visual workload status
- Namespace exploration
- Real-time pod/deployment health
From the dashboard:
- Namespaces were accessible
- Pods and Jobs were visible
- Management workloads were running
As shown in the dashboard view, the cluster was serving live workload data externally — confirming it was no longer just “internally alive,” but actually usable.

☁️ Phase 4: Registering into Tencent Kubernetes Engine (TKE)
Now comes the most interesting part:
Taking a self-managed cluster and turning it into a cloud-managed asset.
Step 1: Start registration
In Tencent Cloud Console:
- Define cluster name
- Select region
- Add metadata
This creates a registration stub in TKE.

Step 2: Apply the registration manifest
Tencent generates a YAML manifest that includes:
clusternet-systemnamespace- Service account
- ClusterRoleBinding (cluster-admin)
- Installation Job for
clusternet-agent
This isn’t just a connection — it’s a full integration payload.
TKE provides an explicit, auditable bootstrap manifest rather than a vague handshake
You simply:
kubectl apply -f tke-registration.yamlStep 3: Verify cluster import
Once applied, the cluster appears in TKE as:
- Type: External Cluster
- Status: Running
- Node count visible
- Kubernetes version detected
But the real validation?
👉 Workloads show up in Tencent Cloud UI
The journal shows:
dexdeployment → 1/1 runningopenshift-console→ 1/1 running
This proves:
TKE isn’t just tracking the cluster — it’s actively observing it

🧩 What This Architecture Demonstrates
This workflow highlights something powerful:
1. CVM can run real Kubernetes
A single node is enough for:
- Testing
- Demos
- Edge workloads
2. AI changes infrastructure operations
AI-assisted workflows:
- Reduce debugging time
- Improve signal vs noise
- Prevent unnecessary rebuilds
3. Dashboard = operational visibility
Not optional — essential.
4. TKE bridges self-managed and cloud-native
You get:
- Centralized visibility
- Cloud control plane integration
- Workload introspection
Without giving up:
- Flexibility
- Custom environments
🔚 Final Take
What makes this workflow compelling isn’t just that it works — it’s that it becomes understandable.
- The AI agent made the bootstrap legible
- The dashboard made the cluster visible
- TKE made it a first-class cloud asset
What started as a single RHEL 10 VM ended up as:
A fully operational Kubernetes environment with both local and cloud-side observability
메타데이터
- post_id
- b54df6dc2a0f
- slug
- deploying-single-node-kubernetes-on-tencent-cvm-rhel-10-calico-b54df6dc2a0f
- url
- https://medium.com/@dylanwong007/deploying-single-node-kubernetes-on-tencent-cvm-rhel-10-calico-b54df6dc2a0f
- canonical_url
- https://medium.com/@dylanwong007/deploying-single-node-kubernetes-on-tencent-cvm-rhel-10-calico-b54df6dc2a0f
- author_url
- https://medium.com/@dylanwong007
- status
- ok
- fetched_at
- 2026-07-11 13:47:56



