Why Is That Restaurant Always a 4.2?
You open a delivery or maps app. One place shows 4.8★ with just a few reviews; another shows 4.2★ with many. You have ten seconds to…
Why Is That Restaurant Always a 4.2?
You open a delivery or maps app. One place shows 4.8★ with just a few reviews; another shows 4.2★ with many. You have ten seconds to decide.
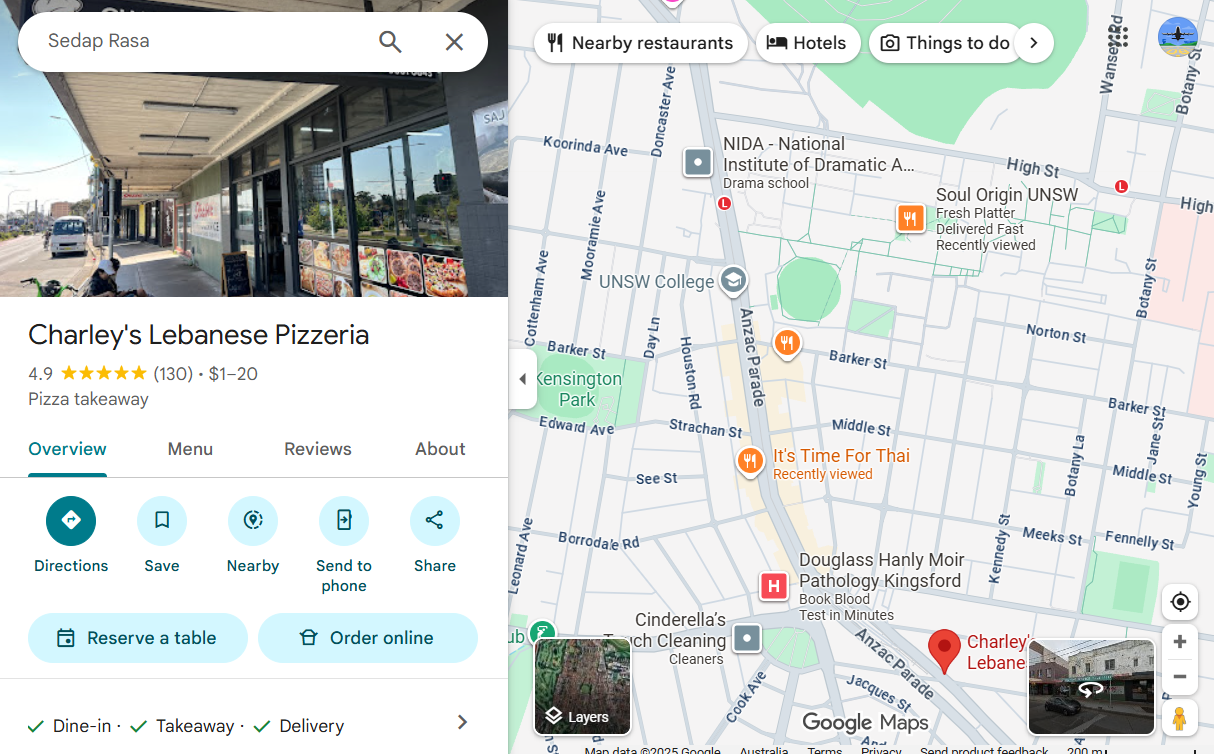
Two Google Maps listing headers: one shows 4.9 stars from about 25 reviews, the other 4.2 stars from about 600 reviews, used to show why sample size matters.

Two Google Maps listing headers: one shows 4.9 stars from about 25 reviews, the other 4.2 stars from about 600 reviews, used to show why sample size matters.
We often treat star ratings as “truth.” But they’re actually samples shaped by who speaks up and how platforms display them. Platform help pages explain that the visible score is an average of published ratings and that updates may take time to appear. So the 4.3 you see today may not include this week’s reviews yet.
The average star rating on digital platforms is not an objective measure of quality, but rather a biased and lagging sample of public opinion, actively shaped by platform rules and user behaviour. Whilst star ratings provide a useful starting point, their true value lies in understanding their inherent limitations, rather than treating them as absolute truth.
Star ratings look like a quick, useful decision tool. The problem is that we often treat them as facts when they are, in reality, samples with built-in biases and delays.
Influence of Platform Governance
Platforms don’t just display numbers; they shape them. On local listings, the visible score is the average of published ratings, and updates may take time to appear — so what you see today can lag behind recent reviews. Beyond this delay, platforms actively filter out suspicious activity and label anomalies, summarising methods and outcomes in annual Trust & Safety reports
Public rules matter too. The U.S. Federal Trade Commission’s final rule bans buying or selling fake reviews and enables penalties; the ACCC’s guidance on online reviews sets similar red lines in Australia. These guardrails don’t “control opinion”; they raise the signal quality of ratings by deterring manipulation.
Transparency helps users read scores in context. Google explains how Maps protects against fake content and publishes a transparency dashboard on enforcement so people can see what gets removed and why. In the bigger picture, the internet’s reliability rests on a multi-stakeholder ecosystem — documented by the Internet Society’s “Who makes the Internet work” — and the Web’s civic mission, renewed in Web@30. Ratings live inside that tradition: open participation with guardrails. Reading them well means noticing governance signals — verification labels, anomaly warnings, and removal notices — before you decide where to eat.

Bar chart from Google’s Transparency Report showing Maps content enforcement over time. Maps content enforcement snapshot (excerpt). Source: Google Transparency Report (fair use).
We can see this in real cases. In 2018 Italy, a paid-review broker was jailed, and Tripadvisor publicly supported the investigation (Tripadvisor newsroom). In Australia, ACCC v Meriton led to an A$3m penalty for manipulating which guests received TripAdvisor prompts (Reuters report). On the platform side, Google Maps now adds warning labels (“suspected fake reviews were removed”) and can pause new ratings during investigations; behind the scenes it disables accounts and removes large volumes of fake contributions (The Verge, Google Transparency data).

Criminal Court of Lecce, where the 2018 TripAdvisor fake-review case (PromoSalento) was tried. Credit: Enric, via Wikimedia Commons (CC BY-SA 4.0).
platforms govern through “law, market, code, norms” (Lessig), and outcomes reflect the interplay of Ideas, Institutions, and Interests (“the three I’s”). So the argument here isn’t that ratings are useless; it’s that ratings are governed samples — and when rules change, the meaning of a 4.2★ changes with them.
Algorithmic Bias and Personalisation
Star ratings don’t travel alone; they travel inside ranking and recommendation systems. If the data behind those systems already over-represents extreme opinions, algorithms can inherit that tilt and make it more visible. Research on online reviews documents a J-shaped distribution — lots of 5★ and 1★, fewer mid-stars — so any model trained on this pattern risks learning to over-weight the edges.
Personalisation then narrows what you see. The “filter bubble” idea is simple: systems show more of what you seemed to like before. In rating contexts, that means a user who often taps highly-rated places may be shown even more high-rated options and prompted to rate positive experiences, while negative or divergent signals become rarer on screen. Over time, your feed can look better than the underlying reality.
There is also evidence that recommendation feedback loops can amplify popularity. Studies of recommender systems show that iterative exposure can reinforce the already-popular and suppress the long tail — sometimes called popularity bias. Work on algorithmic feedback loops demonstrates how seemingly neutral ranking can magnify early signals into persistent advantages. See, for instance, empirical and simulation work on feedback loops in recommender systems

Café window. Photo by Pierre-Selim, via Wikimedia Commons (CC BY-SA 4.0).
None of this means personalisation is “bad.” It saves time and can surface great local options. But it does mean we should read ratings in context: look at distributions and recent reviews, and cross-check across platforms when your screen feels too perfect. Designers can help by exposing distribution views and recentness filters by default, so the average star is never the only story.

Google Maps policy section prohibiting fake or incentivized reviews, with key bullets. Policy excerpt: “Fake engagement” is prohibited. Source: Google Maps UGC Policy (fair use).
platforms aren’t just websites; they’re infrastructure that shape markets, visibility and choices — the broader platformization of society (Journal of Cyber Policy, 2019). That’s why a 4.2★ isn’t an objective truth but a governed sample: affected by who speaks (J-shape), how items are ranked (popularity bias), and what each user is shown (personalisation). Numbers guide us — but only once we read the system around them.
Ratings Don’t Just Correlate — They Shift Sales
High star ratings don’t just look good; they change what gets sold. On local platforms, higher scores are ranked higher and shown more prominently, which boosts visibility and conversion. That extra exposure then produces more clicks, orders, and reviews, which in turn helps the listing stay near the top — a classic feedback loop.

Diagram of the positive feedback loop between ratings, ranking/visibility, clicks/orders, and reviews.
Behavioral science helps explain the jump from screens to sales. The anchoring effect shows that the first number you see becomes your mental reference point; if you notice 4.8★ first, 4.2★ will often feel worse than it truly is — especially under time pressure.
Crucially, there’s causal evidence, not just correlation. Using a rounding-threshold design on Yelp, Luca (2016) shows that a one-star increase is associated with a 5–9% rise in restaurant revenue on average, with independent venues benefiting more than chains (brand and ad budgets blunt the effect for big brands). That is the ratings-to-revenue pathway in the wild.
Theory from platform economics fits the pattern: ratings sit inside a two-sided market where discovery on the user side increases value on the seller side. See Advanced Introduction to Platform Economics for how visibility, network effects, and governance interact.
The same loop that rewards real quality can also amplify early luck and interface choices into long-run advantage. That’s why the average star should be a clue, not a verdict. Before you trust a 4.8 over a 4.2, check sample size, recency, and distribution — we’ll make that a 60–90 second habit in the checklist section.
Crucially, those sales effects are not just about product quality — they emerge from how the platform ranks, labels and distributes ratings, reinforcing our thesis that a star average is a rule-shaped sample, not an objective verdict.

Food delivery cyclists in Lyon. Photo by Gerard Delorme, via Wikimedia Commons (CC0).
Why this matters beyond one dinner choice
Think of two dumpling shops. A shows 4.8★ from 25 reviews. B shows 4.2★ from 600. Your app sorts by “top rated,” so A sits higher. More people click A. A collects more fresh reviews. A stays high. That snowball is what researchers call popularity bias — once something is a little ahead, the extra exposure keeps it ahead.
Design gives that snowball a push. When the page puts a big average at the top, the anchoring effect kicks in: the first number you see becomes your “yardstick.” If A’s 4.8★ is your anchor, B’s 4.2★ looks worse than it is — even before you read any details.
There’s also a timing trap. Platform help pages say the visible score is based on published ratings and updates may take time. Translation: the number you see can lag behind what’s happening this week. During a busy holiday or a kitchen change, that lag matters.
Add how people actually post reviews. Online, the very happy and the very angry speak up more; the middle stays quiet. That creates a J-shaped distribution — lots of 5★ and 1★, fewer mid-stars. So the “average star” is a biased sample, not a thermometer of truth.
“But can’t bad actors just fake it?” That’s why there are guardrails. In Australia, the ACCC’s guidance on online reviews draws red lines for misleading or incentivised reviews. Platforms also remove suspicious patterns. The point isn’t to throw ratings away; it’s to read them with context.
Treat the average star as a clue, not a verdict. Check the distribution (are the 3–4★ detailed?), skim the most recent reviews (is there a new trend?), and note how many reviews there are. Then decide.

Infographic: bias reinforcement, user manipulation, and trust erosion around star ratings. Key societal risks; offset them by reading distribution, recency and sample size. Source Zhengyang He(CC BY 4.0).
A 60–90-second way to read any 4.2★
You don’t need to audit an algorithm to make a good choice. Give yourself one minute and run this mini-check.

Smartphone use. Photo via Wikimedia Commons (CC0)
-
Count before average. A “4.8★ from 25 reviews” is fragile; “4.2★ from 600” is stable.
-
Check recency. Skim the latest 10–20 reviews. Platforms themselves note that scores are computed from published ratings and updates may take time — so the number you see can lag behind reality.
-
Read the middle. Scan 3–4★ reviews for concrete details (slow service at lunch, salty broth). Online reviews often follow a J-shaped distribution where the very happy/angry speak more — mids can be the most informative.
-
Spot red flags. Learn the simple tells of fake/incentivised reviews from the ACCC’s guidance on online reviews (e.g., copy-paste phrasing, off-topic, sudden spikes).
-
Cross-check and look for governance signals. Peek at another platform and the provider’s transparency dashboard or Trust & Safety report (e.g., Yelp 2024) to see if suspicious patterns are being removed.
After this minute, a “4.2★” with depth and recency often beats a stale “4.8★”.

One-minute checklist to read platform ratings: count, recency, mid-stars, red flags, governance signals. Smart-Rating Checklist (60–90 seconds). Source: Zhengyang He (CC BY 4.0).
Internet transformations: why a 4.2★ is a web story
That little star next to a café isn’t just app glitter. It’s the tip of a very old web idea: help people find good stuff. Early histories like Where Wizards Stay Up Late show how the internet began as a research network and grew into the public web so anyone could discover and share. Thirty years after the web’s launch, Web@30 reminds us the mission is still civic: keep the web useful for everyone, and fix what’s broken.
Who keeps that promise real? Not one company. The net runs on many hands — standards groups, network operators, domain/name stewards, public-interest orgs — mapped by the Internet Society’s Who makes the Internet work. The lesson is simple: openness needs guardrails. Freedom to publish comes with rules that protect trust.
Now zoom into ratings. Apps and maps are today’s “front doors” to the web. Their governance — what counts as a valid review, what gets removed, how scores update — shapes what we all see. When Google publishes a transparency dashboard on Maps enforcement, that’s the platform version of the web’s old promise: open input, accountable rules.
Read our thesis through this lens: an average star is useful, but it’s not truth. It’s a sample produced by people (who post) and rules (that filter), so it can be biased (who speaks up) and delayed (when updates land). When you check recency, distribution, and how many reviews — your one-minute checklist — you’re practicing the web’s original habit: look at evidence before you decide. That’s how a humble 4.2★ fits the big internet story.

Clean timeline from ARPANET to AI-era governance; labels centered in rounded boxes. Internet Transformations (1969–2025). Source: Zhengyang He (CC BY 4.0).
Conclusion: Read stars like signals, then act like a citizen of the web
Let’s zoom out. A star rating is not a verdict; it’s a signal — a snapshot produced by people and platform rules. We’ve seen how tiny boosts in rank can snowball into real money (see causal evidence on Yelp), and how review patterns skew loud at the extremes while the middle stays quiet — the classic J-shaped distribution. None of this makes ratings useless. It just tells us to read them in context.
The stakes are social. Ratings don’t just pick tonight’s noodles; they redirect attention and revenue across a city. They can reward true quality — but also lock in early luck and design choices. That’s why we need guardrails. In Australia, the ACCC’s guidance on online reviews draws a hard line on fakes and incentives. This is governance for a public signal.
Seen through the lens of internet transformations, this is a civic story. The early web was built so people could find and share knowledge; thirty years on, Web@30 asks us to fix what’s broken so the web serves everyone. Reading a 4.2★ wisely is a small way to honor that mission: open participation, accountable rules, and users who can tell signal from noise.
So here’s the program — three layers, one minute at a time:
You, the user: Treat the average as a clue. Check how many reviews there are, skim recent ones, and read a few 3–4★ for concrete details. Leave your own specific review after you visit. You reduce bias for the next person.
Platforms: Make the signal legible by default: show review count, recency, and distribution next to the average; throttle sudden spikes; surface verified experiences; publish clear enforcement notes. That’s what “accountable ranking” looks like.
Regulators and cities: Keep the red lines bright. Support data access for independent audits and publish sector snapshots so small businesses don’t get stranded by interface tweaks.
In the end, “why is that shop always 4.2★?” Because the web is a living public ledger, constantly rewritten by design, data, and us. Your next minute — how you read, and how you review — helps write it better.

Three-layer plan: user habits, platform defaults, regulator guardrails — each in its own card, clean layout. Three-layer action plan for reading ratings. Source: Zhengyang He (CC BY 4.0).
Reference
Academic & research
Hu, N., Pavlou, P. A., & Zhang, J. (2009). Overcoming the J-shaped distribution of product reviews. Communications of the ACM, 52(10), 144–147. https://doi.org/10.1145/1562764.1562800
Abdollahpouri, H., Burke, R., & Mobasher, B. (2019). Managing popularity bias in recommender systems with personalized re-ranking. arXiv. https://arxiv.org/abs/1901.07555
Chen, J., et al. (2024). A survey on popularity bias in recommender systems. User Modeling and User-Adapted Interaction. https://link.springer.com/content/pdf/10.1007/s11257-024-09406-0.pdf
Wang, X., et al. (2022). A survey on the fairness of recommender systems. arXiv. https://arxiv.org/pdf/2206.03761v1.pdf
Causal evidence on ratings & revenue
Luca, M. (2011/2016). Reviews, reputation, and revenue: The case of Yelp.com. Harvard Business School Working Paper. https://www.hbs.edu/ris/Publication%20Files/12-016_a7e4a5a2-03f9-490d-b093-8f951238dba2.pdf (Project page: https://www.hbs.edu/faculty/Pages/item.aspx?num=41233)
Policy & regulation (governance of online reviews)
Australian Competition and Consumer Commission (ACCC). (n.d.). Online product and service reviews. https://www.accc.gov.au/business/advertising-and-promotions/online-product-and-service-reviews
ACCC. (2023). Online reviews — a guide for business and review platforms. https://www.accc.gov.au/system/files/Online%20reviews%E2%80%94a%20guide%20for%20business%20and%20review%20platforms.pdf
Federal Trade Commission (FTC). (2024, Aug 14). Final rule banning fake reviews and testimonials (press release). https://www.ftc.gov/news-events/news/press-releases/2024/08/federal-trade-commission-announces-final-rule-banning-fake-reviews-testimonials
Federal Trade Commission
Federal Register. (2024, Aug 22). Trade Regulation Rule on the Use of Consumer Reviews and Testimonials (Final rule). https://www.federalregister.gov/documents/2024/08/22/2024-18519/trade-regulation-rule-on-the-use-of-consumer-reviews-and-testimonials (PDF: https://www.govinfo.gov/content/pkg/FR-2024-08-22/pdf/2024-18519.pdf)
Platform transparency & help docs Google Business Profile Help. (n.d.). Understand review scores for local places & businesses. https://support.google.com/business/answer/4801187?hl=en
Google Business Profile Help. (n.d.). Transparency Report — Maps content: Enforcement. https://transparencyreport.google.com/maps-content/enforcement?hl=en (see also Approach/Protections pages).
Wichiencharoen, C. (2023, Nov 22). How Google Maps protects against fake content. The Keyword (Google Blog). https://blog.google/products/maps/how-google-maps-protects-against-fake-content/
Yelp Inc. (2025, Feb 5). Yelp releases 2024 Trust & Safety Report (press release). https://www.yelp-press.com/press-releases/press-release-details/2025/Yelp-Releases-2024-Trust--Safety-Report/default.aspx
History & internet transformation (course reading list)
Berners-Lee, T. (2019, Mar 12). 30 years on, what’s next #ForTheWeb? World Wide Web Foundation. https://webfoundation.org/2019/03/web-birthday-30/
Internet Society. (n.d.). Who makes the Internet work: The Internet ecosystem. https://www.internetsociety.org/internet/who-makes-it-work/
Hafner, K., & Lyon, M. (1996). Where Wizards Stay Up Late: The Origins of the Internet. Simon & Schuster. (Catalog record: https://archive.org/details/wherewizardsstay00haf_vgj
Media & commentary (used for social/attention context)
(Syndicated from The Conversation). Outrage culture is a big, toxic problem. Why do we take part? And how can we stop? (2024, Feb 22). https://eveningreport.nz/2024/02/22/outrage-culture-is-a-big-toxic-problem-why-do-we-take-part-and-how-can-we-stop-223645/ (Original URL on The Conversation is blocked to our browser tool, but you can keep the original link in Medium/Word: https://theconversation.com/outrage-culture-is-a-big-toxic-problem-why-do-we-take-part-and-how-can-we-stop-223645).
Definitions
American Psychological Association. (n.d.). Anchoring. APA Dictionary of Psychology. https://dictionary.apa.org/anchoring
메타데이터
- post_id
- b64d9a816db2
- slug
- why-is-that-restaurant-always-a-4-2-b64d9a816db2
- url
- https://medium.com/@hezhengyang365/why-is-that-restaurant-always-a-4-2-b64d9a816db2
- canonical_url
- https://medium.com/@hezhengyang365/why-is-that-restaurant-always-a-4-2-b64d9a816db2
- author_url
- https://medium.com/@hezhengyang365
- status
- ok
- fetched_at
- 2026-07-26 22:52:32