A Comparative Error Analysis of Time‑of‑Flight Cameras
How seven researchers turned depth sensing into a fair fight — and why it matters for robots, medicine, and your living room
A Comparative Error Analysis of Time‑of‑Flight Cameras
How seven researchers turned depth sensing into a fair fight — and why it matters for robots, medicine, and your living room
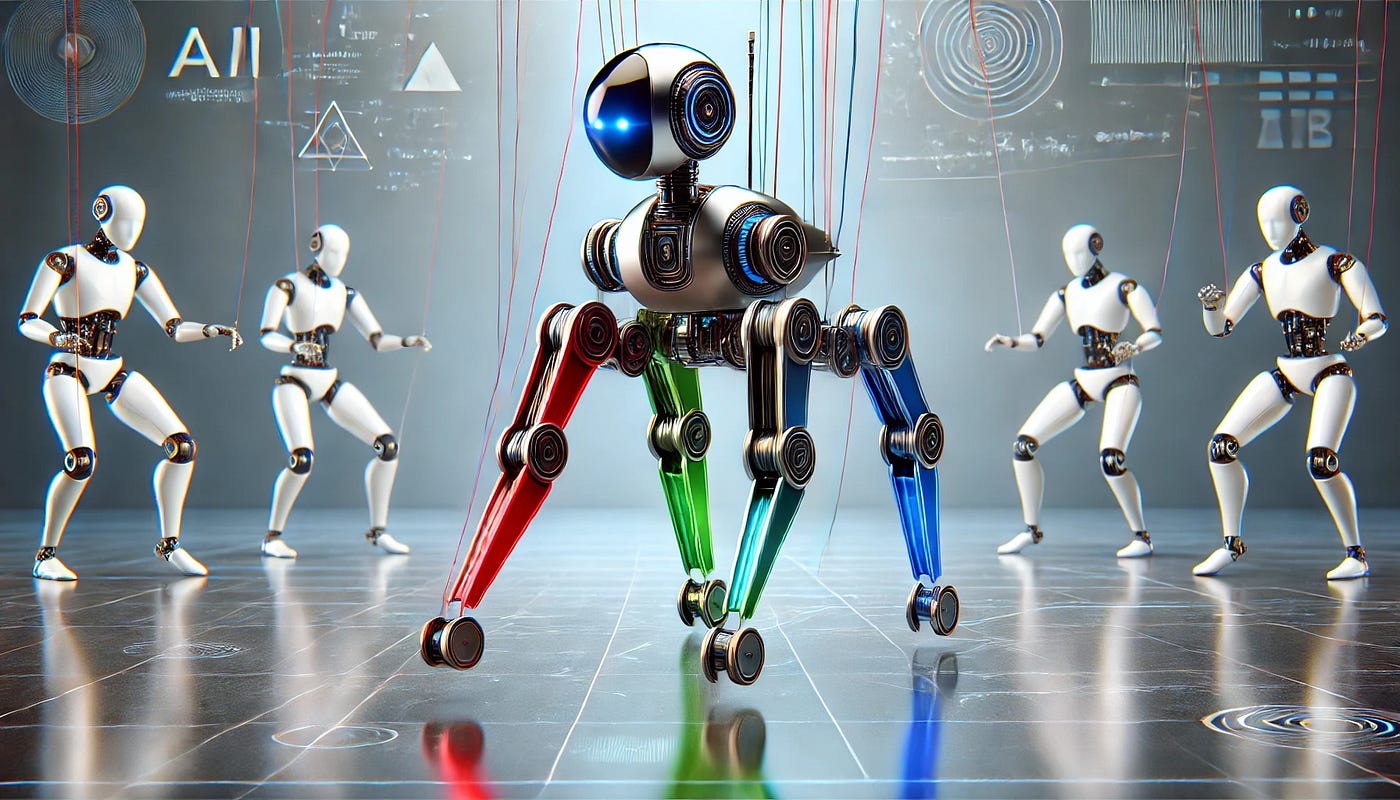
Which depth cameras are how stable? Image created with DALL-E
Time‑of‑flight (ToF) cameras don’t just see the world; they measure it. By bathing a scene in invisible, rapidly modulated light and timing how long those photons take to bounce back, a ToF sensor computes distance per pixel — yielding a live, 3‑D map of the world. This ability is transforming industrial robots that need to grip objects, game consoles that track our movements, and medical devices that must understand anatomy without contact. But there’s a hitch: real ToF cameras are imperfect. They drift as they warm up, they get noisy on dark surfaces, and sometimes the distances they report subtly “wiggle” with range. The study “A Comparative Error Analysis of Current Time‑of‑Flight Sensors” set out to make sense of these quirks, not for a single device, but across eight popular cameras — old workhorses and new consumer favorites alike. It reads like a field guide to what depth cameras get wrong and how to reason about those errors.
What makes this paper inspiring
Instead of proposing one more algorithm in isolation, the authors built a shared testing protocol and ran up to six controlled experiments on each device. They didn’t tweak the sensors endlessly until they looked good. They fixed the environment, turned off automatic “helpful” features whenever possible, and treated each camera like a black box — just as most users must. This discipline turns a fast‑moving technology into something comparable and, crucially, creates a benchmark others can reuse. The authors even committed to releasing the raw data so the community can check, extend, and challenge their findings — an ethos that makes this work bigger than any one lab.
Opening the black boxes
Eight depth cameras took the stage: PMD CamCube 3.0; Mesa SR3100 and SR4000; Creative Senz3D; Microsoft Kinect V2; Fotonic E70; Bluetechnix Argos P100; and the PMD CamBoard nano. Tests were run in a dark room to eliminate stray infrared light and multipath reflections from people or furniture. Before most experiments, cameras were allowed to warm up for two hours; auto‑exposure was disabled; and, when possible, internal filters (which smooth data) were turned off. The team then isolated six error sources that are typical for ToF: temperature drift, temporal noise, integration‑time effects, internal scattering, amplitude‑related distance errors, and the intriguingly named “wiggling.” Together they form a reusable blueprint for future evaluations.
Six ways depth goes wrong (and how to think about them)
ToF imaging sounds straightforward: emit a periodic (often sinusoidal) infrared signal, measure phase shifts at each pixel, and convert them to distances. But real sensors complicate this picture. Temperature changes alter electronics and illumination power. Dark surfaces reflect fewer photons, lowering the signal‑to‑noise ratio. Adjusting the camera’s integration time (roughly analogous to exposure) changes the balance between signal and noise — and, unexpectedly, can bias absolute distances until the system re‑stabilizes thermally. Light can even reflect inside the camera — from sensor to lens and back — so bright objects at one distance corrupt measurements of darker regions elsewhere. Finally, if the emitted waveform isn’t perfectly sinusoidal, distance errors oscillate as range changes, a phenomenon practitioners call wiggling. The authors isolate each factor with a dedicated experiment and quantify its magnitude across devices.
How warm is your world? Temperature drift in numbers
In a 120‑minute “just sit there” test, every camera stared at a white board while the team logged distances once per second. The differences were striking. The Mesa SR3100 stabilized in about five minutes, though a telltale oscillation in distance lined up with the camera’s cooling fan turning on and off. The SR4000 took roughly forty minutes to settle but drifted less overall. The Kinect V2 was a model of composure: even immediately after power‑on, its distances were within about two millimeters of steady‑state and became stable after ~15 minutes. At the other extreme, the Fotonic E70 drifted by more than 4 centimeters and didn’t settle for approximately 100 minutes. The Argos P100 was rapid — about four minutes — while the CamBoard nano required ~18 minutes and showed more noise due to its shorter‑range illumination design. For the CamCube 3.0, differences between two warm‑up curves converged to below 2 mm after ~30 minutes. Figure 6 (page 34) shows the warm‑up curves for all eight devices.
When the scene is dark: temporal noise laid bare
To isolate “random” fluctuations, the authors measured a single pixel 1,000 times while viewing white, gray, and black paper at the same distance and with the same settings. As expected, darker targets were noisier on every camera. With internal filters disabled, the SR4000’s standard deviation grew from about 5 mm on white to 34 mm on black; the CamCube 3.0 went from ~7 mm to 44 mm; the Senz3D from ~9 mm to 51 mm; and the SR3100, an outlier, jumped from ~19 mm to a hefty 165 mm on black. With filtering enabled where available, noise dropped substantially. On the SR4000, black‑target noise shrank to ~9 mm; on the Kinect V2, which applies internal smoothing, standard deviations remained in the single‑digit millimeter range across brightness levels (about 2–9 mm).
Twist the exposure, bend the distance: integration‑time pitfalls
Changing integration time shouldn’t alter what a camera sees — only how confidently it sees it. Yet the experiment shows that switching integration time introduces distance drift that can persist for minutes. On the PMD CamCube 3.0, stepping from 50 µs to 400 µs integration shifted the measured distance by more than 5 cm and still hadn’t fully stabilized within the ten‑minute intervals. The SR3100 was even more sensitive: increasing integration from 400 µs to 6,000 µs produced more than 9 cm of drift, and each step took roughly three minutes to settle. The SR4000 fared best, with variations an order of magnitude smaller, although certain steps still exhibited slow drifts. The Argos P100 drifted by more than 3 cm but stabilized quickly; the E70 showed multi‑centimeter shifts with a jagged pattern suggesting interaction with temperature; and the CamBoard nano, despite sharing a sensor with the Argos, needed longer to re‑stabilize — likely due to different illumination or thermal behavior. The key takeaway is practical: after changing exposure, wait before trusting distances.
When light echoes inside the camera
Internal scattering is the most counter‑intuitive error. Imagine a bright white board close to the camera on one side of the scene and a dark, faraway background elsewhere. Photons reflected from the bright region can bounce from the sensor to the lens and back again, contaminating pixels that look at the dark region. The authors’ “half‑white‑board” setup reveals how pervasive this is. The CamCube 3.0 and the Mesa cameras show clear, global contamination: background distances are pulled toward the bright foreground across much of the image. The Kinect V2 shows the strongest global influence: in parts of the background, the reported distances fall below 80 cm — paradoxically closer than the actual foreground — likely due to the multi‑frequency processing pipeline, though the proprietary algorithm makes a definitive explanation impossible. Some devices try to avoid the problem by rejecting low‑confidence pixels. On the E70 and Argos P100, enabling amplitude‑based confidence thresholds discards much of the contaminated background; when disabled, errors of at least 50 cm appear in low‑amplitude regions, while correctly illuminated side‑wall pixels at ~2.5 m remain accurate.
When darkness lies: the amplitude‑related distance error
Even with no scattering, some sensors measure different distances for bright and dark patches that lie on the same physical plane. To disentangle this amplitude‑related error from scattering, the team cleverly flipped a high‑contrast test pattern — first a white square on black, then its inverse — keeping camera and plane perfectly fixed. If both black regions move the same way, amplitude is to blame; if they move in opposite directions, scattering dominates. The CamCube 3.0 showed a clear amplitude bias of roughly 3.5 cm: dark areas appeared closer to the camera than bright ones. The SR4000 and Senz3D looked cleaner but remained noisy near transitions; the Argos P100 and Kinect V2 were comparatively robust, with deviations largely explainable by scattering rather than true amplitude bias. The E70, with filtering disabled, was noisy in black regions; flipping the pattern implicated scattering more than amplitude there as well. These distinctions matter: algorithms that “fix” amplitude bias won’t cure scattering — and may even hide it.
The sine‑wave slip: understanding wiggling
A classic ToF error arises when the emitted light isn’t a perfect sine wave. The resulting distance error oscillates periodically with range — hence “wiggling.” To quantify it, the authors built a stereo setup with a high‑resolution reference camera and moved a checkerboard away in calibrated steps, comparing ToF measurements to ground truth. The Mesa SR3100 exhibits textbook wiggling: distance errors swing up to 4 cm with a clear sinusoidal pattern. The SR4000 essentially solves it — average errors vary by less than 1 mm over the tested range. The Kinect V2, which fuses multiple modulation frequencies, shows distance‑dependent errors up to about 2 cm without a single clear period. The CamBoard nano shows more than 2 cm of variation and a usable range of about 1.8 m at the chosen settings; the Argos P100, based on the same sensor, appears well corrected but with a shorter effective range of about 1.5 m under the tested integration time. The E70 is well behaved except for two specific distance bands (around 0.75 m and 1.5 m), where outliers likely reflect imperfect correction or detection.
A seven‑person team spanning lab and startup
Behind this careful comparison is a compact collaboration between academia and industry: Peter Fürsattel, Simon Placht, Michael Balda, Christian Schaller, Hannes Hofmann, Andreas Maier, and Christian Riess. Fürsattel, Maier, and Riess are with the Pattern Recognition Laboratory at Friedrich‑Alexander‑Universität Erlangen‑Nürnberg (FAU) in Germany; Placht, Balda, Schaller, and Hofmann are with Metrilus GmbH in Erlangen. That mix — three from the university and four from a depth‑sensing company — helped ensure both scientific rigor and practical relevance. The team also acknowledges national research funding (including DFG programs) that made the extended, carefully controlled measurements possible.
Why this is a step ahead
Plenty of papers report a new correction on one camera. This one delivers something rarer: a systematic way to comparesensors and error sources, with experiments that decouple temperature, noise, exposure, scattering, amplitude bias, and wiggling. It shows that there is no “perfect” device; instead, each camera has a characteristic error fingerprint. That realization changes how we design algorithms. Rather than hand‑tuning for a favorite model, we can aim for methods that are robust across fingerprints — or that explicitly adapt once a camera has been profiled using this protocol. The authors explicitly frame their setup as a benchmark for new cameras and a yardstick to evaluate future correction methods.
What it means for robots, medicine, and your living room
In robotics, a manipulator that picks shiny metal parts above a dark conveyor will see both scattering and amplitude bias; the paper’s numbers help decide whether to reject low‑confidence pixels, compensate amplitude, or change lighting. In medical imaging, where millimeters matter, the warm‑up profiles suggest how long to wait before a device can guide a procedure. For augmented reality at home, the multi‑frequency quirks of the Kinect V2 imply that software should sanity‑check distances in low‑reflectivity areas rather than trusting them blindly. And for everyone building depth datasets, the study’s observation that integration‑time changes cause minutes‑long drift is a caution: log your exposure settings, and don’t mix them mid‑capture if you need consistent ground truth.
Experiments and results at a glance — without losing the details
What stands out numerically is how wide the spread is across devices and error types. Warm‑up drift ranges from mere millimeters (Kinect V2) to centimeters over hours (E70). Temporal noise on dark targets spans single‑digit millimeters (Kinect V2, SR4000 with filters) to more than 16 cm standard deviation (SR3100 without filtering). Integration‑time changes can push absolute distance off by 5–9 cm and stay off for minutes. Scattering can invert depth orderings in the background, making far walls appear closer than the foreground when a bright object is in view. Amplitude‑related bias can reach 3.5 cm in otherwise clean scenes (CamCube 3.0). And wiggling ranges from virtually eliminated (SR4000) to clearly periodic 4 cm swings (SR3100). These are not gotchas for experts only — they are the difference between a robot grasp that succeeds and one that misses, between a medical distance measurement you can trust and one you can’t.
The bottom line
Time‑of‑flight cameras are already everywhere — from gaming to industrial automation — but they don’t all make the same mistakes. By measuring eight devices against six fundamental error sources with well‑described, reproducible setups, this study gives the field a common language and a practical compass. If you build systems that rely on depth, the message is simple and empowering: profile your camera, understand its error fingerprint, and choose or design algorithms accordingly. Progress isn’t just about better sensors; it’s about knowing precisely how they fail — and turning that knowledge into reliability.
This blog post is based on this research article.
If you liked this blog post, I recommend having a look at our free deep learning resources or my YouTube Channel.
Text and images of this article are licensed under Creative Commons License 4.0 Attribution. Feel free to reuse and share any part of this work.
메타데이터
- post_id
- b6f36d7bba68
- slug
- a-comparative-error-analysis-of-time-of-flight-cameras-b6f36d7bba68
- url
- https://medium.com/@akmaier/a-comparative-error-analysis-of-time-of-flight-cameras-b6f36d7bba68
- canonical_url
- https://medium.com/@akmaier/a-comparative-error-analysis-of-time-of-flight-cameras-b6f36d7bba68
- author_url
- https://medium.com/@akmaier
- status
- ok
- fetched_at
- 2026-07-21 09:12:41