Building a Real-Time Data Platform (Part 1):
What does it take to go from raw e-commerce events to a live dashboard? Not a batch job that runs overnight — a pipeline that shows you…
Building a Real-Time Data Platform (Part 1):
What does it take to go from raw e-commerce events to a live dashboard? Not a batch job that runs overnight — a pipeline that shows you what’s happening right now.
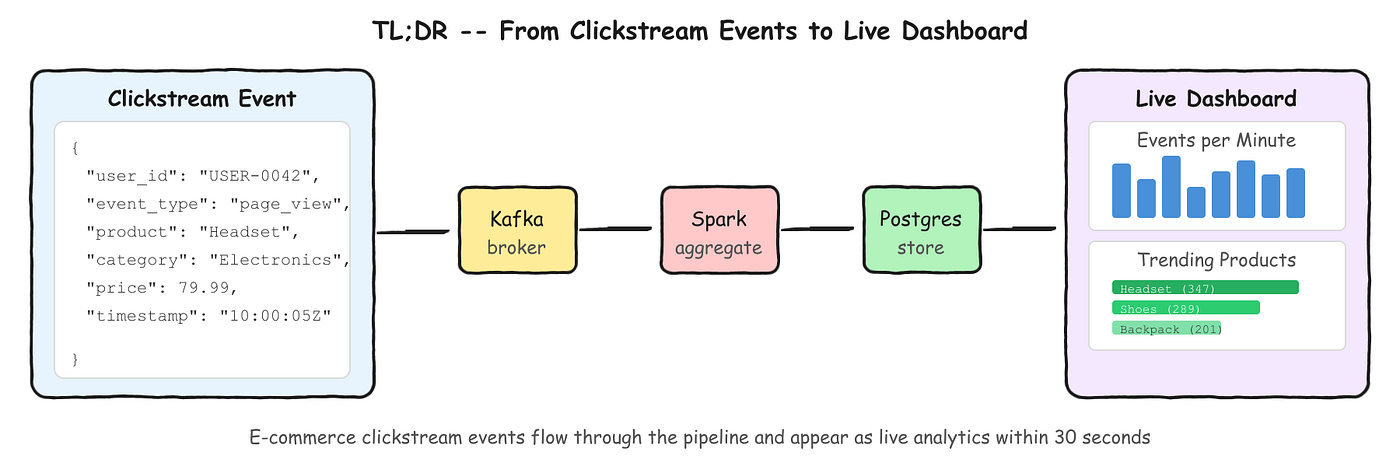
I wanted to find out, so I built one. This article walks through the architecture, how each piece works under the hood, and why it matters. Everything runs locally with Docker Compose.
The Problem
Imagine you run an e-commerce store. You want to know, in real time: which products are trending, how many users are browsing right now, and what events are spiking. Batch analytics won’t cut it — by the time yesterday’s report lands, the moment is gone.
You need a streaming pipeline.
The Architecture

Five components, each with a clear job. But to understand why these components, you need to understand what problem each one solves.
Why Kafka? The Backbone of Any Streaming Pipeline
Kafka is a distributed message broker. But calling it “just a message broker” undersells what it does for this pipeline.

What Kafka does in this pipeline:
- Decoupling. The producer doesn’t know or care who consumes the events. It writes to a topic, and any number of consumers can read from it independently. If I add a second consumer tomorrow (say, a fraud detection service), the producer doesn’t change at all.
- Durability. Events aren’t lost if the consumer goes down. Kafka persists messages to disk with configurable retention. If Spark crashes and restarts an hour later, it picks up right where it left off — no data loss.
- Backpressure handling. If events arrive faster than Spark can process them, Kafka absorbs the spike. Events queue up in the topic until the consumer catches up. Without Kafka, a slow consumer would either drop events or crash the producer.
- Partitioning. The topic is split into partitions. Events are routed to partitions by key — in this case,
user_id. This means all events from the same user land on the same partition, preserving order per user. It also enables parallel consumption: Spark can read from multiple partitions simultaneously.
In short: Kafka turns a fragile point-to-point connection into a reliable, scalable buffer between data production and data processing.
How Spark Structured Streaming Works Under the Hood
Spark Structured Streaming is the processing engine — it reads events from Kafka, transforms them, and writes results to PostgreSQL. But the way it does this is specific and worth understanding.
The Micro-Batch Model
Spark doesn’t process events one at a time. Instead, it uses a micro-batch approach:

Every 30 seconds (configurable via processingTime), Spark:
- Polls Kafka for all new events since the last checkpoint
- Builds a DataFrame — the same abstraction as batch Spark, which means you can use familiar operations like
groupBy,agg,filter - Runs the aggregation logic as a regular Spark job (distributed across workers)
- Writes results to PostgreSQL via
foreachBatch - Commits offsets so the next batch starts where this one ended
This is why it’s called structured streaming — it treats the stream as an unbounded table that keeps getting new rows appended. Each micro-batch processes the new rows.
The Spark Cluster

The Master (driver) orchestrates: it decides when to trigger each batch, which partitions to read, and how to distribute work. The Worker (executor) does the heavy lifting: reading data, running the aggregation, and writing results.
In this project there’s one worker, but in production you’d scale horizontally — add more workers, and Spark distributes the Kafka partitions across them automatically.
The Streaming Job
Here’s the core of the Spark streaming job. It reads from Kafka, parses JSON into a structured DataFrame, and applies two aggregations:
# Read raw events from Kafka
raw_stream = (
    spark.readStream
    .format("kafka")
    .option("kafka.bootstrap.servers", "kafka:29092")
    .option("subscribe", "clickstream-events")
    .option("startingOffsets", "latest")
    .load()
)
# Parse JSON into structured rows
parsed = (
raw_stream
.selectExpr("CAST(value AS STRING) as json_str")
.select(from_json(col("json_str"), event_schema).alias("data"))
.select("data.*")
.withColumn("event_ts", col("timestamp").cast(TimestampType()))
)# Trigger a micro-batch every 30 seconds
query = (
parsed.writeStream
.foreachBatch(write_to_postgres)
.outputMode("update")
.trigger(processingTime="30 seconds")
.start()
)Inside foreachBatch, two aggregations run on each batch:
1. Events per minute — a 1-minute tumbling window that counts events and unique users:
events_per_min = batch_df.groupBy(
    window(col("event_ts"), "1 minute"),
    col("event_type")
).agg(
    count("*").alias("event_count"),
    approx_count_distinct("user_id").alias("unique_users")
)
2. Trending products — the top 20 most-viewed products, overwritten each batch:
trending = batch_df.groupBy(
    "product_id", "product_name", "category"
).agg(
    count("*").alias("view_count")
).orderBy(desc("view_count")).limit(20)
This gets overwritten each batch so the dashboard always shows the current leaderboard
Windowed Aggregations
The streaming job applies two transformations:

Tumbling windows are fixed, non-overlapping time intervals. Every event falls into exactly one window based on its timestamp. At the end of each micro-batch, Spark groups events by their window and event type, counts them, and writes the result.
The second aggregation — trending products — is simpler: it groups by product, counts total views, and keeps the top 20. This gets overwritten each batch so the dashboard always shows the current leaderboard.
The Trade-off: Latency vs. Simplicity
The micro-batch model means your results are always at most 30 seconds behind reality. For a clickstream dashboard, that’s fine. But it’s a fundamental architectural limit — even if you set the trigger to 1 second, there’s overhead in polling, building the DataFrame, and committing. Spark wasn’t designed for sub-second latency.
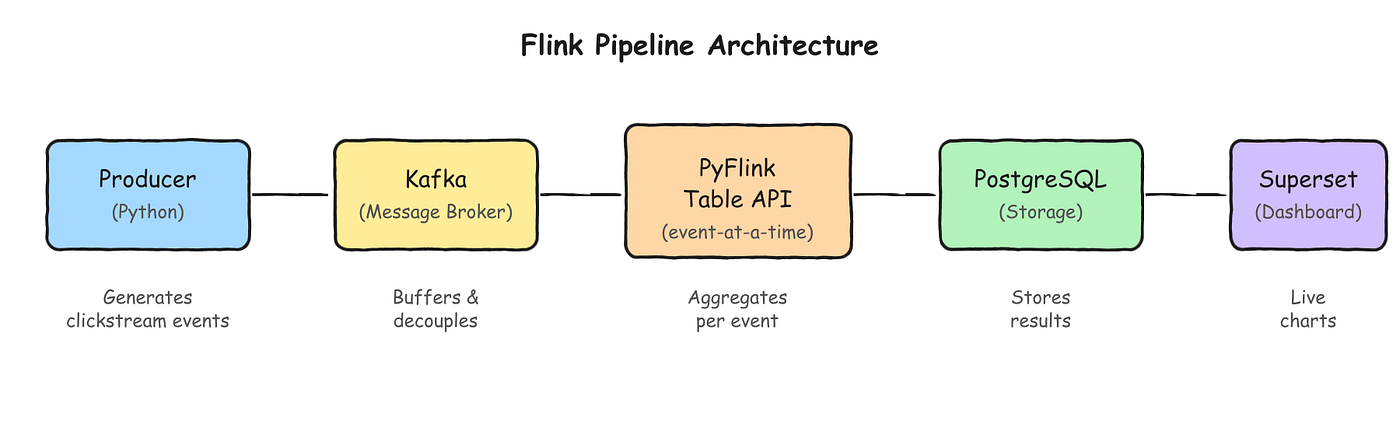
This trade-off is what pushed me to explore a different engine in the next article.
The Storage and Visualization Layer

PostgreSQL stores the pre-aggregated results — not the raw events. This is an important design choice: the stream processor does the heavy computation, and the database just serves the final numbers. This keeps queries fast and the schema simple.
Superset connects to PostgreSQL and provides charts and dashboards. Every time you refresh, it runs a SQL query against the latest aggregated data.

The Infrastructure
The entire stack — Zookeeper, Kafka, Spark Master, Spark Worker, PostgreSQL, and Superset — runs as six Docker containers defined in a single docker-compose.yml.

services:
  zookeeper:
    image: confluentinc/cp-zookeeper:7.6.0
    environment:
      ZOOKEEPER_CLIENT_PORT: 2181

kafka:
    image: confluentinc/cp-kafka:7.6.0
    depends_on: [zookeeper]
    ports: ["9092:9092"]
    environment:
      KAFKA_ZOOKEEPER_CONNECT: zookeeper:2181
      KAFKA_ADVERTISED_LISTENERS: PLAINTEXT://kafka:29092,PLAINTEXT_HOST://localhost:9092

spark:
    image: apache/spark:3.5.0
    ports: ["8080:8080", "7077:7077"]
    volumes: [./spark-apps:/opt/spark/apps]

spark-worker:
    image: apache/spark:3.5.0
    depends_on: [spark]
    environment:
      SPARK_WORKER_MEMORY: 1G
      SPARK_WORKER_CORES: 2

postgres:
    image: postgres:15
    ports: ["5432:5432"]
    volumes: [./init-db:/docker-entrypoint-initdb.d]

superset:
    image: apache/superset:latest
    depends_on: [kafka, postgres]
    ports: ["8088:8088"]
Kafka is more than a queue. Its partitioning model, offset management, and durability guarantees are what make a streaming pipeline reliable. Without it, you’re building on sand.
Spark’s micro-batch model is a double-edged sword. It’s simple to reason about (it’s basically batch jobs on a loop), and you get the full power of Spark’s DataFrame API. But the 30-second floor on latency is baked into the architecture. You can’t optimize your way out of it.
Pre-aggregate before you store. Writing raw events to PostgreSQL and aggregating at query time would have been simpler to build but slower to query. Pushing the aggregation into the stream processor keeps the database lean and dashboards responsive.
This worked. But I immediately wanted to challenge two of my choices: the processing engine and the storage layer. In the next article, I’ll rebuild this exact pipeline with Apache Flink — and show what changes when you move from micro-batch to true event-at-a-time processing.
Next in the series: Spark vs Flink — I Built the Same Pipeline Twice
메타데이터
- post_id
- b7e826b27a2e
- slug
- realtime-data-platform-series-1-b7e826b27a2e
- url
- https://medium.com/@arfatef/realtime-data-platform-series-1-b7e826b27a2e
- canonical_url
- https://medium.com/@arfatef/realtime-data-platform-series-1-b7e826b27a2e
- author_url
- https://medium.com/@arfatef
- status
- ok
- fetched_at
- 2026-06-12 18:14:10