JVM Memory Internals Explained for Backend Engineers (With Real Production Examples)
The JVM Is Smart… But Memory Problems Still Bring Down Production
JVM Memory Internals Explained for Backend Engineers (With Real Production Examples)
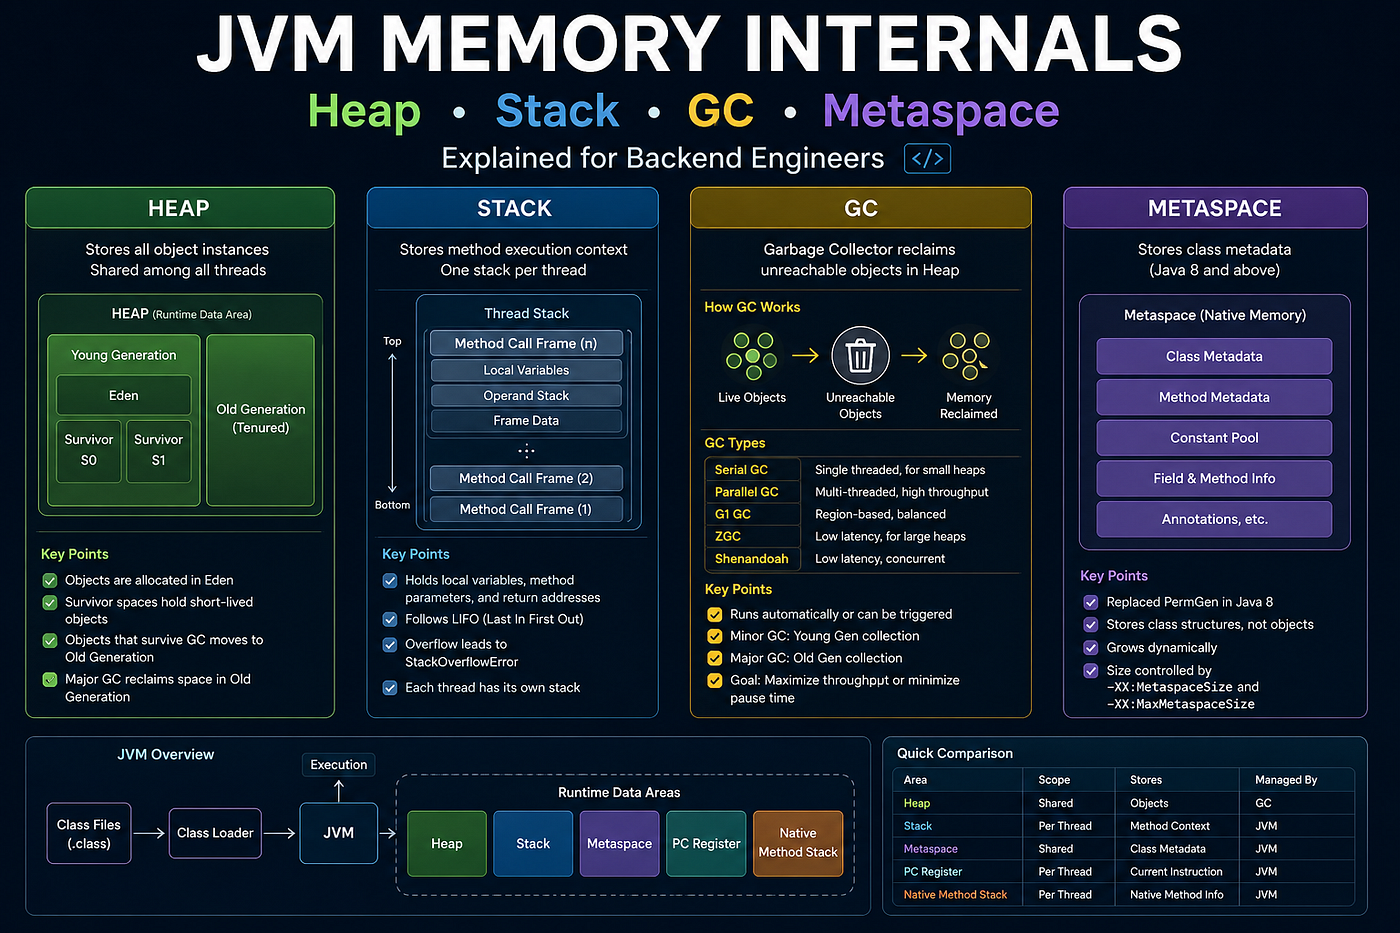
Java Memory Heap → Stack → GC → Metaspace Understand by Hitesh Laxman
The JVM Is Smart… But Memory Problems Still Bring Down Production
If you are a backend engineer working with Java or Spring Boot applications, sooner or later you will face one of these issues:
- Application suddenly becomes slow
- CPU usage jumps to 100%
- Pods restart continuously in Kubernetes
- APIs start timing out
- Memory usage keeps increasing
OutOfMemoryErrorcrashes production
Most of these problems are directly related to how JVM memory works internally.
The problem is:
Many developers use Java daily but never deeply understand:
- Heap
- Stack
- Metaspace
- Garbage Collection
- Thread memory
- Memory leaks
- JVM tuning
And when production issues happen, debugging becomes painful.
In this article, we will understand JVM memory internals in simple language with:
✅ Visual diagrams ✅ Real production examples ✅ Common mistakes ✅ OutOfMemoryError scenarios ✅ JVM tuning tips ✅ Memory leak debugging concepts
By the end, you’ll understand how Java actually manages memory behind the scenes.
What Happens When a Java Application Starts?
When you run a Java application:
java -jar app.jarJVM creates multiple memory areas internally.
Here’s the simplified architecture:
+--------------------------------------------------+
|                    JVM MEMORY                    |
+--------------------------------------------------+

Heap Memory
   +------------------------------------------+
   | Young Gen | Old Gen                     |
   +------------------------------------------+
   Stack Memory
   +------------------------------------------+
   | Thread 1 Stack                          |
   | Thread 2 Stack                          |
   | Thread 3 Stack                          |
   +------------------------------------------+
   Metaspace
   +------------------------------------------+
   | Class Metadata                          |
   | Method Metadata                         |
   +------------------------------------------+
   Native Memory
   +------------------------------------------+
   | JVM Internal Structures                 |
   +------------------------------------------+
Each area has a different responsibility.
Let’s understand them one by one.
1. Heap Memory
Heap is the main memory area where objects are stored.
Whenever you create an object:
User user = new User();The object is created inside the Heap.
Heap Structure
Heap is divided into generations:
+-----------------------------------+
|            HEAP                   |
+-----------------------------------+

Young Generation
 +-------------------------------+
 | Eden | Survivor 1 | Survivor2 |
 +-------------------------------+
 Old Generation
 +-------------------------------+
 | Long Living Objects           |
 +-------------------------------+
Young Generation
New objects are created here.
Example:
String name = "Hitesh";Most objects die quickly.
Examples:
- Request objects
- DTOs
- API responses
- Temporary variables
GC runs frequently here.
This GC is called:
Minor GC
Old Generation
Objects that survive multiple GC cycles move to Old Generation.
Examples:
- Cache data
- Singleton beans
- Large collections
- Long-running sessions
GC here is expensive.
This GC is called:
Major GC or Full GC
Real Production Example — Heap Issue
Imagine:
A Spring Boot service receives 50,000 requests per minute.
Each request creates:
- DTOs
- JSON objects
- Database entities
If GC cannot clean objects fast enough:
Heap usage increases continuously.
Eventually:
java.lang.OutOfMemoryError: Java heap spaceApplication crashes.
How to Monitor Heap
Useful JVM tools:
- JVisualVM
- JConsole
- Eclipse MAT
- Prometheus + Grafana
- Java Flight Recorder (JFR)
Useful JVM flags:
-Xms2G
-Xmx2G
Where:
Xms→ Initial heap sizeXmx→ Maximum heap size
Example:
java -Xms2G -Xmx4G -jar app.jar2. Stack Memory
Every thread gets its own stack memory.
Stack stores:
- Method calls
- Local variables
- Function execution state
Example:
public void process() {
    int x = 10;
    calculate(x);
}
x is stored in Stack memory.
Stack Memory Visualization
Thread Stack

+------------------+
| calculate()      |
+------------------+
| process()        |
+------------------+
| main()           |
+------------------+
Each method call creates a new stack frame.
When method finishes:
- Frame is removed automatically
Stack memory is very fast.
Stack Overflow Error Example
Recursive calls can exhaust stack memory.
Example:
public void recursive() {
    recursive();
}
Output:
java.lang.StackOverflowErrorBecause:
- JVM keeps creating stack frames
- Stack becomes full
Real Production Example — Stack Problem
A badly designed recursive JSON parser in production caused:
StackOverflowErrorReason:
- Deeply nested JSON
- Infinite recursion
Impact:
- APIs started failing
- Kubernetes pods restarted continuously
Stack Size Configuration
-Xss512kWhere:
Xss= Thread stack size
Important: More threads = More stack memory usage.
3. Metaspace
Before Java 8:
- JVM used PermGen
After Java 8:
- JVM uses Metaspace
Metaspace stores:
- Class metadata
- Method metadata
- ClassLoader information
NOT actual object data.
MetaSpace Visualization
+--------------------------------+
|           METASPACE            |
+--------------------------------+
| Class Definitions              |
| Method Information             |
| Static Metadata                |
+--------------------------------+
Real Production Example — Metaspace Leak
A microservice dynamically generated proxy classes repeatedly.
Problem:
- Old classes were never unloaded
- Metaspace kept growing
Eventually:
java.lang.OutOfMemoryError: MetaspaceRoot cause: Improper ClassLoader cleanup.
Very common in:
- Spring Boot DevTools
- Dynamic proxies
- Reflection-heavy frameworks
Metaspace Tuning
-XX:MetaspaceSize=256m
-XX:MaxMetaspaceSize=512m
4. Garbage Collection (GC)
Java automatically removes unused objects.
This process is called:
Garbage Collection
Why GC Exists
Without GC:
Developers would manually manage memory like C/C++.
Java simplifies this.
Example:
User user = new User();
user = null;
Object becomes eligible for GC.
GC Lifecycle
Object Created
       ↓
Used by Application
       ↓
No Longer Referenced
       ↓
GC Removes It
Types of GC
Minor GC
Cleans Young Generation.
Fast and frequent.
Major GC
Cleans Old Generation.
Slower.
Full GC
Cleans entire heap.
Very expensive.
Can pause applications.
Real Production GC Problem
A payment system had:
- Huge cache objects
- Large Kafka payloads
- High traffic
Symptoms:
- Full GC every 20 seconds
- API latency increased from 50ms → 8 seconds
Root cause: Heap sizing issue.
Solution:
- Increased heap
- Optimized object creation
- Tuned G1GC
Latency improved significantly.
Common GC Algorithms
Serial GC
Single-threaded.
Good for small applications.
Parallel GC
Uses multiple threads.
High throughput.
G1GC (Most Popular)
Default in modern Java.
Good for:
- Large heap
- Low pause time
Enable:
-XX:+UseG1GCZGC
Ultra-low latency GC.
Best for huge applications.
GC Monitoring Commands
jstat -gc PID 1000jmap -heap PIDjcmd PID GC.heap_info5. Memory Leaks in Java
Many developers think:
“Java has GC, so memory leaks are impossible.”
Wrong.
Java can absolutely have memory leaks.
What Is a Memory Leak?
Memory leak means:
Objects are no longer needed but still referenced.
So GC cannot remove them.
Memory Leak Example
static List<String> cache = new ArrayList<>();

public void process() {
    cache.add(UUID.randomUUID().toString());
}
Problem:
- List grows forever
- Objects never removed
Eventually: Heap becomes full.
Real Production Memory Leak
A Kafka consumer service stored failed events inside a static map.
Map<String, Event> failedEvents = new HashMap<>();Problem:
- Entries never removed
Impact:
- Heap usage kept increasing
- Full GC frequency increased
- Eventually OOM crash
Common Causes of Memory Leaks
Static Collections
static Map cache = new HashMap();Unclosed Resources
FileInputStream fis = new FileInputStream(file);Without closing:
- Native memory leaks possible
ThreadLocal Misuse
Very common in enterprise applications.
Listener Registrations
Objects remain referenced forever.
Large Cache Without Eviction
Example:
- Redis fallback cache
- In-memory map cache
Detecting Memory Leaks
Best tools:
- Eclipse MAT
- Heap Dumps
- VisualVM
- Java Flight Recorder
Heap dump command:
jmap -dump:live,format=b,file=heap.hprof PID6. OutOfMemoryError Explained
OutOfMemoryError happens when JVM cannot allocate memory.
Common OOM Types
Java Heap Space
java.lang.OutOfMemoryError: Java heap spaceHeap exhausted.
GC Overhead Limit Exceeded
java.lang.OutOfMemoryError: GC overhead limit exceededGC spends too much time cleaning tiny memory.
Metaspace
java.lang.OutOfMemoryError: MetaspaceClass metadata exhausted.
Unable to Create New Native Thread
java.lang.OutOfMemoryError:
unable to create native thread
Too many threads.
Real Production OOM Scenario
A Spring Boot service had:
- Thread pool misconfiguration
- Each request created new thread
- Traffic spike during sale event
Result:
- 25,000 threads created
- Native memory exhausted
- Entire node became unstable
7. Thread Memory Explained
Each thread consumes memory.
Thread memory includes:
- Stack memory
- Native thread structures
Thread Memory Visualization
Thread 1
+----------------------+
| Stack                |
+----------------------+

Thread 2
+----------------------+
| Stack                |
+----------------------+

More threads = More memory consumption.
Why Too Many Threads Are Dangerous
Example:
If:
- One thread stack = 1MB
- 10,000 threads created
Memory required:
10 GB stack memoryApplication may crash.
Real Production Example — Thread Explosion
A backend service used:
new Thread()inside every API request.
Traffic spike happened.
Thread count increased massively.
Result:
- CPU spike
- Memory exhaustion
- Pod restarts
Solution: Use thread pools.
Best Practices for JVM Memory Management
Use Proper Heap Sizing
Avoid:
- Too small heap
- Too large heap
Use G1GC for Modern Applications
-XX:+UseG1GCAvoid Large Object Creation
Reuse objects where possible.
Monitor GC Metrics
Track:
- GC pause time
- Heap usage
- Allocation rate
Use Thread Pools
Never create unlimited threads.
Use:
ExecutorServiceLimit Cache Size
Use eviction policies.
Example:
- Caffeine Cache
- Redis TTL
JVM Monitoring Architecture Example
Application
      ↓
Micrometer
      ↓
Prometheus
      ↓
Grafana Dashboard
Track:
- Heap usage
- GC pauses
- Thread count
- Metaspace usage
JVM Memory Tuning Example for Spring Boot
java \
-Xms2G \
-Xmx2G \
-XX:+UseG1GC \
-XX:MaxGCPauseMillis=200 \
-jar app.jar
Final Thoughts
Understanding JVM memory internals is one of the most important skills for backend engineers.
Because in real production systems:
Performance problems are often memory problems.
Once you understand:
- Heap
- Stack
- Metaspace
- GC
- Threads
- Memory leaks
You become much better at:
- Debugging production issues
- Optimizing applications
- Reducing latency
- Preventing outages
And honestly, this knowledge separates average Java developers from strong backend engineers.
If This Helped You…
👏 Clap for this article (You know what one can clap up 50 times) 🔁 Share it with your backend engineer friends 💬 Comment your biggest JVM production issue
And follow for more deep backend engineering content on:
- Java
- Spring Boot
- Kafka
- AWS
- JVM Internals
- Microservices
- Performance Engineering
You may also read **Spring Boot Security Guide From Beginners to Advance**
메타데이터
- post_id
- b87f5a8a125f
- slug
- jvm-memory-internals-explained-for-backend-engineers-with-real-production-examples-b87f5a8a125f
- url
- https://medium.com/@hiteshdhamshaniya-wvmagic/jvm-memory-internals-explained-for-backend-engineers-with-real-production-examples-b87f5a8a125f
- canonical_url
- https://medium.com/@hiteshdhamshaniya-wvmagic/jvm-memory-internals-explained-for-backend-engineers-with-real-production-examples-b87f5a8a125f
- author_url
- https://medium.com/@hiteshdhamshaniya-wvmagic
- status
- ok
- fetched_at
- 2026-06-11 17:15:47