The RabbitMQ Failure That Didn’t Show Up in Logs for 3 Hours
A production postmortem from a manufacturing company nobody will name
The RabbitMQ Failure That Didn’t Show Up in Logs for 3 Hours
A production postmortem from a manufacturing company nobody will name
It was a Tuesday afternoon. Boring deploy. Nothing changed in the messaging layer. I was about to close my laptop when the customer support lead pinged me on Slack.
“Are we processing orders? Some clients are saying their confirmations never arrived.”
I opened Grafana. Everything green. API latency normal. Queue depth zero. CPU fine. Memory fine. I told her it was probably an email delivery issue and went back to my ticket.
Forty minutes later she pinged again. Different clients. Same problem.
That’s when my stomach dropped.
What the system actually did
I was working at a manufacturing company. Not naming it. Doesn’t matter. The architecture was simple on paper.
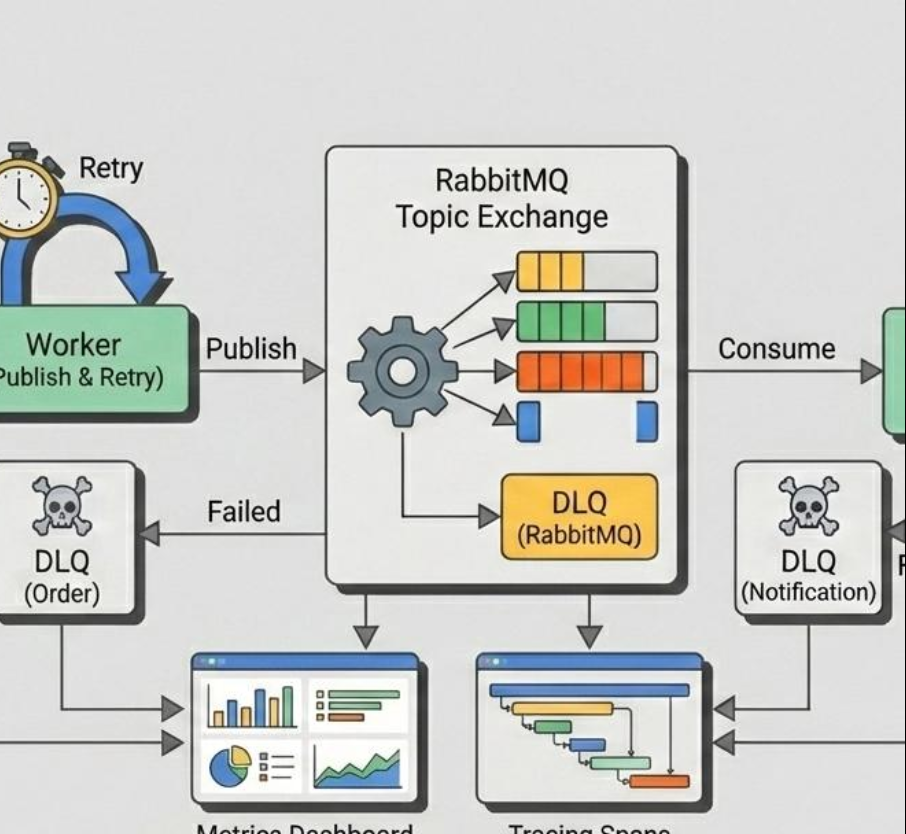
An order came in through the web API. The API service published a message to a RabbitMQ exchange. A consumer service picked it up, did the heavy work — validated inventory, generated documents, fired off a confirmation email, wrote to the audit table. Standard fan-out pattern. Three consumers behind a direct exchange. Manual acknowledgment because we didn’t want to lose messages if a consumer crashed mid-processing.
The system had been running for two years. Nobody touched it. Nobody needed to touch it.
That was the problem.
The first hour I spent looking in the wrong place
I checked the API logs. Orders were being received. JSON payloads looked clean. The publish call returned without error.
I checked RabbitMQ. The management UI showed the queue at zero. No backlog. Consumers connected. Everything healthy.
So I assumed the consumer was processing them and the bug was downstream. I tailed the consumer logs. The consumer was logging messages — “received order 4471”, “received order 4472” — and nothing after that. No success log. No error log. Just the receive line, and then silence, and then the next receive line.
I thought it was a logging problem.
I thought maybe the success log got removed in some old commit. I went into Git, looked at the consumer file. The success log was there. The error log was there. There was just nothing being written between “received” and “processed”.
That’s when I started reading the actual code.
The thing that was wrong
The consumer was Spring Boot. The handler looked roughly like this:
@RabbitListener(queues = "order.processing")
public void handle(OrderMessage message, Channel channel,
                   @Header(AmqpHeaders.DELIVERY_TAG) long tag) {
    try {
        log.info("received order {}", message.getOrderId());

        orderService.process(message);
        emailService.sendConfirmation(message);
        auditService.record(message);

        channel.basicAck(tag, false);
        log.info("processed order {}", message.getOrderId());
    } catch (Exception e) {
        log.error("failed to process order", e);
        channel.basicAck(tag, false);
    }
}
Read it slowly. Take your time.
The exception was being caught. The exception was being acked. And the error log — the one I was searching for in vain for an hour — was using a logger configured with a filter that dropped anything below WARN for that package, set by someone two years ago for a completely unrelated noisy library.
So when emailService.sendConfirmation started throwing because an SMTP credential had expired that morning, the consumer caught the exception, swallowed it, acked the message, and moved on. The order never got processed. The audit row was never written. The email never went out. RabbitMQ saw a happy acknowledgment and removed the message forever.
Three hours of orders. Gone. No queue backlog because we acked them. No error logs because the logger filter ate them. No dead letter queue because we configured manual ack to retry on nack but we weren’t nacking — we were acking failures as if they were successes.
It looked exactly like a healthy system because we had told it to look that way.
What I changed that afternoon
Three things, in order of how scared I was when I implemented them.
First, the ack pattern. You never ack on exception. You nack, you let RabbitMQ retry, and after N retries you route to a dead letter exchange where a human can see it.
} catch (Exception e) {
    log.error("failed to process order {}", message.getOrderId(), e);
    channel.basicNack(tag, false, false); // false = no requeue, goes to DLX
}
Second, the logger config. Removed the package-level filter. Added a separate alerting channel that fires on any ERROR from the consumer package, regardless of filters elsewhere in the config tree.
Third, the dead letter exchange. We had configured one but never wired it. Added a queue under the DLX, added a small dashboard panel that just plots “messages in DLQ” — if it’s not zero, something is wrong, and you see it instantly without having to read a single log line.
The deploy went out that evening. I stayed late and reprocessed every message we could recover from the API access logs. Forty-seven orders. We caught most of them within twenty-four hours. The ones we didn’t, the support team called personally.
Why this is the worst kind of failure
Loud failures are easy. Your service crashes, alerts fire, you fix it. Painful but bounded.
Silent failures are different. They look like success. They emit success metrics. They keep your dashboards green. They convince you the system is healthy while you are losing customer data in real time. By the time you notice, the damage is days old and you have no idea how far back it goes.
This is the pattern I started collecting after that day. Silent failures across distributed systems — message queues that ack-on-error, retry loops that swallow exceptions, circuit breakers stuck half-open, database transactions that look committed but rolled back silently, HTTP clients that return 200 with empty bodies because the upstream returned malformed JSON.
I wrote them up. Forty-seven incidents now, from three companies, all with the same shape: the system reports success, the user gets nothing, and you find out from a customer support ticket two days later.
If you’ve ever debugged something that “should work” while your dashboards insist nothing is wrong — the playbook for these silent-failure patterns is in the Application Incident Playbook. Forty-seven incidents, the diagnostic steps I follow for each one, the exact configuration mistakes that cause them, and the patches that prevent them coming back. Twenty-five dollars. Thirty-day money back if it doesn’t help on a real incident.
Three things to check on your own system this week
If you’ve got a message queue in production right now, three checks. Each takes ten minutes.
One. Search your codebase for basicAck and read every surrounding catch block. If any of them ack after catching an exception, you have a silent failure waiting. Replace with nack and route to a dead letter exchange.
Two. Look at your dead letter queue depth in your monitoring tool. If it’s been zero for six months, that’s not because you have no failures. That’s because you don’t have a DLQ wired up. Most teams configure one and never connect it. Check.
Three. Take one log filter in your application config. Read what package it silences. Ask yourself when it was added, by whom, and what it might be hiding right now. Logger filters are landmines that get added once and never reviewed.
You will find at least one of these in your codebase. Probably all three.
What I write about
I write about production incidents — the kind that come out of real systems, not blog tutorials. Weekly, on Substack. One incident, one root cause, one fix you can apply to your own stack. Free.
메타데이터
- post_id
- b8ab0b100a84
- slug
- the-rabbitmq-failure-that-didnt-show-up-in-logs-for-3-hours-b8ab0b100a84
- url
- https://medium.com/@developer_programmer/the-rabbitmq-failure-that-didnt-show-up-in-logs-for-3-hours-b8ab0b100a84
- canonical_url
- https://medium.com/@developer_programmer/the-rabbitmq-failure-that-didnt-show-up-in-logs-for-3-hours-b8ab0b100a84
- author_url
- https://medium.com/@developer_programmer
- status
- ok
- fetched_at
- 2026-06-09 15:37:30